The Witching Hour of the Yield Curve

To an economic layman such as myself, the words “inverted yield curve” do not immediately mean too much. However, hearing that this past August was the first time the U.S. had an inverted yield curve since before the 2008 recession seems like cause for alarm, so I have attempted to break down this indicator. 

The yield curve measures how the interest rate (or yield percentage) changes over a certain maturation period. With U.S. Treasury bonds, the curve takes into account whether the Fed raises or lowers interest rates and if investors believe their money will have future value or not.  When looking at the curve, it’s clear to see that in a healthy economy the yield curve should slope upward as that indicates investors believe that both investing now is wise and that future bonds will appreciate in value. When the yield curve inverts in slope, this indicates that investor confidence in the market’s future is low and that they would rather keep their money in long term bonds than current investments. Yield percentage on long term bonds (Ten years +) has an inverse relationship with demand, so as investor and Federal Reserve confidence in the market goes up, long-term yield prices will drop. 

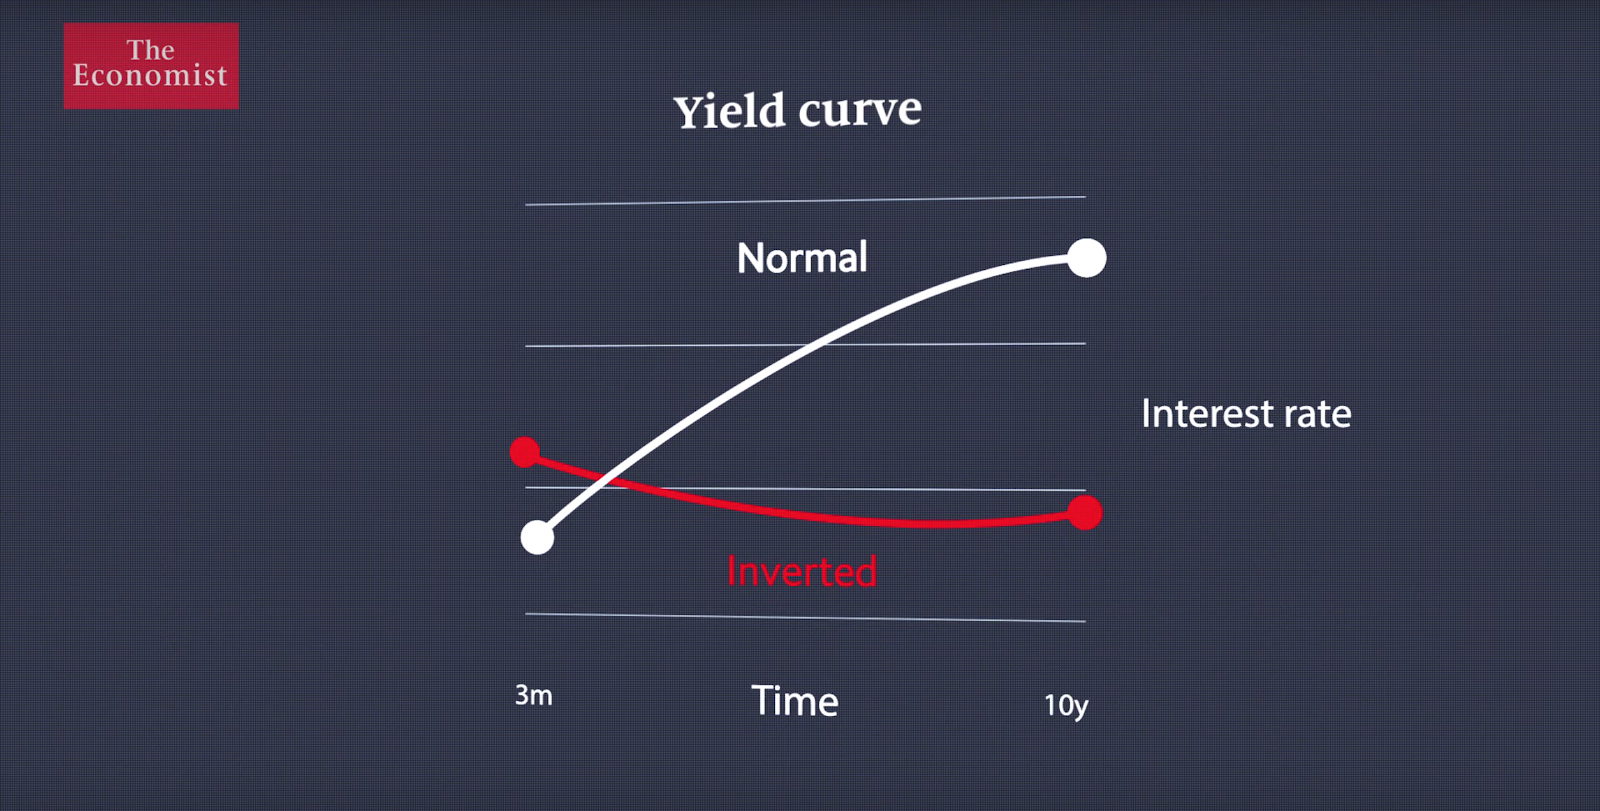
Basically, when the yield percentage on bonds is greater for ten year bonds, that means less investors are buying ten year bonds and are instead investing in short term high-risk and high-reward investments. This bodes well for the economy as it means investors will spend believing they can get return soon. If the curve inverts, this means investors do not want to spend now and in turn that U.S. economic prospects look dim. Summer of 2019 has been the first time since the Great Recession that the curve has inverted, leaving economists fearing what comes next. 

Economists are concerned and wary because historically, the inverted yield curve occurred six to nine months before recessions (only one time in the past 70 years has this indicator been proven wrong). However, the inverted yield curve doesn’t necessarily directly cause recessions. The tricky reality is that economists have not been able to come to a consensus on what the isolated link between the inverted yield curve and recessions are, so for now though there is cause for concern, there isn’t cause for despair. 

For the present U.S. economy, these indicators could point towards the uncertainty surrounding trade agreements and tariffs (particularly with China). Some say this will make goods cost more,  and that there will be fewer jobs both supporting the production of those goods as employees and paying for the goods as consumers. Most economists agree that recessions are an inevitable season in a country’s economic life, and a recent study by the National Association for Business Economics found that 74% of business economists believe a recession will hit the U.S. by 2021. The consistency with which inverted yield curves have predicted recessions is stark and undeniable, but in order to more wholly assess the health of the U.S. economy, the many other economic indicators have to be weighed equally. 

Sources:

  1. https://www.marketwatch.com/story/5-things-investors-need-to-know-about-an-inverted-yield-curve-2019-08-14
  2. https://www.youtube.com/watch?v=ukfA65KYyBY
  3. https://www.youtube.com/watch?v=bItazfbSptI
  4. https://www.youtube.com/watch?v=oW4hfaiXKG8

Black Death: Higher Wages Drive Progress?

Instead of trying to predict the future economic outlook of today, this blog takes on a retrospective stance on European economic growth from the 14th-16th centuries.

In the 1340s Italian ports in Genoa and Venice thrived on trade and commerce. Traders from Asia were a regular sight, bringing spices and other luxury commodities from distant lands. It was a time of relative prosperity; however, within a couple of years, Europe would live through its worst plague epidemic, Black Death, that would ultimately wipe out roughly a third of the European population and change the course of its economy. In less than a decade more than 20 million people perished from the mysterious disease. Yet, amidst the chaos something interesting was brewing – wages started climbing rapidly.

At the time of the feudal system, peasants rarely had any choice and no income mobility. The wages were low, and the cost of capital was high. The Black Death has suddenly swayed the odds in the peasants’ favor. In order to understand how the epidemic affected labor and wages, it’s crucial to understand the supply and demand framework. The supply and demand of labor rest at equilibrium, meaning that if the working population were to suddenly drop, labor would become scarcer and wages would rise, establishing a new equilibrium. As the population rapidly decreased, there were fewer labor units available. It was only logical for peasants to demand higher wages from their lords. Lords, in turn, had no choice but to pay more because the number of fields to plow, remained the same. 


(Image cited from The Economist)

The wages were so high that England passed a law in 1349 forcing peasants to accept wages they received before the plague. As peasants gained more leverage, many lords were forced to give them broader freedoms and better working conditions. This time period of high wages became a milestone that ultimately led to the dissolution of Feudalism altogether in the 16th century.

As the wages spiraled out of control so did the inflation. According to The Economist, within the first 4 years of the epidemic, the average wheat prices rose 300%. Nevertheless, the lords enjoyed higher profits as prices went up and the peasants appreciated higher wages. People in Europe now had more purchasing power and a stronger incentive to maximize the efficiency of production as labor costs piled up.

Although the European economy underwent a post-plague recession it has reemerged as an economic powerhouse a century later. New innovations stemmed from scarce labor, higher wages, and greater purchasing power. Novel double-entry bookkeeping revolutionized accounting processes while banking systems became more complex. The printing press was invented in an effort to balance out the high wages and labor deficit. Technological advancements in shipbuilding allowed for exploration and unprecedented trade growth.

The Black Death was a horrifying time period in Europe which severely damaged the economy. At the same time, its side effects spurred immense growth within the region. Labor scarcity and high wages might have not been the sole ingredients in such a change, but they certainly had encouraged innovation in different practices and altered the societal structure which set Europe on the path of progress.

Sources:

http://msh.councilforeconed.org/documents/978-1-56183-758-8-activity-lesson-15.pdf

https://eh.net/encyclopedia/the-economic-impact-of-the-black-death/

https://theconcourse.deadspin.com/after-the-black-death-europes-economy-surged-1821060986

https://www.economist.com/free-exchange/2013/10/21/plagued-by-dear-labour

https://www.brown.edu/Departments/Italian_Studies/dweb/plague/effects/social.php

“Building” up the GDP

Real estate has been a driving force shaping economics in America for years. Many factors in the real estate market can predict or explain the ups and downs of the economy. More specifically building permits and housing starts “can be early indicators of activity in the housing market”. http://www.incontext.indiana.edu/2001/april01/details.asp

Building permits are a great way to indicate the fluctuations of the economy. This is due to the fact that building permits lead to new housing construction which in turn leads to new job availability and an increase in housing material production. “If more building permits are issued, this indicates more investment will likely be allocated to the housing market.”  Additionally, an increase in commercial building permits could indicate businesses are expanding and an increase in building permits for warehouses could “be a sign that commerce will increase in the coming years.” All of these factors that deal with the amount of building permits issued could bring stability and wealth to the economy and GDP when they are increasing and thus are a great economic indicator. https://www.investopedia.com/terms/b/building-permits.asp

https://articles2.marketrealist.com/2015/02/understanding-building-permits-impact-homebuilders/

For example, as seen in this chart above, more building permits were issued from 1990 to 2005, when the economy was at its best. After 2005 we see a huge decline in the number of building permits which reflects how the economic conditions during that were not favorable.

Recently, new home construction fell in May 2019, however we can see from this data that building permits remain steady. JPMorgan Chase & Co.’s, Jesse Edgerton, quotes that this building permit data “suggests little cause for immediate concern.” However from this data we also see that building permits are not always inline with housing starts. This is due to the fact that housing starts can be influenced by many outside factors. Currently, rising construction costs are making it ” challenging to build homes at affordable price points relative to buyer incomes.”

https://www.cnbc.com/2019/07/17/us-housing-starts-june-2019.html

21st Century: Internet Speed as an Economic Indicator

The Internet’s impact on global growth is rising rapidly. The Internet accounted for 21 percent of GDP growth over the last five years among the developed countries MGI studied, a sharp acceleration from the 10 percent contribution over 15 years.
(McKinsey Analysis)

The next time you are in a public place take a look around you. Nine out of ten people you see have just recently been on the internet. And among young adults ninety-nine out of every one hundred have recently been online. The internet has changed our lives in the way that we are able to do work, exchange and discover new ideas, socialize, and communicate with one another. However, it is not often that we think about the significance of this transformation in economics and how it can be used to measure economic growth. 

Individuals from large enterprises, individual consumers, and small up and coming entrepreneurs all benefit from the enormous opportunities the internet has created such as building a competitive environment, boosting infrastructure and access, providing purchasing power, as well as nurturing human capital. In harmony these components have maximized economic growth and prosperity. 

If internet were a sector, it would have a greater weight in GDP than agriculture or energy. (McKinsey Analysis)

If measured as a sector of the GDP, internet related consumption and expenditures, would be larger than the agriculture and energy sectors. In the McKinsey Global Institute study on broadband internet and economic growth and prosperity, internet accounted for 3.4% of the GDP in the 13 nations researched.  

Internet speed can be used as an economic indicator because it correlates with a given countries internet contribution of GDP. Countries with a strong internet supply in terms of speed and broadband connectivity strength correlate with a higher internet contribution to GDP. For example, Sweden and The United States have the best “internet ecosystems” in the world and this correlates with their internet contribution to GDP. Which is respectively 3.9% in Sweden and 4.7 % in the United States. The average internet connection speed in Sweden is 22.5 Mb/s and 18.7 Mb/s in the United States. When compared to Germany which has a lower average connection of 15.3 Mb/s, internet related expenditures only account for 1.9% of the Germany’s GDP.  

Internet Contribution to GDP (McKinsey Analysis)

However, it is important to highlight that in most studies on developed nations it is noted that this positive correlation of broadband strength and economic growth reaches a threshold and other economic indicators should be used in conjunction when accessing economic growth. 

Sources:

https://www.statista.com/topics/2237/internet-usage-in-the-united-states/

https://www.businessinsider.com/mckinsey-report-internet-economy-2011-5

https://en.wikipedia.org/wiki/List_of_countries_by_Internet_connection_speeds

https://www.mckinsey.com/~/media/McKinsey/Business%20Functions/McKinsey%20Digital/Our%20Insights/Essays%20in%20digital%20transformation/MGI_Internet_matters_essays_in_digital_transformation.ashx

Increased Auto Repair Service Sales Could Indicate Recession

It is often said that the decisions of one impact the lives of many. Decisions on what to spend money on and when to spend accumulate into a collective force that dictates the growth or decay of the economy. This means that, behaviorally, the confidence the individual has in the continuation of their income will dictate whether or not they decide to spend money at that point in time in the first place. 

Large investments such as cars and property have been used as a means of measuring the confidence of that consumers have on their economic future. Because of the size of the cost, money is often borrowed for such purchases and these goods are often used as equity for other loans. When the economy is doing well, people are more inclined to purchase homes and cars (both old and new) with the assurance that they will be able to pay off the debt of their mortgage or car loan. On the flip side, during a recession, sales tend to slow as consumers become more reluctant to make such risky purchases due to the chances of defaulting and high interest rates. Overall, consumers tend to withhold their spending in most markets when their confidence in the growth of the economy, and their spending money, is low. 

Motor vehicle sales are often used as an indicator of economic health. During the Great Recession, auto sales dropped significantly. Source: Yardeni Research Inc.

While it is often thought that all business tends to slow during a recession, there is one particular enterprise that actually benefits from an economic downturn: auto repair shops. 

The heavy investment in vehicles makes commodities like cars precious. They endure regular wear and tear or collision damage, which inevitably leads to the end of the car’s use. Historically, car owners were more willing to trade their car in for a new model after every two years to avoid dealing with repair bills while enjoying the upgrades in fuel efficiency and better manufacturing. 

During the Great Recession in 2007-2008, people divorced themselves from that habit to save money. As cars aged and began to break down, car owners had to invest in auto servicing, increasing auto repair sales by 10.5% from 2007 to 2011.

Between the Great Recession and the eventual recovery of the economy in 2015, car owners refrained from buying new cars, resulting in an increase in the average age of cars that were not purchased in a “used” condition.

As with all indicators, there are a few factors to consider when analyzing the economy through auto repair sales. For one, it is important to note the rising cost of both cars and car parts due to new automotive technology such as self-driving and improved collision safety engineering, which can factor into the overall increase in consumer expenditure in that market. US-based insurers Travelers reports that the cost of repairing a 2018 sedan is up to three times higher than a 2017 model. These increased costs are projected to be an investment in driving safety, which could ultimately be offset by reduced frequency and intensity of vehicle accidents in the future, which means less-frequent spending on auto repairs. 

On the 125th Labor Day, unemployment rate helps indicate a robust American economy

Summer of 1894 marked the first official celebration of Labor Day in the United States; President Grover Cleveland signed a bill creating a national holiday across the country when reconciliation with the labor movement became a top political priority.  

Illustration of the first Labor Day in New York City.

Since the original Labor Day, the U.S. labor market has been affected by economic upturns and downturns, governmental policies, changes in cultural values, and countless other factors. One significant statistic from the labor market, the unemployment rate, gives the percentage of unemployed workers in the total labor force. The rate reveals how many people are out of work or seeking a job, which affects the American economy as a whole. When one becomes unemployed, an individual or family loses its wages. In turn, the national economy loses the consumption of goods and services that the individual or family would be spending with earned wages. The purchasing power of the unemployed consumer declines and eventually puts other workers out of a job. The fact that unemployment affects purchasing power makes it an economic indicator: a means to gauge future trends in the economy. A low unemployment rate indicates a strong economy usually tied with high consumer spending; a high unemployment rate usually occurs during a time of economic downtown and causes low consumer spending.

During the year of the first Labor Day, the unemployment rate was 7.73%. The Panic of 1893 has just occurred due to international crop failures and other shocks that weakened the economy. Four million people were unemployed during what became a major depression in the business cycle. The unemployment rate confirmed the pattern of economic downtown in several sectors of the economy at the time.

Last month, July numbers showed a present-day unemployment rate of 3.7%, one-tenth of a point up from the record low rate of 3.6% reported in April. The rate has not hit that low of a percentage since December of 1969, indicating a robust labor market in the current U.S. economy. Consumer spending is high, building good business, and in turn, generating more jobs.

The unemployment rate, a trailing indicator, confirms the growth that the American economy is experiencing in the present day. Workers earning wages stimulate economic growth with spending.

The unemployment rate rose one-tenth of a percent between the first and second quarter of 2019. However, the small fraction of growth is not alarming on a month to month basis. If the unemployment rate were to rise 0.5% over a short period of time, there may be reason to worry about economic downturn.

125 years after the first official Labor Day and Panic of 1893, the U.S. sees a robust economy confirmed by a low unemployment rate. Although other indicators such as an inverted yield curve and slowing global growth may suggest an imminent recession, the unemployment rate confirms economic growth and stability in the present day.

Sources:

https://www.investopedia.com/news/history-labor-day/
https://ig.ft.com/sites/numbers/economies/us/
https://www.forbes.com/sites/simonmoore/2019/08/20/what-key-recession-indicators-are-telling-us-today/#6ee71bd12156

What does the bombing growth of eSports tell us

ESports, standing for “electronic sports,” are a form of online competition using video games. The first eSports competition was held at Stanford University in 1972, when players were invited to compete in a game called Spacewar. Since then, eSports industry has developed together with the surge of internet access and video game technologies. However, it has not become full-fledged until recent years. 

Visitors cheer for international teams during the tournament of the computer game ‘League of Legends’ on May 8, 2014 in Paris.
Lionel Bonaventure | AFP | Getty Images

The explosive growth of eSports shows that people (especially youth) are adjusting their ways of daily interaction and socialization in the fast-paced world of constant techonological breakthroughs. eSports is going to be the first global sport, predicted by many experts. 

In 2018, eSports market revenue worldwide was 865 million dollars. Experiencing “phenomenal” year-over-year growth, the revenue is expected to double in 2022, reaching 1.79 billion dollars.

eSports market revenue worldwide from 2012 to 2022 (in million U.S. dollars)

2019 is a landmark for eSports as the market surpasses 1 billion for the first timeAccording to Newzoo, eSports revenues will reach an impressive $1.1 billion in 2019, a year-on-year growth of +26.7%. 

Sponsorship is currently the main source of eSports revenue, generating $456.7 million in 2019. But media rights remain the fastest-growing segment, increasing by 81.5% in 2017.

eSports market revenue worldwide in 2019, by segment (in million U.S. dollars)

“When I look at 2018, I feel like it was the year that eSports really started cracking into the mainstream,” Jack Etienne, owner of North American eSports team Cloud9, told CNBC.

While the booming growth of eSports indicts infinite business opportunities across industries, retailers – who are experts on capitalizing opportunities – are eyeing on the gold mine eSports bring in. 

Of course, game retailers can look towards pushing higher-quality hardware as models with more features are being brought to market. But they are also making profit by manufacturing and adding production – such as physical stores.

https://digiday.com/marketing/game-digital-looking-esports-turn-around-retail-sales/

Game Digital, a British video game company nearly bankrupted in 2012, launched physical stores called “Belong”, where gamers can pay to play together, participate in fan events and test new technologies like VR. 

With the rising of eSports, Game Digital seeks for its future not by just selling games but also by creating a mutual space for gaming, which shares the same idea of eSport competitions. In 2017, for the 12 weeks that ended on mid-March, physical game sales grew 0.5 percent in the U.K., according to Kantar Worldpanel.

Meanwhile, some retailers are dealing with a unique group of audiences – teenagers, also called Gen Zers.

Tilly’s, a Southern California-based accessories retailer focused on teenage customers, started a partnership with the High School Esports League (HSEL) and invited students across the country to win prizes by competing in augmented reality (AR) mobile game. The contest adds to the gross of revenue of Tilly’s physical stores. 

Another trending and lucrative direction for eSports giants is holding world championship events. The 2018 “League of Legends” World Finals had early 100 million viewers – more than the Super Bowl viewers. World Championship like this creates a perfect ecosystem for brands to get involved. As mentioned, over a third of $1 billion industry revenue stream comes from sponsorships, which have been a big driver for “League of Legends” franchise. The publisher announced Mastercard as a global sponsor last year, and the Chinese branch of “League of Legends” signed a partnership deal with Nike months ago.

A child plays Chinese version of ‘League of Legends’, which has 295 million downloads and earned 4.5 billion to date. (Photo by VCG/VCG via Getty Images)

On the consumer’s side, annual spending on eSports-related accessories increased 33 percent from 2017 to 2018, to a record $4.5 billion. The 2018 Entertainment Software Association report found that 64 percent of households own a video game device and 60 percent play video games every day.

Statista shows that the estimated average per capita spending on eSports will increase by two-fifths from 2017 to 2020.

Estimated average per capita spending on eSports related content worldwide in 2017 and 2020 (in U.S. dollars)

Both the industrial production(manufacturing) and consumer spending are swelling, indicating a big upsurge in eSports’ demand and supply. In fact, there is hardly any economic indicator shows the declining trend of Esports. With more and more eyes locked on this industry and more event held (i.e. The eSports Business summit to this month), this is definitely a golden era for eSports – with challenges ahead.

Sources:

  1. Desjardins, Jeff. “The Business of ESports.” Visual Capitalist, 29 May 2018, https://www.visualcapitalist.com/business-of-esports/.
  2. Goslin, Austen. “The 2018 League of Legends World Finals Had Nearly 100 Million Viewers.” The Rift Herald, The Rift Herald, 11 Dec. 2018, https://www.riftherald.com/2018/12/11/18136237/riot-2018-league-of-legends-world-finals-viewers-prize-pool.
  3. Gough, Christina. “Global ESports Market Revenue 2022.” Statista, https://www.statista.com/statistics/490522/global-esports-market-revenue/.
  4. Gough, Christina. “Global Consumer Spend on ESports 2020.” Statista, https://www.statista.com/statistics/691794/consumer-esports-spend/.
  5. Joseph, Seb. “Game Digital Is Looking to Esports to Turn around Retail Sales.” Digiday, 29 Aug. 2017, https://digiday.com/marketing/game-digital-looking-esports-turn-around-retail-sales/.
  6. Pannekeet, Jurre. “Global Esports Economy Will Top $1 Billion for the First Time in 2019.” Newzoo, https://newzoo.com/insights/articles/newzoo-global-esports-economy-will-top-1-billion-for-the-first-time-in-2019/.
  7. Pei, Annie. “Here’s Why Esports Can Become a Billion-Dollar Industry in 2019.” CNBC, CNBC, 23 Jan. 2019, https://www.cnbc.com/2019/01/20/heres-why-esports-can-become-a-billion-dollar-industry-in-2019.html.

Brexit: Why we’re still stressing out about it

(Courtesy: Pixabay)

Some background

Brexit is coming – and if Game of Thrones was still “in” right now, I would make a cheesy, poorly thought out “Winter is coming” joke. However, perhaps there is more in common with Brexit and the hit fantasy series, whose anticipated final season drummed up more controversy than acclaim, than meets the eye. 

Like Game of Thrones’s final season, Brexit – referring to the United Kingdom’s decision to leave the European Union, a political and economic coalition – has been a long-time coming, stressful, messy, controversial and disillusioning. Ever since the 2016 referendum where Brexiters narrowly between the “Bremain” crowd 52% to 46%, the United Kingdom has not actually managed to leave the United Kingdom, delaying their departure date twice due to an inability to strike and approve a satisfactory deal with the European Union. 

The United Kingdom is currently salted to leave the EU on Oct. 31, 2019. There is still no departure deal. Britain’s current prime minister, Boris Johnson – a controversial figure who has drawn comparisons to Trump for his hair and speech patterns – has stated that, if it comes down to it, the UK will leave the EU on Halloween without a deal

With the battle for Brexit getting more heated and members of Johnson’s own party rebelling against him and working with the opposition to draft a bill that would prevent a no-deal departure, Johnson has threatened to call for an election, potentially reshuffling the lines of power. 

What a no-deal Brexit could mean for the UK’s economy

A no-deal Brexit could impact not only the United Kingdom’s economy, but the economy of significant trading partners, such as the United States. In 2018, the Federal Reserve worried that a no-deal Brexit would make London subsidiaries of US banks make the costly relocation to another EU country in order to keep EU clientele and that it could become less profitable for US banks to loan to UK citizens.

Leaving without a deal would mean that the UK would leave a customs union and single market overnight. As a member of the EU, the UK’s goods were not taxed by other member countries. After going cold turkey on the organization, Britain will lose that privilege and the EU would start taxing their goods

According to the BBC, “This could lead to delays at ports, such as Dover, Some fear that this could lead to traffic bottlenecks, disrupting supply routes and damaging the economy.” With almost one-third of food in the UK coming from the EU, food shortages are another concern.

Source: https://www.bbc.com/news/uk-politics-32810887

In the weeks following the initial referendum, the value of the pound fell a little over 10% against the euro from €1.3017 to €1.1663, according to the Brexit currency fallout engagement rate tracker. The original vote also caused the Dow to drop 610.32 points. While Capital Economics’ Senior U.S. Economist Andrew Hunter points out for CNBC that the market volatility “unwound” itself in the weeks following the vote, and suspects the same could happen following Brexit.

What does the economic future of a country leaving the EU look like?

No one knows for certain. The United Kingdom would be the first nation to leave the European Union. There is no precedent. In many ways, it is a shot in the dark. A shot in the dark that has been making headlines for a little over three years and no satisfactory resolution in sight, creating a sense of anxiety for consumers. In August 2019, British consumer confidence fell to a seven-month low, with many attributing that to Brexit worries.

Source: tradingeconomics.com

According to The Guardian’s Sean Farrell, Britain’s economy has been treading water because of consumer spending amidst manufacturing and constructing shrinking and the unwillingness of companies to invest. However, the UK’s decreasing consumer confidence could encourage people to save rather than spend, putting a dent in that part of the economy.

What exactly is Brexit an economic indicator for? It’s unclear. It could be nothing. Or, it could help push the nation into a recession. Only time will tell, but as the prospect of a no-deal Brexit becomes closer to a reality, the UK and the EU’s economic futures may be the scariest thing on Halloween.

Sources:

Premium Gas Says a Lot About Our Economy

In his book “Misbehaving,” behavioral economist Richard Thaler analyzed a 2011 study by Justine Hastings and Jesse Shapiro which explored the relationship on spending and gas prices. The study found that during the 2008 financial crisis, when gas prices fell 50 percent from $4 a gallon to $2 a gallon, the money that was saved on buying regular gasoline ended up being spent on premium gasoline instead. Instead of pocketing the money in case of an emergency or allocating the extra cash elsewhere, car drivers viewed their decision to upgrade gas as a splurge. 

If households view premium gasoline as a splurge, then gas may be seen as an economic indicator. By definition, an economic indicator is used to predict investment possibilities and assess the economy’s overall health. In the same way that women view cosmetics like lipstick as an affordable splurge during hard times, an increase in buying premium gasoline can be an indicator of an economic fall. 

Gas is a frequent and telling purchase. 85 percent of Americans either drive alone or carpool to work each day, according to American Community Service data, and there are over 115 million cars on the roads each day. 

Although it may seem counterintuitive to be spending more on a higher grade of gasduring a recession, Thaler attributes this seemingly irrational behavior to a concept he termed “mental accounting,” meaning that consumers all have mental spending “buckets” that are largely separate and unchangeable. For example, the study found that a save in filling up a driver’s gas tank did not readily translate to a consumer using the extra money to upgrade their orange juice or milk choices.

Mental accounting visualized / Twisha Shah-Brandenburg

Another study conducted by the American Automobile Association found that 16.5 million motorists in the United States purchase premium gas. However, 70 percent of cars driven in the U.S. require only regular gas. The study estimates that purchasing premium gas wasted $2.1 billion in 2016 because motorists perceive premium gas as better for their engines when in reality, it is an unnecessary purchase. Despite the state of the global financial crisis in 2008, spending on premium grade gasoline rose by 14 times the usual amount even more so than normal, according to the Hasting and Shapiro study.

In April of this year, the L.A. Times reported that gas prices rose to over $4 a gallon for the first time in four years. While the price of gas itself may be seen as an economic indicator, the amount of spending on premium grade gasoline can also chart economic changes. When gas prices go down during periods of economic recession, the purchase of premium grade fuel may go up due to its now-affordability as a splurge item, signaling an economic downturn. As gas prices rise, more consumers have forgone splurging on premium and have settled for regular due its lower cost because in their minds, they don’t have any discretionary funds from their gas money “bucket” to pay for better quality fuel. 

Why Argentina’s inflation rate could continue to grow!

Argentina’s inflation rate has risen to as high as 57 percent this year and has stayed at around 55 percent since its peak in May of 2019.

President of Argentina, Mauricio Macri, (Right) in a meeting with President Trump(Left)


In recent memory, Argentina has been known for two things: Really good homegrown beef and an extremely high inflation rate. Thank god for the high-quality beef, a key trade asset that has kept some value in the economy. However, even the best beef in the world can’t save the economy from an inevitable crash or crisis. Argentina’s inflation rate at the end of 2017 was only 24 percent, still unbearable, but nowhere near as bad as 57 percent. So the question is, what is the reason behind their 30 percentage point spike in inflation and how do we fix it?


The spike in Argentina’s Inflation rate over the past year (The Trading Economist)

Background information on how we got to this point

The Central bank has tried to control the Argentinian inflation rates in the past, but has proven unsuccessful. The Argentinian peso lost almost 51 percent of its value in 2018, and this year has lost 15 more percent of its value compared to the U.S. Dollar. The disesteemed peso has caused an extreme recession in Argentina, where poverty rates have gone up tremendously. The economy contracted 5.8 percent in the first quarter of 2019. This has left foreigners skeptical to invest in the Argentinian peso, but many continued their investments due to confidence in a turnaround. The spike in inflation in 2019 has not only driven most investors to stay away from the Peso, but has also forced banks to ease limits on foreign exchange interventions. The President of Argentina, Mauricio Macri, has been under a lot of pressure to fix the inflation rate or at least make the economy emerge in the right direction. But with election day coming in October, Macri’s chances of being re-elected are diminishing. Macri was elected as a moderate that would be fiscally conservative, a polar opposite to the “free-spending” 2015 president Cristina Fernandez, who originally started the extreme spike in inflation.

The Inflation Spike!

When Macri was elected into office in 2015, he started off with major budget cuts to offset the “free-spending” of Fernandez. Macri was furious with the free public subsidies given to families to get back on their feet from the 1998-2002 Argentine Great Depression that left millions impoverished. He believed that these subsidies caused an extreme spike in inflation and when Macri became elected, he got rid of the subsidies right away. People had relied on many of these subsidies to help provide for their family, and when these were taken away, they were not prepared to pay for things that had previously been taken care of by those subsidies. Once the budget cut kicked in, “Every time a water, electricity, or home heating gas subsidy was reduced, people’s monthly utility bills went up”(PRI.org), which caused consumer spending to go down dramatically. Business’s also had to pay off the utility bills which raised prices on goods and services. The people could not afford the goods and services anymore. The central bank then raised interest rates tremendously, thinking it was a good decision since the safe United States economy among other safe economies were doing it as well. Instead, private investment went down even more, and the recession got worse as inflation skyrocketed.


Lowering the inflation rate and Argentina’s big decision in October!


Former president of Argentina Cristina Fernandez

People put Macri at fault for the whole situation and blame his moderately conservative policies as the leading indicator for the spike in inflation. However, those policies did not spike inflation on their own as Private investors staying away from the devalued peso helped skyrocket inflation as not enough money was coming into the economy. Many are so angry with Macri that they want to venture back to “free-spending” and vote for the ultra-liberal and former president Cristina Fernandez. Citizens believe that Fernandez will at least lower the inflation rates back to 25 percent from 56 percent, since it hovered around there for part of her presidency. However, many of these citizens are uninformed and there are many lurking variables behind the spike in inflation and what caused it. Yes, Macri made the spike in inflation worse with his policies driving investors away, but this crisis could have been avoided if Macri implemented his policies at a slower rate, rather than drastically changing the economy right away which he did. Fernandez will make drastic changes as her free-spending agenda will raise inflation even more, ultimately making Argentina unlivable. Argentina needs a moderate with a fiscal agenda to take over. Macri was not the right fit, but someone who can read economies better than him, use similar fiscal policies, and implement those policies at a slower rate will make the economy better. If the people of Argentina decide to go ultra-liberal with their inflation rates at 56 percent, then an even bigger crisis is inevitable.

Sources:

Main source: https://www.pri.org/stories/2019-05-06/how-argentina-crept-threshold-crisis-again

Source 2: https://tradingeconomics.com/argentina/inflation-cpi

Source 3: https://www.forbes.com/sites/stevehanke/2019/03/16/argentinas-peso-nothing-but-trouble/#1f5a1d262a9a