Every four years, the world comes together for the most prestigious athletic competition there is: the Olympic Games. This culmination of athletic excellence is one of the most watched events in all of television. In fact, NBC Sports Group called the 2016 Rio Olympics “The Most Successful Media Event in History” after the event drew over 3.6 BILLION viewers and NBCSN streamed an “unprecedented 6,755 hours of programming for the games.” But the Olympics impact more than just television. Host cities become landscapes of arenas and stadiums. Living rooms across the world are filled with both enthusiastic cheering and defeated sighs. Groceries stores on every corner see massive increases in sales of staple snack foods, like potato chips and soda. Clearly, the Olympics are an event with far reaching influence, but what does that mean when it comes to the economy? And more specifically, how well do the Olympics serve as an economic indicator for the country that hosts them?
Given the magnitude of the Olympics, it would make sense for one to assert that the economies of the hosting countries must be in an excellent place. This is supported by the fact that even joining the race to potentially host is quite an investment. Tokyo, for example, spent $150 million dollars on its bid for the 2016 Summer Olympics. And the most painful part? Rio de Janeiro, Brazil was selected as the host city that year.
The pay in is hefty, but once a city actually is selected to host, the costs only continue to increase. Most often, cities must undergo a massive change in infrastructure. The construction and updates of venues, hotels, roads, airports, and other necessary facilities can cost cities billions of dollars. Taking on such an investment requires immense faith in one’s economy and a commitment to government spending. In 2008, Beijing spent around $42 billion dollars hosting the Olympics. In 2004, Athens spent $15 billion. In 2016, Rio spent over $20 billion to host. This is no cheap endeavor and often even the projected budgets are nowhere close to the actual cost of the event.

But as we know, government spending is a huge part of the global economy. So if a city is dramatically increasing spending, they are putting money into the economy, creating economic stimulation and increasing the country’s GDP. In addition, the aforementioned infrastructure construction would create millions of jobs and potentially attract workers from other countries. Those workers will then also be contributing to the economy when they spend their earned wages.
But all of those changes happen before the games even begin. As it gets closer to the actual games, tourists from all over flock to the host city, increasing the amount of money spent on things like tourist attractions, retail goods, hotel rooms, restaurants, and historical landmarks. People also spend a large amount of money at the Olympic venues themselves, which further stimulates the country’s economy. Increased sales means increased consumer spending which also increases the country’s GDP.
All of these shifts seem positive; decreased unemployment, a potential increase in population, an increase in retail sales, and an increase in consumer spending — all of these changes are typically indicators of economic growth. These numbers, however, are always not indicative of reality.
In reality, the spending is simply too large to bounce back from and host countries’ economies often suffer from the massive spending. In 2008, Beijing made $3.6 billion off the Olympics. This may seem like a good number, but recall that they spent $40 billion in the first place. Athens’ damages were even worse. The city struggled to finish it’s construction in time and even after it did, the cost of the 2004 Olympics pushed Greece’s economy into a massive sinkhole. In 2004, debt was the highest in the European Union coming in at 110.6% of the GDP. In 2005, they became the first country in the EU to be placed on fiscal monitoring. In the years following, the country amounted $342 billion dollars in debt and faced massive economic recession that lasted until only a few years ago. And while the Olympics are certainly not the only factor in Greece’s economic downturn, it “certainly didn’t help.”
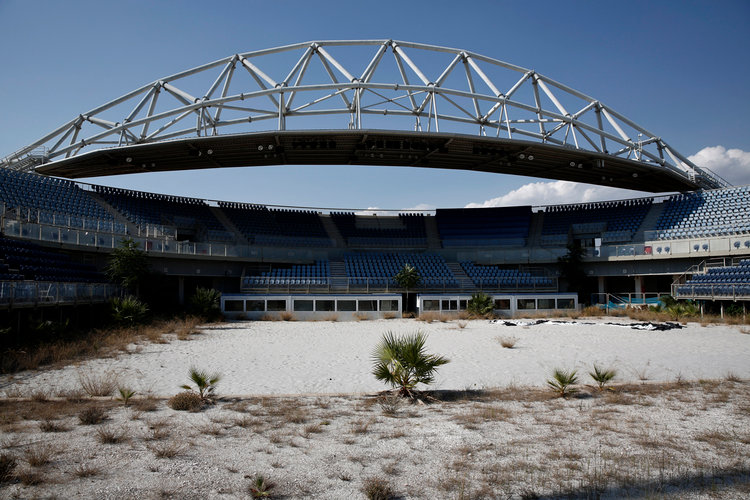
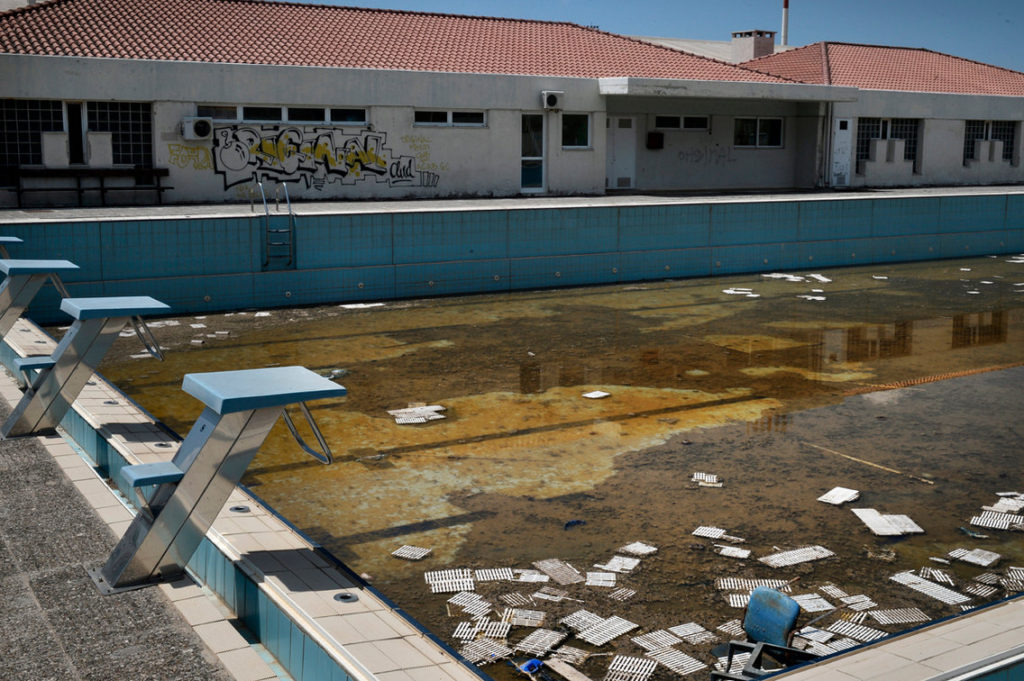
All across the world, massive Olympic stadiums lay in ruin, abandoned due to the price of upkeep. These battered venues perfectly illustrate the long term economic impact of hosting the Olympics, reminding us that massive government spending has consequences and economic indicators are meaningless without context. As this analysis reminds us, one should exercise caution before they truly let the games begin.