Geographic Location and Entrepreneurial Opportunity

Silicon Valley acts as the entrepreneurial hub and home to major tech companies and start-ups on the west coast. TV series and movies depict this culture of wealth and fame. But this San Fransisco tech hub is not the only city in the United States that fosters this type of creative and financially flourishing environment. Over the past 10 years, start-up culture has spread throughout the United States and is flourishing in cities like Boulder, Colorado and Austin, Texas. Boulder has a population of approximately 100,000 people and in a study done in 2010 by the Kauffman Foundation, Boulder has six times more high-tech start-up’s per capita than the nation’s average and twice as many per capita than San Jose-Sunnyvale in California.

Normalizing this start-up culture has helped Boulders economy flourish, but not all metropolitan cities have the financial backing and culture that could support this shift. Though the majority of millennials in metropolitan areas understand the benefits of integrating small businesses and technology into their city, older generations and individuals with a traditional mindset have difficulty coming to terms with this non-traditional shift in career trajectory. But what makes a city a successful hub for start-up and venture capital culture, is the willingness to explore opportunity and advancement for your environment. Start-up culture is fostered by problem-solving, so is it possible that down the line more cities will become tech hubs and how will this affect entry-level jobs and cities economic development? The cities economic and social structure needs to be supported by the infringement that incorporating entrepreneurial opportunities will bring. Automation, data analysis and other forms of technology will continue to grow and change the systems placed by standard job structures, and the infrastructure of the city around it must be prepared for the change it will bring as well. 

Innovation impacts socio-economic objectives.

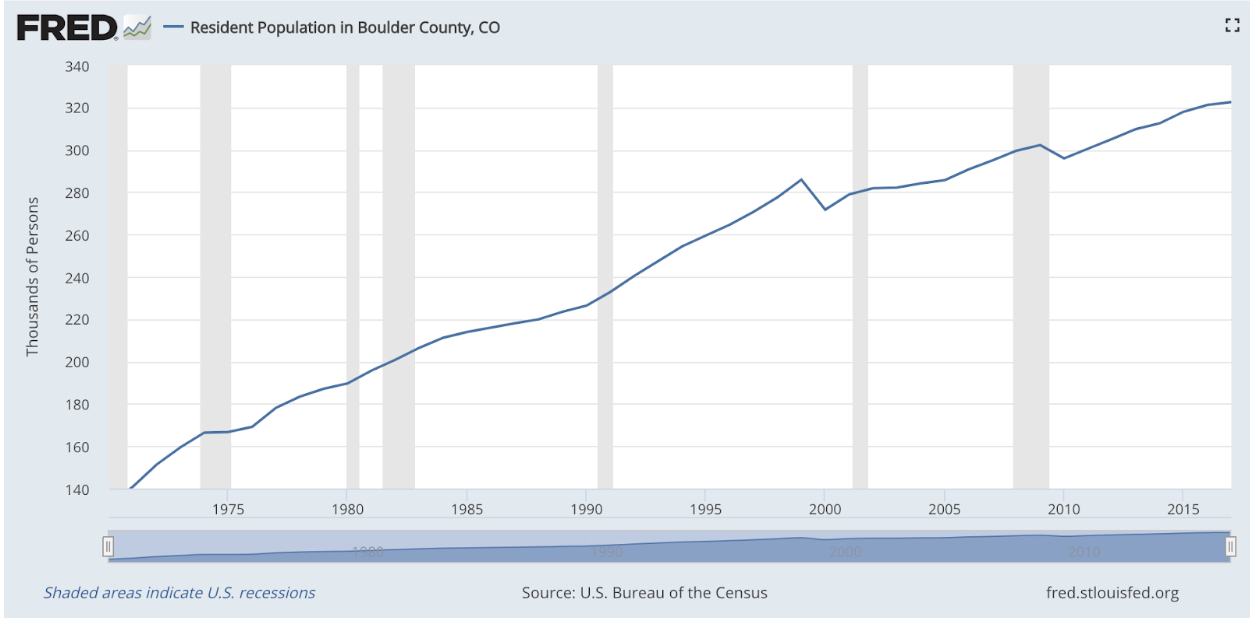
Incorporating new practices and innovative efficiencies into a new market will have a positive effect on the socio-economic objectives of a city because incentivising an entrepreneurial culture will ultimately resolve unmet needs. Unmet needs meaning desired services, tangible inventions and reforms to existing systems. Opening small businesses and branches of larger corporations and remote offices also mean that there will be more employment opportunities in a city. Whether the level of entry is higher than a cashier or waiter type position, the market will continue to grow and change with an influx of jobs being introduced either way. This incentivizes people to relocate to these cities, like Boulder or Austin, where the market is rapidly increasing with more complex executive positions, that require a form of expertise. For the past 30 years, the resident population in Boulder County has been steadily increasing, which proves that the growing economy is attracting more people every year.

Unmet needs meaning desired services, tangible inventions and reforms to existing systems. Openings of new businesses and corporations also mean that there are more employment opportunities. Whether the level of entry is high, the industries market will continue to grow and change with an influx of jobs being introduced either way. This is a very positive trend in these metropolitan areas because the demand for jobs, while the price o rent, insurance, tuition, etc. all seem to be increasing as well, therefore unemployment rates have been at a steady decrease since the financial crisis in Colorado.

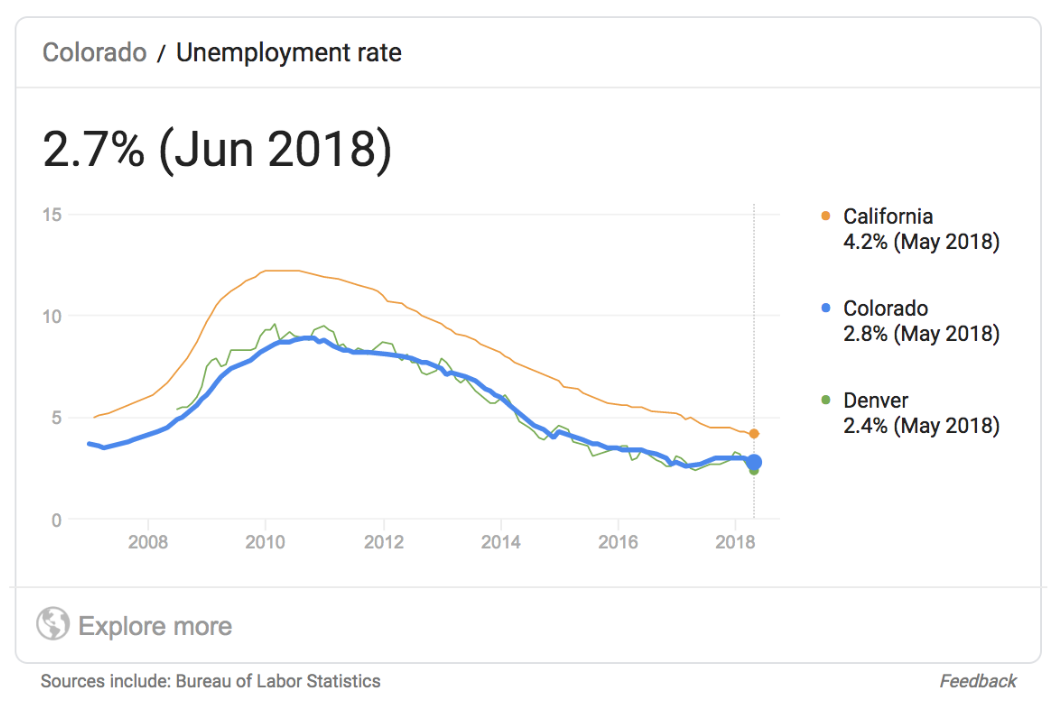
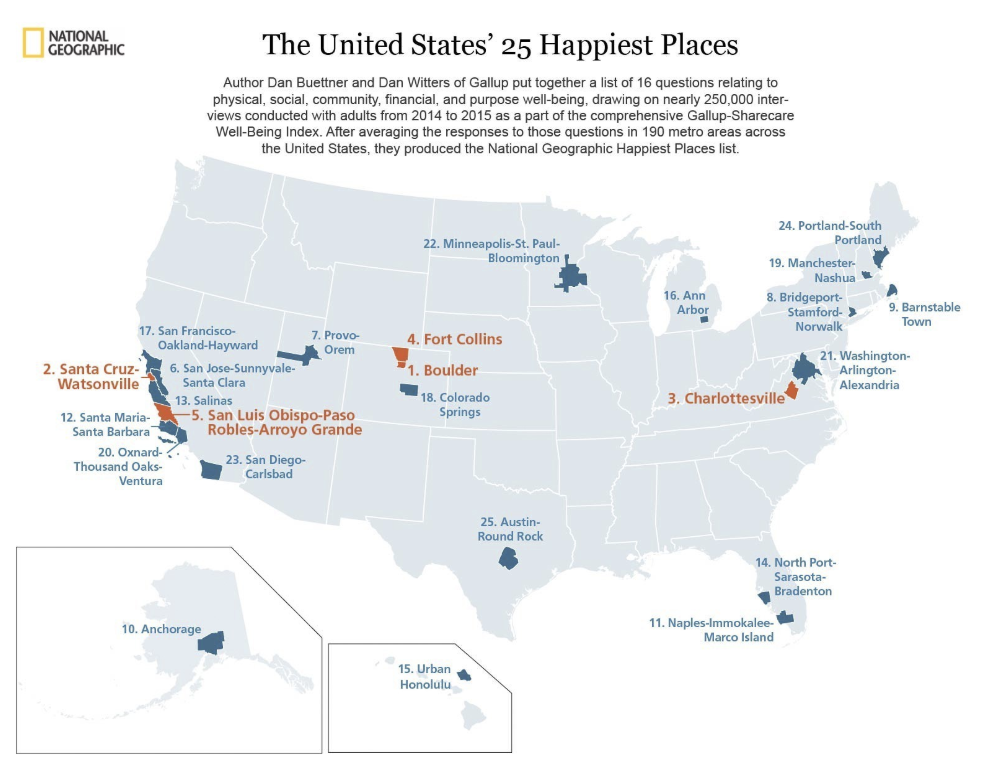
Brad Feld, the author of “Startup Communities: Building an Entrepreneurial Ecosystem in Your City and Co-founder,” the co-founder of TechStars and managing director of Foundry Group, a VC fund focused on early-stage investments, developed the concept called the “Boulder Theory.” This theory is based on breaking down the four major components essential to how start-up communications start and evolve. Noah Horton, CEO, and Co-Founder of Unsupervised, an AI data analysis tool that is used to automatically detect trends and draw insights from a companies data in a much shorter time span, spoke with me about his take on the “Boulder Theory.” Horton chose to relocate to Boulder, CO from the infamous Silicon Valley for a better quality of life. In a phone interview with Horton, he said that, “It just makes more sense to save money and live some place where I will be surrounded by nature and still be able to find incredible talent to come work with us.” Horton has been in Boulder for the past three years and has seen a continual increase in people moving to the city, and finding talent that is leaving the bay area to come to what National Geographic has deemed The Happiest City in the United States.


Commerce and regional economic integration.

What is important to note is that emerging tech and transportation make it possible for small businesses to export and do business on a national and global scale. Therefore working in cities that are not coastal or main financial hubs, make it possible to still be successful. The selling of local goods contributes directly to that particular region’s earnings and productivity which strengthens the economy and supports the ecosystem and local economy. Having increased investment and entrepreneurial activity is extremely beneficial for an interconnected global economy. The trend of starting new businesses and endeavors in a city gives hope, inspiration and motivation to people living in the city to conceptualize the new sense of opportunity in their area. Entrepreneurs finding solutions to market needs and providing new goods and services proves that cities throughout the United States are capable of pursuing similar endeavors that will enrich their local and the nation’s economy. Articles and lists have been published regularly as well highlighting Colorado’s success in businesses thus far. Built in Colorado focused on promoting the “Top 50 start-ups in Colorado” with the first five companies including autonomous vehicle engineers, educational technology, security data analysis, and a virtual reality house realtor, so you can walk through a house without making an appointment to physically go there. These are just some examples in which the city is advancing and growing their infrastructure. 

The proof of growth

What makes projects and change like this so exciting in a city, is that this does not mean that Silicon Valley and New York City are ever going to go away. What this now means is that you do not have to pay to live in one of those cities to have a successful and well-paying job at one of the same companies, there are growing businesses and tech start-ups that are fostering the same environment as they would in any other city. According to BuiltInColorado tech companies in Colorado raised $780 million in funding in 2017 and $35 billion in exits alone in that year. The volume of capital raised is significantly small in comparison to New York raising $4.227 billion in funding during the third quarter of 2017 and the Bay Area raising $4.117 billion as well during that quarter in local start-ups. But, having $35 billion in exits alone means that outside investors are willing to invest and foster the growth of companies out of Colorado because a are aquiring majority of them. In 2017 alone, tech companies, according to CompTIA, made up “9.7% of the workforce in Colorado and contributed $43.4 billion to Colorado’s economy, representing a 14% share in the state’s total economic landscape.” These statistics provide the city with quantitative reason to believe that this direction of Colorado’s investments in start-up culture is benefitting the economy in a positive manner. Honing the ability to create a template or potentially franchisable ideologies and systems to support similar growth in cities across the United States could have a very positive effect on the nation’s economy overall.

Sources:

https://www.cyberstates.org/pdf/CompTIA_Cyberstates_2018.pdf

https://www.nationalgeographic.com/travel/destinations/north-america/united-states/colorado/happiest-city-united-states-boulder-colorado-2017/

https://unsupervised.com/team/

https://www.businessinsider.com/new-york-beat-out-san-francisco-as-a-venture-capital-powerhouse-2017-10

https://www.inc.com/magazine/201312/boulder-colorado-fast-growing-business.html

https://powderkeg.com/the-denver-boulder-startup-scene-a-guide-to-the-front-ranges-givefirst-tech-cultur

https://www.builtincolorado.com/

https://www.builtincolorado.com/2017/10/24/top-100-digital-companies-colorado-2017

Affordable Housing is Not So Affordable Anymore

As a student graduating with some debt, I empathize with the approximately 44 million borrowers who begin their adult lives feeling financially behind. This is an issue that does not only hinder Americans throughout their lives but especially in the first 10-20 years after they graduate from college. Some of the first steps to becoming financially independent come from getting your own credit card, purchasing high-value items like your first car, groceries, insurance, and then putting money down on your first house. All of these transactions require you to have a certain amount of credit in order to do so, which is difficult when you have upwards of $100,000 of debt to your name before people even apply for their first credit card in their name. Though most importantly, understanding the debt that I will have, along with a lot of my friends, makes me feel nervous about future investments such as purchasing a house. But I am not alone in that concern. The housing market is only decreasing while student debt is skyrocketing, and the long-term effects of this situation are yet to be determined as the debt continues to accumulate. 


Millennials between the age of 24-34 are around 8 percentage points lower than baby boomers and Gen Xers when they were that age in homeownership, according to a report by the Urban Institute, a policy research group. Only 37% of millennials born between 1981 and 1997 are homeowners, which does not show a lot of promise moving forward as the housing and entrepreneurial markets have presented solutions to avoid taking out loans and mortgages. A main factor is also the regressing age of marriage. Societal norms are changing and evolving, normalizing the concept of getting married later and women completely joining the workforce, which was not the case, to the same extent, 30 years ago. The more single people in their 20’s the less people will be willing to invest in property because are not assuming that that will be their permanent residence. This is all very important information because as a borderline millennial and Gen Z individual myself, I believe it is important for us to understand the greater effect these changes are having on the economy and how it will affect the market down the line.


According to the graphs created by the Federal Reserve Flow of Funds on Market Watch’s Capital Report, home prices since 2010 have only gone up at a steady rate, making it increasingly more difficult for the skyrocketing amount of student loan debt. Economists are worried about what this challenge will present for future homeowners. The New York Fed shows that the there is approximately $1.4 trillion of student debt accumulated in the United States, while the GDP is $19.4 trillion. Which means that the student loan debt makes up approximately 7% of the total GDP. With that being said, the amount of people investing in the housing market is decreasing which is a strong contributing factor of why housing prices are high. It also makes it difficult that the millennial generation is so keen on leases and rentals rather than making long term investments.


With new companies such as Airbnb entering the space, and co-ops providing short term housing, they are effectively changing the perception and future of the housing market. Conceptually, it will be very challenging to reverse a generation’s perception of long and short term goals with investing, marriage, and daily spending habits. So it will be interesting to see how the value of the housing market shifts and if reforms will be made to help appease the student debt crisis at the whole.


Sources:

https://www.marketwatch.com/story/the-surge-in-student-debt-may-be-linked-to-the-wreckage-in-the-housing-market-2018-01-26 

https://www.nar.realtor/sites/default/files/documents/2017-student-loan-debt-and-housing-09-26-2017.pdf

https://www.cnbc.com/2018/03/29/these-are-the-ways-student-loans-stop-people-from-buying-a-house.html


Behind Shared e-Scooter Craze

On a recent evening, Xiaofeng Li followed her usual routine, heading to the beach near her Playa del Rey apartment for an after-dinner walk. Lee used to make the five-minute drive to the beach in her car, but when the motorized scooter craze reached her neighborhood, she decided to give it a try. The ease and convenience of a scooter for the short trip hooked her immediately. On this evening like most others, after coming home from her job as an office engineer in a construction company, she grabbed a shared e-scooter from the stand near her front door, hopped on,  and pointed it beachward.

This time, though, things went terribly wrong. As Li coasted downhill toward a busy intersection, she tried to engage the break but got no response. Instead the scooter continued to accelerate until she lost control, forcing her to leap off before colliding with traffic. Still in motion from the speed of the scooter, she tumbled to the asphalt, suffering gashes on her knees, arms and hands. The accident gave her a shock.

“I was desperate when the brake failed,” Li said, speaking in her native Mandarin Chinese. “The only thing I could do was jump. It was the first time I realized that the scooter is not safe.”

Since September of 2017, startups including Bird, Lime and Spin have introduced thousands of shared e-scooters to the streets in and around Los Angeles. The internet-connected scooters are managed through apps on smartphones and the steps are simple Download an app for a scooter company, use the map to locate the nearest scooter, enter the credit card information, upload driver’s license photo, scan a barcode to open a scooter and then you can ride it. Park the scooter and end the trip on the app.


Shared e-Scooters in Santa Monica | Photo by Yuming Fang

The scooter startups market their products as a cheap, easy and environmentally friendly way for riders to reach last-mile destinations in cities with traffic jams and gaps in public transportation. It costs a flat fee of $1 to ride a scooter plus 15 cents per minute using a pay-as-you-go financial model.

The shared e-scooters have been in people’s sights fewer than two years, but the safety problem has become one of the most serious issues that scooters encounter. Cities have limited the total that each operator can have on the streets. In Santa Monica, each operator is capped at 2,000. In L.A. the maximum number of e-bikes and e-scooters per vendor is 2,500. But even with these caps, critics say other problems with the scooters have not been addressed. Certain stretches of Santa Monica or L.A. can seem overwhelmed by scooters, which riders can simply deposit anywhere, and which often wind up scattered randomly on the sidewalks. And concerns are mounting that scooters present a range of unaddressed safety hazards, both in their regulation and design. Since Oct. 18, 2017, a total of 60 scooter related incidents in Santa Monica have required an Emergency Medical Services response, according to the Santa Monica Fire Department. Incidents included scooter rider and vehicle collisions, as well as pedestrians tripping and falling over abandoned scooters strewn on sidewalks.

“My opinion, get rid of them,” said Julian Zermeno, Santa Monica’s EMS paramedic coordinator, in an email. “We have been on many scooter medical calls due to the riders falling down, crashing into people and getting hit by other vehicles.”

In addition to the safety problem, critics say dockless scooters block sidewalks, disability access ramps and green spaces, and rampage through the streets, which affect both pedestrians and vehicle drivers. As scooters are dumped in public places, people who don’t like them have easy access to abuse them. An Instagram account “birdgraveyard” says it is “a place for people to show their frustration” with the scooters, and features images of scooters that have been vandalized and discarded in the ocean and in dumpsters and shopping carts.

Credit to @birdgraveyard

Now, a class-action lawsuit filed in Superior Court of California has accused Lime, Bird, Xiaomi as well as other scooter firms of “strict products liability”, “gross negligence” and “aiding and abetting assault.” The plaintiffs of the lawsuit include a scooter rider, a motorist with a disability who was unable to access a parking space because it was blocked by scooters, and seven pedestrians injured by electric scooters.

Lawsuit File | Photo by Yuming Fang

Also, Lime, one of the leading scooter startup, was reported that their scooters would break apart when using. However, the problems didn’t block their growing speed for the nature of capital to pursue profits. The scooter craze has captured the heart of Silicon Valley and attracted billions of dollars of investment from venture capitalists. According to Bloomberg, Bird’s evaluation has reached $2 billion in June at an astounding pace. And the new fundraising round of Lime in June has valued Lime at a $1.1 billion. There is no authoritative statistics to show how many scooters the startups have distributed to the streets. But statistics from Lime and Bird show that Bird has worked out to 98 markets while Lime has had 149 markets within one year. With the powerful push from capitals, scooters startups cannot slow down their pace but expand their scales and markets at home and abroad, thus resulting in negligence in product quality and operational management.

Looking back the past three years, e-scooter is not the first shared micromobility launched for last-mile distance. From 2016, bike sharing took off in China’s cities, with lots of companies flooding the city streets with millions of shared-bikes. Time reports that around 60 companies have dumped between 16-18 million bicycles on Chinese streets. Similarly, shared-bikes can be unlocked when riders use the app to scan the barcode on bikes, charge riders with lossmaking low rental fees based on the time length per ride, and be parked at the roadside for the next customer. However, over the three years, China’s bike sharing project has experienced mania, then from bad to worse. What has happened to china’s shared bikes and will American’s shared scooters encounter the same experience?

According to People’s Daily, the state-run media in China, China has 400 million registered bike-sharing users and the daily number of riders peaks at 70 million. Also, Seventy-seven shared-bike companies have emerged in China over the last two-plus years, with a combined total of 23 million bikes distributed in China’s cities, towns, and even villages.

However, China’s bike fever has reached its saturation under unlimited blind competition. For the purpose of expansion, bike-sharing companies continuously purchased bikes from suppliers and distributed bikes on the streets. For one time, people can see eye-catching colorful bikes in every corner of the streets, resulting in an overcrowding of public spaces specifically in areas centered around public transportation such as sidewalks, metro stations, and bus stops. Also, without timely inspection and maintenance, dozens of bikes are broken and left casually in corners. In order to manage the situation, local municipalities have collected the bikes and dumped them in landfills. On the outskirts of leading Chinese cities, rows of brightly-colored bicycles are packed like trash in the tight formation after they are reclaimed. In August 2018, China’s national-level Ministry of Transportation issued a formal regulation, after which 30 Chinese cities passed regulations to guide shared bikes’ production, operation, and maintenance. The pace of bike production and distribution has slowed down and accordingly cooled down the cash-burning bike-sharing trend.

Shared Bikes Landfills in China | Source: Reuters

From June this year, several sharing-bike companies experienced capital chain rupture and stopped operation. Even Ofo, one of the two dominant dockless bike-sharing companies in China, got into trouble that it quitted overseas countries and cities from June and its domestic users could not get in-app deposit refunds because the refund button became grey and the customer service didn’t work. China’s media reported that “Ofo is getting into the capital chain problem and struggling for survival.”

According to the China Business Network, an employee of Ofo said the bike-sharing companies’ trouble is due to their lack of management. “It invested heavily in rapid market expansion, leaving less money for refined management, and operation and maintenance,” the employee said. Bike sharing companies should have focused on operation and maintenance details such as product optimization, scheduling and repair, and products’ revenue and costs. However, these companies didn’t stop to solve management problems but constantly asked for fundraising for speedy scale expansion. Also, the governments didn’t carry out regulations timely until they cannot ignore the problems shared bikes have brought to the society.

In comparison with shared bikes, e-scooters in the U.S. are experiencing similar situations. But we couldn’t conclude that the fate of shared e-scooters in the future would be similar to shared bikes in China. The lessons we could learn from shared bikes in China is that don’t let capital control the company’s development; in other words, scooter startups should focus more on user experience and products upgrading rather than pursue venture capitalists’ investment. Now, at first, the safety problem should be the top priority to resolve for scooter startups.

The Networks’ Battle for the Night

To most of us living in this day and age, late-night television really is not anything new. Anyone with a digital device and access to the web, and there is a lot of them, would have at least seen a few clips of shows and learned the names of the hosts and their shows. And because there is such a vast selection of them these days, people get to pick and choose. And usually, it is not the network or the program they are choosing, but the clips and segments they want to see. Thanks to the wonders of the internet, people get to do just that. However, younger viewers have no way of knowing, and more experienced viewers tend to overlook, or simply forget, that late-night talk shows used to mean something completely different, and has always been evolving throughout the past few decades. The business model of late-night talk shows, naturally, has changed with it too.


The late-night talk show has come a long way. Ever since television overtook radio as the primary medium in the 1950s, worldwide and in the United States, late night talk shows have become one of the signature features of American television. While television was in its infancy, the amount of original programming was quite limited, and networks had to fill most of niche hours with reruns. NBC became the first to venture into unknown territory in an attempt to prove there was a profitable market after 11 pm. The Tonight Show Starring Steve Allen was launched in September 1954, and it would turn out to be the beginning of NBC’s pioneering and dominance of late-night television in the following half century and more.


Though The Tonight Show Starring Steve Allen would eventually be moved to Sunday night under a different name to combat CBS’ The Ed Sullivan Show in 1957, what it had done was monumental for the future of late-night television – it proved that there was a place for original programming after 11 pm, and paved the way for all future shows and hosts. The format became the blueprint of the mainstream late-night talk show format that would be used by most network shows to the current day. It did not, however, establish a huge following at that time. This was made evident by two facts. Neither CBS nor ABC, the two competing networks, had come up with their own late-night program in the two and half years the show was on the air. And perhaps more of a judgment on the time slot than the show itself, NBC must have deemed the late-night time period expendable to move Allen to primetime on Sundays.


However inconsequential late-night was in comparison with Sunday night, NBC stuck with it, and mainstream success followed. After Steve Allen’s in-house relocation, NBC lined up Jack Paar from CBS to carry on the Tonight name. The highly emotional and unpredictable Paar became an audience favorite. In his heyday, Paar would occasionally draw 7 million viewers in the early 1960s. (Grimes) Little information regarding the competition can be found, but based on the fact NBC was the only network with original programming in late-night, it is safe to assume the competition was practically nonexistent. Considering the show was 105-minute long, and ran from 11:15 pm to 1 am during this time, the number was even more significant than the modern hour-long 11:35 pm shows numbers. At such a late hour, the shorter the runtime, and the earlier it ends, the more ratings will benefit, since the later it gets, the more people will turn off the television set and turn in. As he was popular, Paar was dramatic. At the height of his success, aged only 43, he abruptly announced he would be leaving the show on the air in March 1962, leaving his audience with endless emptiness, and many more questions than was ever answered.


They would not have to live with that emptiness for long. NBC once again called in a young host from another network to resurrect the late-night success Paar had. The young man named Johnny Carson did not disappoint, as he warmed up in the role in no time at all, and, all of a sudden, NBC was having monolithic success in late-night again. Paar and Carson were so popular that ABC and CBS would come up with their own late-night shows in hope of shadowing NBC, and taking away their monopoly. The likes of Joey Bishop, Merv Griffin, Dick Cavett, and Alan Thicke all came and went like shooting stars, unable to gain any traction opposite Johnny Carson in their futile effort.


As Carson swept away the competition as effortlessly as his signature golf swings, his leverage ultimately grew as well. In the first six months after he took over, he was averaging 7.5 million viewers per night. A decade later, the number was 11.5. In 1977, it became 17.3, having more than doubled his audience in 15 years. (Tynan) At this time, he was bringing NBC $50 million in profit per year, (Bushkin and Lewis) which mounts to roughly $1.8 billion in today’s money. In 1980, he got the ultimate deal with NBC: the runtime would go from 90 minutes to 60, he would be on only 3 nights per week, Tuesday through Thursday, his salary would be $25 million per year, and he would be taking 15 weeks off every year. (Bushkin and Lewis) As ridiculously lucrative as it sounded, NBC could not afford to see their monopoly fall apart.


As Carson established his empire in late-night, the scene seemed set for a long time. The first disruptor to surface came from, consequently, not from a rival network, but within NBC. Since The Tonight Show Starring Johnny Carson featured countless young comics over the years, many rose to stardom from their appearances. David Letterman, a former weatherman and radio host from Indianapolis, had set the record as the fastest comic going from being a guest to guest-hosting The Tonight Show, and was given a morning talk show by NBC in 1980. Though the show did not get good ratings in the early hour, it received critical acclaim, winning 2 daytime Emmys. In 1982, NBC decided to give him another shot in the time slot after The Tonight Show, 12:35 pm, and cancel broadcaster Tom Snyder’s interview program The Tomorrow Show, the previous occupant.


And a prince was born. Late Night with David Letterman caught on big-time, especially among younger viewers. Because Carson’s production company owned the show and specified the ways in which Late Night had to be different from Tonight, and partly due to the later hour, Letterman would experiment with wild stuff that people had never seen on television. It created a cult-like cultural and social sensation among the youth, and the advertisers took notice. An uncanny phenomenon occurred: for the first time ever, advertisers would go to NBC with something other than The Tonight Show as their top priority. In fact, many brands with a more youthful outlook, coca-cola and tennis sneaker companies for instance, even went as far as securing commercial time of Late Night first, and then buying The Tonight Show commercial time merely as an add-on thanks to Letterman’s much younger demographics.


In 1992 Carson walked away from it all. After intense negotiations and some bitter conflicts, Letterman did not eventually get the top job. It went to his comic friend Jay Leno, who had gained national fame by appearing on Late Night, and was Carson’s permanent guest host in the years before his departure. Letterman, eager to prove himself at the earlier time slot, 11:35 pm, left for CBS the following year to create The Late Show With David Letterman, and the nation had, consequently, been divided. For the many decades prior, NBC was as good as synonymous with anything associated with late-night, and had enjoyed a huge monopoly in the category. For the first time ever, America would have a viable late-night option outside NBC, and, more importantly, an alternative to The Tonight Show.


Having signed Letterman for over $14 million per year, a figure over twice Leno’s salary (Carter), CBS proved to be right with their investment. Not only did Letterman build a late-night franchise out of nothing at all, he would become the only saving grace CBS had in a particularly difficult time for the network. The entire network was at a complete loss after it gave up the rights of NFL football to FOX in 1994, and had nothing going for them in the many years afterwards, except The Late Show. The poor lead-in performance caused Letterman to lose his ratings edge on Leno, and he was never able to beat Leno in the ratings again.


Despite several changes in the 12:35 pm time slot, the 11:35 pm was a mano-a-mano battle for two decades, until ABC decided to puteir name in the race as well. After Jimmy Kimmel Live! moved up from 12:05 to take Nightline’s time slot, the monopoly that NBC had was now completely turned into a oligopoly.


That meant the already shrinking network late-night talk shows market – between 2011 and 2012, every network late-night talk shows’ total viewer count went down, except that of Jimmy Kimmel Live! – was now divided into even smaller pies. Though there are new platforms of revenue such as YouTube, the profitability of these platforms does not hold a candle to that of traditional television. On another note, the revenue generated by the internet is seldom firsthand. Often, hosts today want to get a high number of hits on the internet because they hope that will drive the viewers to watch their shows.  The role that the internet plays in generating revenue is more subtle than it seems, since the idea is less driven by direct revenue than by building up the audience.


As longstanding late-night host in the hour-long format, Conan O’Brien, transitions into a half-hour format, he proposed the refreshed and shortened show as “smaller cookie, more chocolate chips”. This is perhaps the way to move forward, as the viewers have gotten increasingly short attention spans and more and more at-home with entertainment consisting of mostly soundbites . If you cannot pique someone’s interest within a few minutes, or even seconds, in this world full of smartphones and Xboxes, chances are not good they will sit through a whole hour of the show.


Sources:


https://www.nytimes.com/1991/12/19/arts/jack-paar-the-carson-of-his-day-looks-back-with-the-usual-chuckle.html


https://www.hollywoodreporter.com/news/how-johnny-carson-quit-tonight-644508


https://www.newyorker.com/magazine/1978/02/20/fifteen-years-salto-mortale


https://www.nytimes.com/1993/01/15/arts/going-head-to-head-late-at-night-letterman-on-cbs-leno-on-nbc.html


Inside Conan O’Brien’s Digital Reinvention


Sports media rights battle, streaming may end reign of the broadcasters

As with essentially every industry, the ways in which we consume sports are consistently refined by technological innovation. Radio, as well as broadcast, satellite and high-definition TV have raised the profiles of baseball, football (both kinds) and basketball. The Internet, too, modified the ways we watch sports, with the ability to analyze information no longer through merely a television screen or that morning’s newspaper. With the web fully entrenched in basic society, new streaming services offer consumers real-time information essentially whenever and wherever they want it, decreasing the need to be in front of the television for a particular program — except for sports, live content’s last bastion. These changing dynamics in streaming, doubtlessly, will further upend the model of sports consumption and threaten the viability of broadcast networks in favor of newer technology companies.  

The standard over the past few decades has been for sports leagues to sign “media rights deals” with content providers, who pay to broadcast their games and content throughout the nation and the world, primarily on television [source]. Technological advancements and the practice of economic globalization have enlarged the population of sports consumers; the “rapid rise in sports costs is consistent with supply/demand theory,” creating a “constant imbalance in favor of the … nearly permanent supply shortage of top talent [while] … there are more potential bidders for their services” and content featuring the minuscule number of superstars [source]. So, the value of the sports leagues’ content has leapt and will continue to leap, because the “number of competitors is relatively large … generating continuous high demand” [source]. To date, the majority of these sports media rights deals have been with television companies, which broadcast the sporting events and highlights into homes. As Mark Leibovich, author of the book “Big Game: The NFL in Dangerous Times,” notes: “60 percent of [NFL] revenues [come] from TV over most of their history, and the ratings are going down” [source]. The leagues are paid handsomely for their content, now at the level of billions of dollars per year. To illustrate, the NBA signed its most recent national TV deal in 2014, a $24 billion, nine-year contract with Disney (through its media networks ESPN/ABC) and Turner Sports, which took effect in 2016 at a rate of $2.667 billion per year [source]. To make revenues and account for the rising costs of producing live events such as sporting events, the operators charge a fee to consumers for the channels that show it.

The research firm SNL Kagan has estimated that in 2017, “$18.37 out of the typical cable subscribers’ [$103] monthly bill was allocated just to sports networks like ESPN and Fox Sports” [source]. Sports – live content – is king. Where pay-TV providers charge more for regional sports networks, it is even higher, as much as “$20 to $25” per month. This is a raise of over five hundred percent since the start of the millenium [source].

However, simultaneous with rising fees over that time period to help pay for the increasing sports rights came the new streaming services and technological advancements that have allowed people to access content, such as movies on Netflix or sports, in a mobile manner. Young people especially are not watching cable anymore; according to Pew, 61% of adults ages 18-29 use streaming services as their primary way to watch content traditionally only available on a television [source]. Choice is king for the people who are going to be consuming content for the next generation. These “a la carte” services, claims NBA Commissioner Adam Silver, are the future of how the majority of people will watch sports [source]. This season the league has started selling not just slices of the 82-game season on a game-by-game basis but also parts of games as well, in order to provide more “customized experiences to meet the needs of NBA fans” [source]. A la carte offerings are perfectly suited for the mobile-first methods of the digital natives, who will come to dominate the consumer base of the media industry.

As a result, they are the main “target in the push to increase TV-anywhere options. Unlike older viewers, they were brought up in the internet age. For them, spending a significant monthly fee on cable TV isn’t a necessity,” especially when they are paying for dozens of channels they never watch [source]. Paying as much as $25 monthly just for sports deters many from shelling out their hard-earned money, because they could pay that much to watch just the shows they want [source]. Why pay $100 for a buffet if out of three dozen items, you are only going to eat two, which cost a fraction of the buffet?  

As an executive at a top streaming service company said, the industry is changing rapidly [personal conversation]. Streaming and a la carte choice options are revolutionizing how we watch content and as a result the traditional cable and network companies need to adapt.

Because the “typical cable TV regional sports network (RSN) recoups less than 30% of its total revenue from advertising” they are desperate to retain as many subscribers as possible, who account for “the vast majority of revenue” [source]. National TV providers take in a similar level of revenue from subscriber fees, according to the FCC as well as an ESPN executive [personal conversation].

As sports rights rise, the companies charge more in fees to help break even; at $7.21 per subscriber, ESPN is now the most expensive single cable network available in one’s cable/satellite bill [source]. While the total subscribers is indeed falling, demand is not: because it is the one place live content still rules, where advertisers can be sure that people will tune in during the event, ESPN can afford to charge that much (to people who want to pay for it). For the people who want to buy the cable buffet because that is the only way they can watch their local teams or get blacked out, it is presently worth it [source]. As Rich Greenfield of BTIG wrote, “Sports is … the only content that is holding its audience viewership-wise and in turn supporting the $70 billion TV ad industry” [source]. However, the number of homes paying for ESPN declined over ten percent in the last five years, from 100 million in 2012 to just 87 million last year.

As 23 percent of U.S. households have either cancelled cable or never signed up in the first place, according to a 2016 PwC survey, the trend ESPN is facing should only continue [source]. Now more than ever, cable networks must extend or renew their TV rights to attractive sports programming. As PwC’s sports industry outlook notes, sports are essentially “the only thing keeping the lights on at the networks” [source], especially at ESPN, whose business model is solely based on 24-hours-per-day sports content. They literally cannot function without the content that has made them a behemoth in the industry.  

So, cable networks are jumping headfirst into the over-the-top and streaming game, threatened by new media’s rise and the decline of their own subscriber base. To survive and continue to have success in this changing media landscape, they cannot be satisfied with their current subscribers. Like Ariel in The Little Mermaid, the networks need to be “part of that world … where the people are” [source] — which in this case is streaming and “pay-anywhere TV.” Disney is spending millions of dollars on “ESPN+”, CBS on “CBS All-Access”, Turner on “B/R Live” – their attempts at creating streaming services. It remains to be seen whether the promulgation of streaming services (along with another Disney service to be launched next year, HBO, Amazon, Hulu, Netflix…) will cause a glut of menu items for consumers, which may be where we are heading in the near future as companies look to hoard their own intellectual property and control sports rights [source]. However, in sports, the possibility of a large media or technology conglomerate claiming access to a near-entirety of a league’s offerings could lower consumer angst. NBA Commissioner Emeritus David Stern wonders about the “unique possibility to have one buyer on a global basis. It could be Apple, Amazon, Hulu, Facebook, Google, AT&T—could be almost anything” [source]. The current battle over regional sports networks will perhaps be a test case.

In 2002, the New York Yankees developed the Yankee Entertainment and Sports (YES) regional sports network to strengthen the value of its content for local consumers and develop new revenue streams. Major networks such as ABC or FOX had only broadcast select numbers of games per season to people around the country; regional networks proffered the opportunity for viewers to watch nearly all their home team’s games. The Bronx Bombers’ enterprise introduced the RSN epoch: many teams in MLB and the NBA now have launched their own networks to take advantage of local revenues; in the MLB, these contracts are worth anywhere from $1.5 billion (Arizona Diamondbacks) to $3 billion (Los Angeles Angels) over twenty years [source]. Markets like Los Angeles or New York have greater demand and numbers of viewers for the same content as Arizona, therefore those media rights deals rake in as much as double the revenues (and is a key reason why the Angels changed their city name from “Anaheim” to “Los Angeles”) [source]. These dramatically different local media rights deals also affect competitive balance and league health: The Los Angeles Lakers’ local media deal dwarfs any other NBA franchise’s by about $25 million; they were the most profitable team in the league despite missing the playoffs for five consecutive years [source]. Moreover, in MLB, owning significant portions of these extra revenue streams has helped teams like the Red Sox and Yankees dominate free agency and acquire the “star talent”, like Alex Rodriguez, who drive content values high [source].

Over the last two decades, Fox acquired in exchange for a “yearly licensing check” majority stakes in 22 RSNs, the value of which has now ballooned to $44 billion due to all the exclusive premium sports content, according to Guggenheim Securities [source] [source]. And so it goes that Disney’s recent acquisition of 21st Century Fox will reshape not just the movie industry (decreasing the number of major studios from six to five) but also sports content [source]. Fox’s regional channels serve around 61 million subscribers around the country, a godsend to cable operators and a would-be boon to technology companies looking to seize market share and eyeballs from one another. The 22 RSNs that Fox owned will have to be divested as a result of the deal, to prevent “cable television subscription prices from rising even higher … and ensure that sports programming competition is preserved in the local markets,” according to Makan Delrahim, assistant attorney general and head of the Justice Department’s Antitrust Division. “American consumers have benefitted from head-to-head competition between Disney and Fox’s cable sports programming” [source].

The competition will only get fiercer, as more players enter to gain direct consumer attention, arguably the most valuable market good there is. The forthcoming battle for sports media rights will truly be the “ultimate test of the supply/demand equation, an underlying principle of the free enterprise system and free market economy” [source]. Fox’s 22 MLB regional sports networks is now up for grabs, and who is bidding for them will be a harbinger of the coming battle for sports content come the next decade once deals expire for the major leagues — and for viewers in the future of the 21st century. Consistent with supply and demand economics, the values of sports rights will rise, with the same amount of content, the escalating emphasis of live programming for advertisements, and more possible buyers. This could drive vicissitudes of fortune for traditional broadcasters. A Defcon 1 scenario would be if a traditional broadcaster loses out entirely on a sports rights deal. Amazon, Twitter, Alphabet’s YouTube, and Facebook have each already made forays into paying for live sports, streaming NFL Thursday Night Football, NBA games, and MLB games, respectively, via their over-the-top services. The Financial Times notes that these moves are “part of a wider shift toward so-called “skinny bundles”, whereby consumers are offered a smaller range of channels for a fraction of the price of a full cable package” [source]. Amazon has already put in a bid for the RSNs, if not merely to drive up the cost for another winner, then to implement them into Amazon Prime services similar to their actions with Thursday Night Football on the chance they end up claiming the networks. “It [would increase] digital advertising opportunities for Amazon, which is growing its market share against Facebook and Google. Perhaps most importantly, it brings even more people into the Amazon tent, exposing them to all of the products and services Amazon offers,” according to CNBC [source]. On another front, no less than Fox chief Rupert Murdoch has said that “Facebook is coming for sports;” Dan Reed, a Facebook executive, says that “sports is a natural fit” [source]. Having dipped toes into the water, the large technology companies are going to dive wholeheartedly into the sports media business in the near future. Even if tech companies do not win this RSN test run, they will no doubt be major players in the bidding for the future sports rights, 16 major auctions of which are coming worldwide over the next half-decade, according to GroupM [source]. Claiming some if not all of those rights and shoring up their relatively nascent streaming services will reshape media offerings.

The tech giants’ enormous capital reserves [source] that could drive up the bidding to an exorbitant level ($4 billion for the NFL? $2 billion per NBA season?) probably won’t destroy the financials of some traditional broadcasters by the early 2020s, but that combined with growing rate of subscriber drop-off (could only 50 million homes be cable subscribers in five years?) will hamper networks’ abilities to spend as much on rights the next time around. It is quite a possibility that there could be an internecine battle between broadcasters, resulting in a pyrrhic victory for the winner. Already, rights have gotten so expensive that ESPN could not win the bidding for the Champions League and accentuate its investment in MLB rights [source]. Come the second wave of these types of deals in the late 2020s, the costs could deter some broadcasters from seriously bidding for them. Perversely, over the long term, rights deal valuations may fall as broadcasters drop out, although other technology companies could enter the fray and stabilize or even drive up pricing. As David Stern literally said today, “you have to look to the future or you die” [source]. Because broadcasters are slowly coming around to reality out of dire necessity, they may survive in the short term. In another decade, in 2030, though, we may all be watching sports through the services of our Amazon or Alphabet overlords, ironically with more customizable options.


Sources:

http://home.bt.com/tech-gadgets/internet/streaming-explained-what-is-it-and-how-does-it-work-11363860639261

https://business.comcast.com/about-us/our-history

https://www.crunchbase.com/organization/yes-network#section-overview

https://digiday.com/media/what-is-over-the-top-ott/

https://money.cnn.com/2017/07/19/investing/apple-google-microsoft-cash/index.html 

https://www.digitaltrends.com/movies/too-many-streaming-services-netflix-amazon-disney-att/

https://www.cnbc.com/2018/11/20/amazon-threat-to-buy-sports-rights-should-freak-out-media-companies.html  

https://adage.com/article/media/pwc-report-sports-m/311578/

https://mashable.com/2015/07/23/nba-league-pass-new-deal/#pRXrKXEIJgqz

https://www.washingtonpost.com/business/2018/12/06/david-stern-built-modern-nba-now-he-wants-change-how-we-consume-sports/?utm_term=.0ffeb77a5167

https://www.forbes.com/sites/bobbymcmahon/2017/08/18/turner-sports-uefa-champions-league-strategy-a-nod-to-the-long-tail/#5738b00d4594

https://variety.com/2018/digital/features/olympics-rights-streaming-nbc-winter-games-1202680323/

https://www.businessinsider.com/sports-media-rights-revenue-poised-to-grow-2017-12

https://www.forbes.com/sites/barrymbloom/2018/08/28/yankees-intend-to-buy-back-yes-network-after-fox-sale-to-disney/#5b70b9db161d

https://www.21cf.com/news/21st-century-fox/2014/21st-century-fox-acquire-majority-stake-yes-network/

https://www.ocregister.com/2015/01/07/los-angeles-angels-of-anaheim-10-years-later-how-big-of-a-deal-was-the-name-change/

https://www.theatlantic.com/business/archive/2017/05/espn-layoffs-future/524922/

https://www.youtube.com/watch?v=SXKlJuO07eM

https://variety.com/2018/biz/news/disney-21st-century-fox-justice-department-approval-1202859241/

https://www.forbes.com/sites/maurybrown/2017/05/08/why-espn-hemorrhaging-subscribers-will-impact-the-next-wave-of-national-tv-deals/#54aad835bf4f

https://finance.yahoo.com/news/youtube-amazon-fighting-sports-streaming-supremacy-114738861.html

https://www.theguardian.com/media/2018/may/14/streaming-service-dazn-netflix-sport-us-boxing-eddie-hearn

https://www.latimes.com/business/hollywood/la-fi-ct-disney-fox-sports-nets-espn-20171206-story.html

https://www.si.com/tech-media/2018/07/12/fox-regional-sports-networks-potential-buyers-comcast-disney

https://www.theatlantic.com/entertainment/archive/2011/09/the-many-problems-with-moneyball/245769/

http://time.com/money/4590614/cable-bill-sports-cord-cutting-streaming/

http://www.snl.com/Sectors/Media/

https://www.recode.net/2018/9/10/17838688/mark-leibovich-big-game-nfl-dangerous-times-book-drug-lord-crack-kara-swisher-recode-decode-podcast

https://www.amazon.com/dp/B078LTFG52/ref=dp-kindle-redirect?_encoding=UTF8&btkr=1

http://www.pewresearch.org/fact-tank/2017/09/13/about-6-in-10-young-adults-in-u-s-primarily-use-online-streaming-to-watch-tv/

https://www.businessinsider.com/espn-losing-subscribers-not-ratings-viewers-2017-9

http://time.com/money/4590614/cable-bill-sports-cord-cutting-streaming/

https://www.chicagotribune.com/sports/columnists/ct-sports-tv-future-spt-0828-20160826-column.html

https://www.washingtonpost.com/sports/2018/09/27/nba-fans-will-be-able-purchase-ends-games-streaming-services/?utm_term=.22f10653c3fc

http://www.pewresearch.org/fact-tank/2017/09/13/about-6-in-10-young-adults-in-u-s-primarily-use-online-streaming-to-watch-tv/  

http://www.nba.com/2014/news/10/06/nba-media-deal-disney-turner-sports/

https://beonair.com/history-of-sports-broadcasting/

https://transition.fcc.gov/enbanc/121897/anshand.pdf

https://www.ft.com/content/2234f4da-3ef8-11e7-82b6-896b95f30f58

https://www.latimes.com/business/hollywood/la-fi-ct-disney-fox-sports-nets-espn-20171206-story.html

http://www.pewinternet.org/2015/12/21/4-one-in-seven-americans-are-television-cord-cutters/

http://www.espn.com/mlb/news/story?id=1735937

http://www.espn.com/nba/story/_/id/20747413/a-confidential-report-shows-nearly-half-nba-lost-money-last-season-now-what

Personal interview/lecture, ESPN executive, Spring 2017

Personal interview/lecture, Professor Jeff Fellenzer, USC, February 2017

Personal interview, Professor Jeff Fellenzer, USC, November 2018

Personal interview/conversation, Perform Group executive, summer 2018  


Schools and the poor are the real losers of the lottery

By Roy Pankey


I don’t like to throw away my money. But in late October of this year, after the California Mega Millions jackpot topped $1 billion, I bought a handful of lottery tickets. I even waited in line with dozens of other hopefuls for half an hour at Bluebird Liquor in Hawthorn, where the lottery tickets are rumored to be extra lucky. Needless to say, I didn’t win.

Neither did California schools.

The state lottery is practically printing its own money. Though California Lottery hasn’t made public its total revenue for the 2017-18 fiscal year, the California Department of Education (CDE) projected total sales of $6.75 billion for this period, an historic high. That’s more than total revenue of Fortune 500 companies like Ralph Lauren, Ulta Beauty, Harley-Davidson, and Hasbro.

This sum comes after several years of increasing sales for the California Lottery, which sounds like a win for the state’s schools. Yet even as the lottery is selling more tickets than ever before, California schools aren’t receiving any additional funding. In fact, lottery payouts to education are essentially the same from a decade ago.

How can this be? Eight years ago, state legislators changed the requirements of the lottery system.

When 57.9% of voters passed the California State Lottery Act in 1984, they mandated that 34 percent of total lottery revenue be paid to public education. This law withheld until lawmakers abolished that requirement in 2010. The new law requires that the lottery “maximize revenues for public education by operating as efficiently as possible.”

Ticket sales dragged during the Great Recession, and legislators loosened reigns on the lottery to increase jackpots and sales overall. They knew the percentage of each dollar paid to education would fall but hoped the increase in revenue would lead to an increase in total payout to schools.

It’s not happening.

In its public education contribution report for the 2017-18 fiscal year, the California State Lottery indicated that it raised just under $1.7 billion for schools.

At first glance, that sounds like a huge, great number. (First graders shall never want for colored pencils again!) However, education payout represents just 25 percent of the $6.75 billion in projected sales for the year. In past years, the payout percentages were much higher. The lottery is making more money than ever, but schools aren’t seeing any of it.

Lottery revenue dramatically increased after 2010, but payout to schools did not. (Source: LAist)

Zahava Stadler of EdBuild, a non-profit that closely studies education funding, told The Press Democrat, “The fact that education dollars have remained pretty flat tells you that more and more what the state is doing here is running a casino, rather than funding public schools.”

Funds raised by lottery ticket sales account for less than 1.5 percent of all education funding in California. Money is distributed among K-12 schools, California State University, University of California, community colleges, and various other educational institutions. About 80 percent of payouts go to K-12 education.

In a statement on its website, the CDE says the money it receives from state lottery ticket sales “represents only a small part of the overall budget of California’s K-12 public education that alone cannot provide for major improvements in K-12 education.”

Since its inception in 1985, the California State Lottery has contributed more than $32.5 billion to education. Its all-time biggest expense—a whopping $53.8 billion—has been awarded to lucky prize winners.

Distribution of Revenues (in billions) October 3, 1985 – June 30, 2017 (Source: California State Lottery)

Distribution of Revenues (in billions) October 3, 1985 – June 30, 2017 (Source: California State Lottery)

In October 2017, officials who run the Mega Millions game were concerned that frequent, smaller jackpots—say, $100 million or less—would result in fewer ticket sales. They thought people would become too familiar with prizes like these and would be discouraged from buying any tickets at all. Gordon Medenica, head director of the Mega Millions Group referred to this phenomenon as “jackpot fatigue” in an interview with The Washington Post.

Now, the Mega Millions pools are paid out much more infrequently, allowing them to swell and swell to unprecedented amounts. Adding to the paucity of payouts was an increase of numbers to choose from on each ticket, as more numbers decreases a player’s odds. Another change that powered tickets sales was the increase in the price of the tickets themselves. They now cost $2, double the prior price.

The California Lottery estimates that more than 19 million people played last year. That’s more than half the state’s population old enough to gamble. In California—like in most states with a lottery system—vendors sell a majority of tickets to low-income individuals.

An analysis by LAist of two years of lottery ticket sales in California found that:

  • Most tickets are purchased by the poorest fourth of census tracts in virtually every county.
  • Most tickets are purchased in Southern California census tracts with high Latino and Asian-American populations.
  • Most tickets are purchased in Southern California’s Los Angeles, Riverside, San Bernardino, Orange, and Ventura Counties.

Dr. Timothy Fong, director of the gambling studies program at UCLA, told the publication, “The lottery does seem to be more harmful for, as you can imagine, lower economic communities, ethnic minorities.” Communities spending the most on lottery tickets are the same communities who are in most need of the system’s education funding.

That disparity hasn’t happened by chance. With the help of high-powered advertising agencies, the lottery markets to California’s diverse populations.

2018 Lunar New Year scratcher advertisement in Chinese.

To reach Asian-Americans, the lottery has developed products like its Lunar New Year ticket, whose jackpot is $888. The number eight is associated with wealth in Chinese culture.

In October, marketing agency David&Goliath placed the winning bid for California Lottery’s $295 million account as part of a five-year contract. Together, the two will continue marketing to California’s diverse communities and working toward the Lottery’s goal of becoming “the largest lottery in the U.S.” (It trails only New York.)

Of all California cities with populations over 50,000, Westminster, located in northern Orange County, sells the most lottery tickets per capita. The city sold $668 worth of tickets to each resident in 2016 and 2017. The median household income in Westminster is $55,287, while the median household income for the state is considerably higher at $67,739.

Some other California cities selling the most lottery tickets include Huntington Park, Inglewood, Hawthorne, and Compton at $392, $359, $330, and $323 per capita, respectively. All of the median household incomes in these cities are even lower than that of Westminster.

The Mega Millions used to work like this: Players chose five numbers from 1 to 75 and a Mega number from 1 to 15. Odds of winning the jackpot were 1 in 258,890,850.

Since officials altered the Mega Millions tickets, players now choose five numbers from 1 to 70. They still choose a Mega number, but the range increased to 1 to 25. Now, odds of winning the grand prize are 1 in 302,575,350, meaning my chances of getting rich decreased by more than 16 percent.

Odds that schools will win big? Still unclear.

A Tale of Two Malls: the economics of an ailing American icon

Westside Pavillion, 2008., Los Angeles, California.

If you want to find an example of the current state of American shopping mall, you may want to take a visit to Westside Pavillion in Los Angeles. Like so many dying malls across the US, Westside Pavillion is an eerie, empty site during operating hours. In better days, the mall was the site for movie shoots and music videos. Now, anchor stores like Nordstrom and Macy’s have left the mall, leaving only the Landmark Theatre, Urban Home, and Macy’s Furniture Gallery behind. The mall is set to close in 2021, and will be remodeled for office space for media and tech companies. Westside Pavillion’s story isn’t unique. For instance,  a quarter of American malls are in danger of closing.

However, some other shopping malls tell a different story. If you take the twenty minute drive to The Grove, you’ll find a different sort of retail story. Customers flock towards it’s luxury department stores and stroll through a nostalgic boulevard with a matching emerald green trolly. Built in 2001, as a “Main Street for a city that does not have one” some may see the Grove as a shining example of the new american mall. You can find the same  open air, luxury stores, and experiential designs in other popular, revamped malls like Westfield Century City and Santa Monica Place.

The Grove, Los Angeles, California Source: Wikimedia Commons

So why are some malls doing better than others? While many American malls are closing, the survivors are adapting in order to accommodate the new offline retail experience: luxury goods and attractions.  As online retail continues to grow, dying malls and retail also affect labor demands and deplete a form of revenue for some vulnerable counties.

Symptoms

How does a mall begin to die? Data shows that one symptom was the Great Recession. plowing While the recession helped put brick-and-mortars like Toys ‘R’ Us, Sports Authority, and Circuit City out of business, it had a lasting effect on malls as well. General Growth Properties, which owned almost 18 percent of American malls during the recession, filed for bankruptcy in 2009. A lack of customer traffic drove profits down. It was difficult to turn dying malls into repurposed spaces due to declining property values and the subsequent end of the building boom. Online retail also aided in the decline of American malls following the Recession.  While internet retailers represent just about 10 percent of retail sales, mall stores like Claire’s, Radioshack, and Pacsun struggled to compete with online demands.

As both department stores and small tenants began to close, vacancy rates began to rise. In 2008, the total vacancy rate for US shopping malls was 7.1 percent, compared with 5.8 percent in 2007. However, there is some evidence that the mall development explosion in the 80s and 90s just created too many stores to survive through economic recession. For example, almost 60 percent of Macy’s closing stores today are within 10 miles of another Macy’s location.  

In contrast, Nordstrom, a department store with higher price-points, has adapting changes in online retail. In addition to opening more locations, Nordstrom generates almost a quarter of its sales online, that rate is higher than its competitors in Macy’s, Kohls, and Jacey Penney who hover around 15 percent. Even with the rise of e-commerce, sash-strapped middle and working class customers have found other avenues to find what they need for lower prices. Ulta Beauty, TJ Maxx, and the Home Depot have moved into fill the needs that these anchors used to fill and continue to open stores.

When anchors close, the smaller tenants close up shop, leading to more dying malls. As of October 2018, closings of anchors like Sears, Bon-Ton, and JC Penney and mall stores like J. Crew, Abercrombie & Fitch,have pushed the total enclosed mall vacancy rate to 9.1%.   However, while B, C and D class malls- or malls in “in less desirable locations and home to less coveted tenants with lower sales per square foot” are vulnerable to vacancy rates and closing, the luxury mall or A class, has shown signs of success.


Only the Strong (or Wealthy) Survive

“Within 10 to 15 years the typical U.S. mall, unless completely reinvented, will be seen as a historical anachronism, “said Grove developer Rick Caruso at a National Retail Federation’s annual convention in 2014.

The “typical U.S. mall” had a Macy’s, Boscovs or Dillards. It had parking lots, skylight, and a food court. It catered towards a growing middle class with cash to spend with stores that fit their income bracket. But, Class A malls, or the kind of retail experience that Rick Caruso has built with the Grove: luxury department stores, expensive brands, and fine dining with a walkable “main street.”

While other Class A malls may lack the Caruso’s visual flare, the bare bones of their business plan is similar.  The King of Prussia mall, the second largest mall in the US, underwent a 155,000-square-foot expansion and ushered in luxury tenants like Cartier and Jimmy Choo. While luxury department stores like Neiman Marcus, Saks Fifth Avenue, and Nordstrom have fewer stores, they have locations in the majority of the the nation’s most successful malls.

According to research by Boenning &  Scattergood, the 20 most valuable malls in the country make more than 21 billion in retail sales. According to Fung Global Retail & Technology, just a fifth of the nation’s luxury malls generate more than 75 percent of mall revenues.

At the same time, income disparities continue to widen in the US. According to Vox, in the years between 1980 and 2018, “the poorest half of the US population has seen its share of income steadily decline, and the top 1 percent have grabbed more.”

“It is very much a haves and have-nots situation,” said D. J. Busch, a senior analyst to the New York Times. Wealthier americans “will keep going to Short Hills Mall in New Jersey or other properties aimed at the top 5 or 10 percent of consumers. But there’s been very little income growth in the belly of the economy.”

Data also shows that millenials have less money than previous generations, as stagnant wages, debt, and rising housing prices cause millenials to spend “nearly $20 less every day than their counterparts roughly 10 years ago,” according to a recent Gallup poll.  And as almost three quarters of millenials prefer to spend more on experiences than material items, the malls have to adapt to that need with expensive renovations.

As anchor stores marketed towards working-to-middle-class clientele close and brick-and-mortar retail demands change, luxury malls remain. If all the business has flowed towards malls with the ability to finance opulence and entertainment, what happens to the communities that called those now dead malls home?  

A Post-Apocalyptic Future

As customers lose their shopping malls, local workers lose their jobs. According to the Bureau of Labor Statistics, Department stores have shed 500,00 jobs since 2002, which is almost is almost 18 times more workers than coal mining.

Before the Recession, 2.4 million workers were staffed in retail than manufacturing and health care. However, ten years later,  the education and health services industry employs more than 34.48 Americans, while the retail industry employs 20.3 million.   


The rise of e-commerce industry has also opened up job operuntities. Amazon and other companies continue to higher more and more workers to staff fufillment positions in warehouses, all the while holding competitions to develop even more effecient robots to work in those warehouses.  

Even as American workers adapt to changing demands, communities will have to adjust from the revenue benefits of brick-and-mortar retail. Montgomery County,PA gets 50 percent of its revenue from the King of Prussia mall, the 2nd largest mall in the US. However, the county is the second wealthiest in the state by income with around a $40,076 per capita income.Other counties across the mid-atlantic region stand to be affected by the loss of the revenue from regional malls and access to jobs. Berks, Columbia, Allegheny and other Pennsylvania counties all have dying malls in 2018 and have per capita incomes less than $29,000.

The labor force participation rate decreased by more than three percentage points from 2000 to 2015. While unemployment rates remain low, fewer workers will have to support a growing retired population in the future. At the same time when other emerging employment opportunities in the gig economy have a technological timestamp, the transformation of the American mall is more than just the end of food courts and your local department store, but also provides insight into the changing nature of work, income, and consumer behavior in the US.

Are Newspaper Publishers on Track to End Up in the “Extinct” Exhibit?

The American newspaper industry has used advertisements as its main source of revenue ever since the very first colonial publication, the Boston News-Letter, printed a real estate ad in 1704. Though this “newspaper” was only a half-sheet, single-spaced weekly journal, it p aved a business model that would be used over the next three centuries. Then, nearly three hundred years later, the wheels came off the wagon. It no longer made economic sense to pair editorial content and advertising together in a printed product in the age of ad networks and digital distribution.  Paperboys found themselves unemployed and traditional reporting jobs dried up. The digital revolution’s effects are still playing out, but there seems to be a way for publishers to charge ahead—by focusing on differentiating content and by taking exclusive ownership of high-quality, specific data that is valuable to advertisers. Many papers have revised their business models to target younger, more internet-savvy audiences. After all, when an e-commerce pioneer like Jeff Bezos buys the Washington Post, it’s clear that journalism is merging into the virtual sphere. But the dust has not totally settled. The field may look like it is heading in certain direction now, but things are constantly changing. It’s important to remember that just a few decades ago, most people would have never guessed that physical newspapers would start to disappear.


Prior to the internet, publishers had the upper hand. They had limited space in their newspapers and advertisers were willing to pay for a section so that readers could see their product. Although not every reader fell under the demographic most likely to be interested in purchasing, advertisers could buy up as much space as possible and thus increase the likelihood of reaching people from that specific group. Technological advances, however, took out the element of scarcity—theoretically, anyone in the world could access the internet and read content that was once only accessible by purchasing a physical copy at a news stand. This made the price of a non-tailored advertisement close to none. Advertisers became much more interested in placing their ads on websites that attract their target demographic rather than buying as much ad space as possible and hoping that group sees it.


People who were only interested in reading one specific section did not have to buy the entire paper to access it—media was finally unbundled. It created the ability for businesses to choose to advertise in places where their target demographic frequents, making their strategy less reliant on volume and more reliant on consumer data and tailored audiences. If someone wants to read the latest updates in the fashion section, they do not need to buy the politics and sports section as well.


This kind of shift, however, has been seen before. Journalism is not the first industry to have been affected by the unbundling of media. When technology allowed people to purchase individual songs on handheld devices without buying the entire album first, the revenue landscape shifted. Suddenly, Apple and other streaming services had a slice of the revenue pie, and that pie was also shrinking. Overall recording revenue fell, and artists were getting the short end of the stick. Many songwriters, like Taylor Swift, fought back on social media. Taylor released a letter exposing Apple’s stingy licensing agreements. Artists who previously relied on selling music to make a profit are now more focused on merchandising and concert tickets.


Similarly, the internet has ushered in an urgent need for newspapers to adapt and find ways to make money. For the journalism industry, the unbundling of media was a good thing for everyone involved except for the publisher. It led to a major power shift—advertisers now want to do business with networking and search engine companies instead of newspapers. Facebook and Google have a virtual duopoly on the digital advertising market, which grew 21% to $88 billion in 2017. The two companies accounted for 90% of that growth, and reason is simple: access to information. More than one billion people—who have likes, dislikes, friends, and interests—are active on Facebook. Google has a similar advantage as it processes more than 70% of the world’s search requests. When you search something on Google, the company finds out where you are and tracks what you’re searching, compiles that information, and sells it to potential advertisers. Advertisers were no longer willing to pay newspapers high amounts because it makes much more sense for them to pay Facebook and Google.


Unfortunately, rapid technological changes have a tendency to force sink or swim results. Between 2008 and 2017, the total number of newsroom employees declined 23%.Though technology does create a demand for new jobs, so far, it has not been enough to offset the loss. The number of digital employees increased by 79%, but that only created around 6000 new jobs while there were 32,000 layoffs within the same time frame. It is important to note that these numbers could change within the coming years as the industry finds new ways to adapt.


One way the industry has started to adapt is by shifting away from using advertisements as its main source of its revenue. Big players like the New York Times, the Wall Street Journal, and the Chicago Tribune grew their digital subscriptions in 2016 by 46%, 23%, and 76%, respectively. While top performers have been able to keep their heads well above water, both digital and print circulation for the industry as a whole saw an 8% decline in that same year. Getting subscribers is not easy for a majority of newspapers with less of a cult following. People tend to trust far-reaching, big publications like the NYT, thus keeping the high-circulation outlets right at the top.


The other way to get subscribers is by targeting a specific readership. In a 2017 study by the American Press Institute, the top reason cited by subscribers who were willing to pay for news services was that the outlet offered unique content on topics they personally cared about.  Thus, if you do not have the clout of having the highest circulation in the country, differentiating your content could be the way to go.

Differentiating content does increase the likelihood of attracting a higher subscription rate, but it also has another crucial bonus—it appeals to advertisers. Sites like Buzzfeed and Refinery 29 have already employed a tactic known as “native advertising.” These sites target a specific audience and integrate advertising into their content, making the product placement relatively subtle and extremely valuable. Disney could pay for a pop-up ad that people click out of immediately, or they could instead pay Buzzfeed to create a quiz called “Eat Your Way Through Disney Parks And We’ll Guess How Old You Are.” Studies have shown that consumers find native advertising is more interesting, informative, and useful than traditional ads. Though Buzzfeed and Refinery 29 do not charge for subscriptions, the money they make in sponsored content keeps advertisers happy and their profit margins high.


Another way the newspaper industry is fighting back is by playing Facebook and Google’s game of controlling consumer data. Industry executives are well aware that advertisers are willing to pay high amounts for accurate and verified data about potential consumers who visit their sites. Several publications have started doing this by joining coalitions aligned with advertising technology providers, whose goal is to leverage audience data. One example is the Local Media Consortium, who says they are “focused on increasing member companies’ potential share of digital revenue and audience by pursuing new relationships with a variety of technology companies and service providers.” For newspapers, joining this kind of group instead of letting a third-party interfere can help put their profit margins back on track.


The dust of the industrial revolution has not fully settled, but there seems to be a path forward for news publishers. Though big names like the New York Times seem to be the ones most likely to forge ahead unscathed, smaller-scale publications still have a chance to succeed. Right now, newspaper companies may be discouraged and might blame technology for shrinking their profits. But this is just an example of technology doing what it does best: forcing progress. The internet has allowed billions of people to access news across the globe, connecting people to information like never before. The journalism industry just needs to catch up. And it will.

Behind ‘fast fashion’ brands are underpaid workers working in sweatshops

Lured by the promise of a restaurant job paying $1,000 a month, Yeni Dewi travelled to the United States on a tourist visa in 2013. Once here, she realized she had been trafficked. She was forced to work as a domestic help at a house in Sherman Oaks near Santa Monica. She worked 18 hours daily and was paid $200 every 35-38 days. She managed to escape after a couple of years and has been a garment worker ever since.

Currently she works at a garment manufacturing factory near the intersection of Wall Street and 8th Street on the outskirts of the Fashion District in downtown L.A. Dewi said that the factory is a supplier for Fashion Nova. But she earns around $300-$350 per month even though she works for at least 40 hours every week.

“I don’t like the situation…but I have no other choice,” said Dewi, who is mother to a daughter here and a son who lives back home Indonesia with his grandmother.

Yeni Dewi with her daughter

According to a report by CIT Group Inc. and the California Fashion Association, the fashion industry in Los Angeles generates at least $18 billion in revenue. However, behind the world of mass-produced garments from fast fashion brands like Zara, Forever 21 and Fashion Nova, lies an underbelly of exploited workers receiving less than minimum wage and working in sweatshop conditions.

The minimum wage in the City of Los Angeles is presently $12 or $13.25 an hour, depending on the size of the business. According to the first quarterly report of 2018 of the California Employment Development Department, the hourly median wage of a worker in the garment and textile industry was $11.81. Despite state law mandating that all garment workers must be paid at least the minimum wage, many say that they don’t even get half of the designated amount.

“We are earning like $5 an hour right now, when every year it [the minimum wage] rises up to $12, $13 and so on,” she said. “In L.A, the minimum wage rises every year, but the piece rate never rises.”

According to the piece rate, each garment worker is paid around 70 cents for each “operation” like stitching the sleeves to the main body of a dress or joining the two sides of a shirt. Dewi said the total amount earned by a worker per garment depends on the style, but generally comes to around $2.

Mariella Martinez of the Garment Worker Center said that part of the reason that garment workers receive such low wages is that the big, sometimes multinational, brands that the factories supply refuse to increase their prices. This puts the onus solely on the owners of the factories to pay decent wages. The owners, in turn, are often unwilling to cut into their own profits. They also have to compete with manufacturing plants in Asia or Central or South America where labor is cheaper and labor laws are less stringent.

“If it is $15 an hour [for labor] in the United States and in California, that is a day’s labor in Mexico and two days’ labor in China,” said Ilse Metchek, the president of the California Fashion Association.

The Association, which Metchek said deals with, “the voice of the industry, the business of the business,” was formed in 1995 in the aftermath of the El Monte Slavery Case.

Metchek said that manufacturing has decreased in Los Angeles and will keep on decreasing over the years. The industry however is still huge. In 2016, Business Wire found that wholesalers in the industry added roughly 1500 jobs each year.

In 2016, researchers from UCLA studied the wage claims processed through the Garment Workers Center and found that workers earn an average of $5.15 an hour. Despite state legislation that holds manufacturers liable for wage and hour violations in the garment manufacturing industry, there is also little governmental oversight or enforcement.

Many of the factories operate illegally in garages, sheds, or abandoned properties, making it very difficult for government agencies to monitor them, said Dewi. They also do not provide health benefits, holidays or insurance and workers often have to work in sweatshop conditions.

Dewi has worked in factories where there were no bathroom or lunch breaks and the workers there had to bring their own clean water and toilet paper, she said.

Virgilda Romero, another garment worker, also described working in unsafe and unhygienic conditions.

“I worked at a factory between Broadway and Main streets on Adams where things were really bad…They would make me do a lot of the cleaning. So I would be in charge of cleaning the bathrooms and also like catching killing the rodents and then so I would deal with like rat pee falling on me and things like that,” said Romero. “I wouldn’t work sometimes on Sundays and they would leave the trash over, so there would be like maggots in the trash.”

Virgilda Romero at the Garment Worker Center

Romero arrived in the United States from Guatemala in 2001. She has worked in the garment manufacturing industry for more than 16 years. The first factory she worked at paid only 5 cents a piece. She has also worked in places where the employers would pressure her to work faster and not allow her to take any breaks. There have been times when she worked for 11 hours a day, Monday through Saturday, and sometimes even on Sundays to earn enough to survive.

Romero said that her present employer was much better and pays her around $470 for six-day weeks. Even then, when she informed her that she would be unable to work for some days due to a surgery, she got very upset and said, “You’re going to miss work again. You better get healthy quick so that you can come back to work as soon as possible.”

“I was very nervous because I’ve been taking these medications that make me have to go to the bathroom a lot because of the surgery and I was, you know, kind of scared the whole time that she would get angry for taking so many restroom breaks,” said Romero.

According to the California Bureau of Labor Statistics, 71 percent of the garment workers are immigrants, mostly Latinx and Asians. While both Romero now has valid work permit, many of the workers are undocumented immigrants and some are, like Dewi, victims of human trafficking.

The owners of the factories easily take advantage of their workers because they know that they are in precarious positions and will be too scared to go to the authorities to file wage claims or complaints about work conditions, Martinez said. Many are simply not aware that even though they are undocumented, they still enjoy certain rights.

For instance, Dewi did not speak English or Spanish when she first arrived in the United States. She was also not aware that she had certain rights as a victim of human trafficking. She was hiding both from her traffickers and also immigration authorities. She was scared that if she went to the police, they would arrest her for not possessing valid work permits. She did not realize that the garment industry was short-changing her as well.

“When I was working for my traffickers, they only paid me $200 [every 35 days]…and I didn’t get any holidays. In the garment industry, I got like $200 or $150 a week, and I thought it was good,” said Dewi. It was only after lawyers with the Garment Workers Center made her aware of her rights did she realize how low her wages were.

Dewi’s documentation is being processed and she hopes she will soon be able to apply for a green card and bring her son to Los Angeles.

As a member of the Garment Workers’ Center, Dewi often helps them with their campaigns. She said that most importantly the industry needs to abolish the piece rate.

“The first thing we are gonna to do is get minimum wage for the workers and then everything else, step-by-step, said Dewi. “We are gonna ask for health and safety and everything else.”

Retaliatory Tariffs Ramp up Tensions at the Port of Los Angeles

While waiting for hours to get called for a shift outside the dispatch hall at Wilmington, Calif., Rafael Ochoa, a 37-year-old freelance or “casual” longshore worker at the Port of Los Angeles, remained uncertain about the future work volume amid the headline-grabbing trade dispute between China and the U.S.

“It is all about the economy, if the economy f*&%s up, we are not working, that is just how it goes.” Ochoa said. “We are already struggling.”

The neighboring ports of Long Beach and Los Angeles are a key entry point for goods imported to the U.S., with 40 percent of all imports coming through the gateway of San Pedro Bay, Nick Vyas, executive director of the Center for Global Supply Chain Management at the USC Marshall School of Business, said. “We are a huge network entry point of the Asia Pacific, especially stuff coming from China,”

Even though the two countries have reached a truce after the 2018 G-20 summit in Buenos Aires, Argentina, official announcements regarding the timeline and de-escalating plans are yet to be published. Currently, the White House has imposed tariffs on $250 billion worth of Chinese imports – 25% on $50 billion worth and 10% on the rest. To retaliate, Beijing levied tariffs on $60 billion of American goods.

According to the Port of Los Angeles, it handled $284 billion in trade during 2017, while trade with China and Hong Kong accounted for more than half of its total cargo.

As the largest container port in North America, it generates colossal economic activities: 147,000 jobs in Los Angeles, 1.6 million jobs throughout the country, 41 percent of West Coast’s market share, and 18 percent of the national market share, according to statistics published by the port.

If the head-to-head trade confrontation continues, the Port of Los Angeles is expecting to see negative impacts on up to 20 percent of trade values in the fourth quarter, Philip Sanfield, a spokesperson of the port, said.

Besides financial losses to the port, the trade war could result in potential human toll for workers on the waterfront.

After his 12-year journey of being a part-time longshoreman, Ochoa is still far away from earning his chance to be part of the union. By getting three to four shifts on a weekly basis, Ochoa could bring home between $35,000 to $55,000 a year, depending on how much he works and what job he gets. “The pay here is good, plus if you don’t show up they don’t get mad at you.”

However, the everyday wait is horrendously long. “It could be three hours in the morning, three hours at night.” he said. “We have no life outside this, we just have to be here.”

Without the union’s shield, casual workers secure far fewer shifts than full-time workers. Seven days a week, they queue up for a chance to get leftover assignments that are not taken by the union members. “We don’t get to choose, they get to choose,” Ochoa said.

In the face of the ongoing trade-war tensions, Ochoa expressed his frustration over the uncertainty in a profanity-laced response to questions about his future.

Ochoa said the job amount in the upcoming months could be reminiscent of the situation in 2009. He and his colleagues had no choice but to leave the dispatch hall with no jobs when the economy went into a tailspin. “We would show up for three months straight, and finally we took three months to get out once,” he said.

Despite the holistic impact on economic activities on the dock, casual longshoremen would bear the brunt of the tug of war between the U.S. and China as they are at the bottom of the dispatch system. “Definitely all the casuals, but I think some regular will also be affected.” Ochoa said.

Regarding the massive trade with China, the endless uncertainty about the trade war could have huge implications on the entire country, not just Los Angeles.

Vyas said consumers would start to feel the slings and arrows of tariff ramifications in six months. “The cost of goods will be much higher because obviously of the companies continue to produce goods in China, they will get higher taxes.”

However, since tariffs became the hot-button issue for manufacturers and distributors earlier this year, the Port of Los Angeles has experienced some good months compared to 2017.

With Chinese shippers pushing hard to swarm products into the U.S. before the tariffs were in place, the volume of total imports coming through the port rose 2.8 percent and 6.3 percent year-on-year in June and July respectively, port statistics show.

Although import volumes recorded a 0.5 percent year-on-year dip in August following the onset of retaliatory tariffs between the two nations, the numbers jumped 8.3 percent and 26.7 percent in September and October respectively from a year prior, according to the data published by the port.

Vyas does not think the trade volume at the port will be affected under the tariff pressure as Chinese manufacturers are quickly investing and divesting out of China in response to Trump’s trade policy.

“This dispute creates an urgency to open up factories in different parts of the world, and stuff that was made in China is now made in Malaysia. It is very easy for them to create the capacity and start manufacturing.” he said.

While no solutions to the trade disputes are being seen in container shipping companies, Sanfield said negotiable settlement instead of tariffs would be good to global trade, not only for the Los Angeles port.

“I think it is interesting to see who is going to blink first and who is going to say it is time to stop this childish game and adopt discussion on the table and finalize it,” Vyas said. “There will be give and take.”