Californian Magic Is Real – The GDP Says So

In many aspects, California has been seen as a unique case – at times an anomaly, even – of an American state. During the Rio Olympics there were many mentions of how many medals from the American roster belonged to California, and how that number would compare to other competing countries. When it comes to GDP, one can most definitely expect the similar kind of discussion taking place, especially in the current political atmosphere where the intensely progressive and liberal California stands among an overall right-leaning U.S.A..

The above graph shows California’s annual GDP growth since 2000. As the data suggests, California’s economy has remained largely healthy throughout the way, only taking a reasonable hit upon entering the 2008 Financial Crisis. However, as Bloomberg noted, California has seen a surprisingly speedy recovery compared to the rest of the nation, which the news agency accredited to the state’s liberal cultural-political environment, even going as far as saying that California “is the chief reason America is the only developed economy to achieve record GDP growth since the financial crisis of 2008 and ensuing global recession”.

The article attributed California’s “magic” to its left-leaning policies, such as securing a strong labor force through laws favoring immigrants. At a time where the President has been very outspoken against the topic, California strives to do the exact opposite, by exercising its autonomy on a state level. From raising taxes instead of lowering to encouraging companies to globalize rather than discouraging, California is almost a “rebellious child” in the eyes of the federal government. However, this rebellion has proven successful, as California’s real GDP growth maintained an upward momentum since climbing out of the recession until 2015, where it attained 4.4% while the entire country had only seen 2.6% that year.

There is no reason to believe that California would change course from what it has been doing and what has been working under the Trump administration. In fact, the President’s orders would act as the inverse-compass for the Californian economy. Despite having seen a dip in 2016, California does not seem to concern itself with this little hiccup, and from the looks of its policies, the state is set on remaining being that “problem child” in Mr. Trump’s classroom.

U.S. GDP Grew 3%, Fastest Growth since 2012

The U.S. Commerce Department said on Wednesday that the U.S. economy had expanded by 3% in the second quarter (April-June) of the year. It’s not only better than the previous estimate, 2.6%, but also a substantial boost from the first quarter’s 1.2%.


“The acceleration in real GDP in the second quarter primarily reflected upturns in private inventory investment and federal government spending and an acceleration in PCE that were partly offset by downturns in residential fixed investment and state and local government spending and a deceleration in exports,” according to the report. To sum up, consumer spending is basically the backbone of the second quarter GDP growth.

President Trump commented on the growth that he thinks the economy will “go much higher than 3 percent.” Economists and the media, however, are not too optimistic about future growth. In an analysis, the New York Times straight-out called it a “Sisyphean challenge”:

“There are several reasons that his goal is probably far-fetched, namely the country’s aging work force and slower population growth than in the past. Combine that with low productivity growth, and hitting Mr. Trump’s target begins to look like a Sisyphean challenge.”

The impact of Hurricane Harvey is minor, according to a CNBC analysis.

President Trump said on Wednesday, “on a yearly basis, as you know, the last administration during an eight-year period never hit 3%. So we’re really on our way.”

However, he is incorrectly comparing a quarterly growth to an annual growth. In this handy chart by Fortune, we can see clearly that quarterly growth during Obama exceeded 3% eight times.


The Quality of Our Dining Foreshadows the Health of Our Economy

There is an idiom expression in China saying that “hunger breeds discontentment.” It is not hard to understand that people are less likely to spend money on fancy meal and dining environment when the economy is bad. With little money in their pocket, people tend to turn to fast-food or eat at home, and the restaurant business goes down. Thus the Performance of the Restaurant Industry is a significant indicator of the health of our economy.

According to the National Restaurant Association(NRA), Restaurant industry sales constitute 4 percent of the U.S. GDP. The president of NRA Dawn Sweeney said restaurant business also stimulates employment and generates tax revenues. He said, “What’s more, for every dollar spent in restaurants, an additional $2 is generated in sales for other industries, generating even more tax dollars and economic activity.”

RPI Index

The Restaurant Performance Index provided by the National Restaurant Association examines a comprehensive health of the U.S. restaurant industry, including sales, traffic, labor and capital expenditures. If the index value is above 100, it means the American restaurant business is growing during this period of time. An index value below 100 means this business is shrinking.

If we compare this chart to the United States GDP, we could see a general trend that the RPI and GDP have a positive relationship. The higher RPI foreshadows a growing GDP, usually about one year ahead. For example, RPI falled below 100 value after 2007, while American confronted a recession in 2008. While RPI started to recover after 2009, the GDP began to increase after 2010.

American GDP Chart

Stifel analyst Paul Westra and his team believe that “US restaurants are showing signs of heading toward a sector-wide recession.” Restaurant spending is a strong indicator of consumer behaving, which is a large part of American economic growth. It also demonstrates people’s confidence about their money. Stifel’s team said “Restaurants have historically led the market lower during the 3-to-6-month periods prior to the start of the prior three US recessions”. The RPI and GDP charts above has backed up Stifel’s statement.

The RPI Index for 2017 is pretty close to the value of 100. Westra said, “restaurant performance this year, particularly in the second quarter, is shaping up to look pretty similar to the second half of 2000 and the first half of 2007 – the periods that immediately preceded the last two U.S. recessions.” If the history repeats itself, it means 2018 might become the beginning of another U.S. recession period.

At Least You’re Always Ready for a Night Out?

The lipstick index, created by chairman of Estée Lauder Leonard Lauder in 2011, is the theory that consumers are ready to indulge in cheaper—yet still satisfying—purchases like lipsticks over expensive items like designer bags in rough economic times such as the recession, according to U.S. News.

Lauder “hypothesized that lipstick purchases are a way to gauge the economy. When it’s shaky, he said, sales increase as women boost their mood with inexpensive lipstick purchases instead of $500 slingbacks” (qtd. in New York Times).

In other words, when the economy is low, people are stressed or depressed and what is one way we reduce or momentarily solve that problem? Shopping—but we can’t splurge and treat ourselves with overpriced items so we resolve to the little things in life like a new set of lipsticks.

Although “[this] theory has been debunked many times,” according to Forbes, personally, it is very simple: our morale may be low but at least we look great.

Not to mention, lipstick are not “inferior goods,” as said by the New York Times. In fact, they’re a luxury item that boosts one’s confidence—I don’t think of it as second choice to, for example, a pair of $300 shoes I would have bought instead, but as a deserving little bonus gift for myself that provides me a different kind of happiness. An example of an inferior good would be choosing Taco Bell over having dinner at my favorite taqueria, Gordos, because I should be saving the money.

Sarah Hill and four other researchers studied Lauder’s theory, which was published in the Journal of Personality and Social Psychology, “[confirming] that the lipstick effect is not only real, but deeply rooted in women’s mating psychology” (Scientific American). Hill explains that in a time of economic instability where unemployment rates are high, women want to look their best to attract the financially stable opposite sex who is scarce during recession.

But lipstick sales have been declining since 2007 while sale polish “are up since the first half of 2008,” according to market research firm Mintel (qtd. in Times). Lauder responds that “[nail] polish] is the new lipstick” in Times, and once again reiterates his lipstick index as an idea on the significance of succumbing to smaller luxury items like beauty products, regardless of what it is, during hard financial times.

Retail is Dying –– What does that mean for employment?

It is no surprise that retail is taking a heavy hit in 2017 with some of the most well-known and largest retail companies closing their doors to the public, or worse, filing for bankruptcy. With the up-roar of e-commerce, consumers choose to shop online for the quick satisfaction of the click of a button instead of making their way through traffic, parking, and rushing through people in an over-sized mall.

The CEO of Urban Outfitters, Richard Hayne described this issue in accordance with the housing market when he said, “Retail square feet per capita in the United States is more than six times that of Europe or Japan. And this doesn’t count digital commerce. Our industry, not unlike the housing industry, saw too much square footage capacity added in the 1990s and early 2000s. Thousands of new doors opened and rents soared. This created a bubble, and, like housing, that bubble has now burst. We are seeing the results: doors shuttering and rents retreating.”

So, what does a massive hit in retail mean for jobs? Unsurprisingly, retailers have publicly announced over 200,000 lay-offs in the last four years and a growing 89,000 in 2017 alone. According to Business Insider, stores are closing at a rate not seen since the recession. When looking at the data, there is an interesting story being told. This chart shows that both traditional and online retail are soaring since the Recession. However, when diving deeper into particular industries is when we see a hit in job loss.

This chart shows the decline of employment from appliance and electronic stores which were a huge industry to shut their doors to the public.

And then we have, of course, the struggling clothing and retail market chart that shows the loss of employment in the last few years.

With no surprise, e-commerce has soared in the last couple of years, but are they hiring those transitioning out of traditional retail positions? Probably not. While the retail industry is known for high turnover rates it is also known for hiring 1 out of 10 American workers within a large age range. That said, most of these workers being laid off do not hold the set of skills that an e-commerce job would entail.

So, is this weird retail hit of 2017 an economic indicator of what the future of the economy holds? Well, according to Mark Cohen, the Director of Retail Studies at Columbia University, the huge hit that retail continues to take is creating a “slow-rolling crisis.” The large amount of people that have lost their retail position and will continue to lose it (considering the way retail is going) are now going to spend less money since they are going through a period of unemployment which will create a “cascade of economic challenges,” says Cohen.

It will be interesting to continue to see the trajectory of retail, but right now it is looking like the start of a very interesting and slow rolling economic indicator. Would it be too big to say that we could be on the path towards another economic recession?

Sources:

http://www.businessinsider.com/retail-job-losses-are-hurting-the-economy-2017-4

https://psmag.com/news/the-long-and-painful-decline-of-the-retail-store

https://www.theatlantic.com/business/archive/2017/04/retail-meltdown-of-2017/522384/

In times of economic despair, romance is in the air?

Could having a successful love life also be attributed to economic downturn? The New York Times reported that Match.com reached more dating app first dates are initiated when market sentiments are low.

With the advent of online based dating sites, a swath of analytics are available to derive sociological meaning from. Match.com’s data shows strong correlations of ambitious first dates right around the time the economy tanks.

Despite sky-rocked unemployment rates, foreclosures, and failing businesses in the thick of the 2008 recession, Match.com saw their fall quarter as their busiest period in seven years (since post 9/11 woes). Even with monthly fees of $60, eHarmony.com reported a 20% increase in membership, and OkCupid saw a 50% increase in activity. Misery loves company, and with the increasing distrust in financial institutions, many looked for stability in romantic partnerships. In fact, Match.com and eHarmony.com logged some of their highest traffic volumes on days when the Dow Jones took a nose dive.

Tighter personal budgets prompt less discretionary spending, which includes small luxuries such as going out for drinks, where people typically meet with the goal of finding romantic prospects. Singles no longer need to spend money buying a potential partner drinks when first meeting them. Neurologists also say that good first dates release brain chemicals that can ease worries in other spheres of one’s life (e.g. layoffs, plummeting stocks, etc.)

In the long run, finding a partner and splitting bills is cost effective. In tough times, the idea of sharing bank accounts and receiving tax benefits incentivizes the subconscious desire for marriage.

Should hopeless romantics look forward to a dip in the market for better chances of finding love? While the choice between financial stability and love is certainly not a zero-sum game, the data doesn’t lie in times of economic woes bringing together more singles. Akin to the unemployment rate, perhaps it is worth looking at the spikes and drops in singles actively pursuing relationships.


References:

http://www.businessinsider.com/bizarre-economic-indicators-2012-8#the-first-date-indicator-18

http://www.cnn.com/2009/LIVING/personal/02/25/tf.online.dating.recession/

http://www.chicagotribune.com/sns-onlinedating-doingwell-story.html

http://www.sandiegouniontribune.com/sdut-us-downturn-dating-070409-2009jul04-story.html


Higher Heels = Worse Economy?

From lipstick to ties, people have long considered fashion items as indicators for the economic climate. According to researchers at IBM, the height of high heels is another economic indicator that has a correlation to economic health.

A team of researchers at IBM led by consumer product expert Trevor Davis used social media sites and blog posts to find that the popularity of flats and low-heeled shoes is a possible sign that the economy is growing, whereas higher heels indicate the opposite. According to an IBM report, low-heeled flapper shoes in the 1920s were replaced with high-heel pumps and platforms during the Great Depression. Although low-heeled sandals were big in the late 1960s, platforms came back again during the 1970s oil crisis. More recently, the median height of women’s heels peaked at seven inches in 2009 during the recession, and then dropped to two inches by 2011 as the economy recovers.

Davis suggests that the reason women turn to higher heels during economic downturns is that more flamboyant fashions serve as a means to escape the harsh reality. There are, of course, other possible explanations for women’s preference of lower heel heights. Women may simply be embracing a more pain-free walking experience, or the natural cycle of fashion trends sometimes happens to coincide with the economic cycle. However, there is still a great possibility that low heels may actually indicate longer-term economic.

Your Economy Is What You Eat

Within the United States’ precarious political environment, many Americans live in fear that the economy will dip into a deep recession like that of the housing crisis, which occurred not even a decade ago. These nerves are rational, as our market economy is cyclical. Periods of growth have always inevitably been met with periods of recession.

Economic indicators can help us to analyze the economy. Studying trends in retail sales, unemployment, etc. can help us make educated guesses as to where the economy is and where it is going. An interesting economic indicator we can use to analyze these trends is restaurant sales.

In an economy with contracting growth, individuals and families may feel their first inklings of strain in terms of food. In an unhealthy economy, the dollar might be devalued and workers may be laid off, which would lead to a decrease in consumption, which accounts for almost two thirds of the U.S.’s GDP. Consumption measures what is spent on goods and services produced in the United States. Even though it is only a portion of a nation’s GDP, consumption can be used to help predict the future of an economy, especially in a country like America because its consumption is relatively high in comparison with other economic variables.

If an economy is shrinking, one of the first areas of decline is restaurant sales. Economically strained Americans first tighten their finances by refraining from eating out. Food as a commodity is a short-lived luxury, since after you eat it, it’s gone for good. Therefore, food, especially going out to eat, is one of the first areas in which people start to cut back when trying to save money. Declining restaurant sales are an indicator that economic growth is slowing.

Within slowing or flat restaurant sales reports is a hierarchy. The first types of restaurants to feel decreases in sales are full-service, sit-down restaurants. They’re the first to go for individuals trying to save because they are the most draining of important resources, e.g. time and money. Next comes fast casual restaurants, whose sales’ declines mean that there is much more financial strain amongst a nation’s citizens, leading financial experts to turn decidedly bearish on them. Decisions like these lead to less valuable restaurant stocks.

However, not all trends in restaurant sales decline when Americans are nervous about the economy. An example of an outlier is pizza. As Bloomberg reports, in June of 2016, restaurant sales were flat, the lowest growth in sales since 2013. In contrast, Domino’s continued growing, with sales toping 5% for Q2 2014 – Q2 2016. Bloomberg Intelligence Analyst Michael Halen explains that Pizza does well in recessions due to its value proposition–moneymakers feel frugal spending $7.99 on a large pizza to feed their families.

Many other aspects of food can be economic indicators. Increases in grocery store sales indicate that more people are eating in and thus trying to save money. And similar to pizza shops, fast-food chains tend to do well during recession due to consumers’ value propositions. Hugo Lindgren of New York magazine went so far as to publish the “Hot Waitress Economic Index” explaining that during slow, flat, or declining economic growth, restaurant servers are more attractive, assuming that attractive people tend to find higher-paying work during good economic times.

Economic indicators are measurements collected to assist in hypothesizing the future of the economy. They are useful only with supportive data and examined in long-term contexts. Some indicators are estimated by governmental organizations or professional private companies. However, some are more suitable for normal citizens, like pizza.

Other sources: Eater Wall Street Journal Forbes 


Housing Vacancy Rates

The economic indicator of housing vacancies and homeownership delves into the overall status of homeowners and renters, particularly the vacant rates. Rental and homeowner vacancy rates are obtainable for U.S. regions, states and for the 75 largest Metropolitan Statistical Areas (MSAs), and information about geographies are accessible both quarterly and annually, according to census.gov.

The real question is, how do we decipher these rates in the short term (the past few years) and in the long term (a decade or longer)? What does an understanding of these rates tell us about housing issues in the United States?

As of July 27, 2017, the rental vacancy rate was 7.3 percent, and the homeowner vacancy rate was 1.5 percent. These numbers have noticeably improved (decreased) since 2010. In fact, from 1995 to 2017, the rental vacancy rate hit its highest number in 2010, a 10.23 percent average in all four quarters. The homeowner vacancy rate was usually around 1.5 percent over that time span, but it obviously rose when the U.S. economy entered a recession in late 2007 and spiked close to 3 percent.

Since 1995, the rental and homeowner vacancy rates are able to stay more or less intact even though the median asking rent has continuously increased, while the median asking sales price for vacant houses can increase and decrease in somewhat of a cyclical fashion, falling when the prices get too high and outweigh demand. Via information from the United States Census Bureau, the median asking sales prices for vacant units climbed up to around $200,000 but began a steep decline once the 2007 recession arrived.

After leveling out for a few years, the median asking sales price has begun the upward trend again and, measured at $177,200 in the second quarter of 2017, is on pace to eclipse $200,000. Rental and homeowner vacancy rates can continue to stay low, but if the numbers compiled on the graphs of recent years tell us something, it’s that troughs follow peaks, even if skyrocketing prices and lower unemployment rates make the economy seem like it’s booming.

Rental and homeowner vacancy rates help describe important characteristics which define value in a marketplace: supply and demand. If more and more people are buying and renting houses, you’d expect the vacancy rates to be lower. In this case, the supply of housing is getting less and less, and the demand for housing is likely higher. Therefore, rental and home sales prices should increase, making the housing market unkind to a significant portion of regular people.

“The irony of the modern housing market is that the places where we are seeing wage growth are places where people can’t live because they are too un-affordable,” said Nela Richardson, chief economist at real estate brokerage Redfin, per Forbes.

Now, economists must deal with the possibility of housing prices becoming overinflated, as they hope for the market to stay stable over the next decade or two.

Social Media & the Economy

There are billions of social media users around the world, as this number continues to increase. In 2017, almost everything is, or can be, done over the Internet; whether it is wishing your cousin in Australia a Happy Birthday, spreading awareness about your lost dog, researching about why your stomach may be hurting, or even exposing your knowledge and credibility in your craft.

Most importantly, social media has played a huge role in revolutionizing the way businesses operate. Brands are now able to expose themselves right in front of your eyes no matter where you are.

You can be in bed, scrolling through your Facebook timeline, and potentially come across an advertisement that sparks your interest. After about 4 clicks, you can purchase that product and have it arrive at your doorstep as soon as the next day. More importantly, you just generated business for that company while you were in bed.

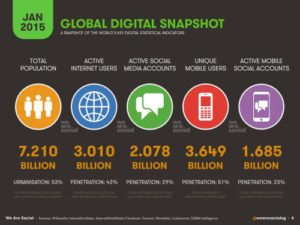
Businesses are able to use social media to learn more about themselves. Reviews, feedback, and consumer research has never been easier, allowing businesses to spend less money on what is not working and pump more money into what is. This is so important for businesses to pay attention to and utilize, because it is something that can potentially take your company to the next level.

This magical ability through the use of social media has sparked a new wave in the economy. Entrepreneurship is at its highest peak of popularity, because now you can legitimately operate your business from your living room – all you need is a laptop.

This has even impacted the decrease of the unemployment rate. The word “unemployment” has lost a lot of its weight, partially due to the easily accessible online market places; where you can buy and sell almost any item to make money.

“Freelancers” have also gained tremendous popularity with the rise of social media. Let’s say you had enough of your boss so you quit your job, but you haven’t found a job yet, or you recently got laid off and are in the middle of a job hunt: During this time, you can now list your skills and experiences online and find contract jobs to work on for money until you find another job. This may even work out better for you, and the autonomy could be the cherry on top!

Social media has really disrupted the economy – for the better. There is so much opportunity in the world, and the Internet has literally placed it right in front of your eyes.


References:

http://ageconsearch.umn.edu/bitstream/162500/2/SAEA%20Econ%20Impacts%20Paper%202014%20Submitted.pdf

https://www.theatlantic.com/technology/archive/2010/10/is-social-media-driving-the-economy/64780/

https://www.forbes.com/forbes/welcome/?toURL=https://www.forbes.com/sites/quora/2017/08/02/how-does-social-media-influence-the-economy/&refURL=https://www.google.com/&referrer=https://www.google.com/