Typically, when a city’s economy is performing well, it’s population will grow. A strong economy full of expanding, competitive businesses sparks an increase in job opportunities. This, in turn, leads to the construction of new office and apartment buildings. While this simplified chain of events seems rather self-explanatory, analyzing the volume of construction on a local and national level is a sufficient method of understanding the current state of the economy. In other words, looking at the number of issued building permits can provide a benchmark for just how confident businesses and consumers are feeling. In turn, it provides a useful gauge of how well our economy is performing.
By definition, building permits are a form of approval issued by either the government or a regulatory body before the construction of buildings are legally permitted to commence. Data pertaining to building permits is collected on a monthly basis and is published by the U.S. Census Bureau. This data is collected nationally and broken down by region, state, metropolitan area and county. The data is published on the 18th of every month.
A look at commercial building permits often signals that businesses are expanding and new ones are forming. Additionally, an increase in permits for warehouse space indicates that commerce, in the coming years, will most likely improve.
Where commercial building permits indicate the current state of businesses, residential building permits are indicative of behavior and sentiments on a consumer level. For example, a rise in single family homes can indicate that residents have reached a level of economic agency where they feel comfortable enough settling down and moving into more spacious, permanent accommodations.
Because building permits are not mandatory in all regions of the U.S., the number of building permits is typically fewer than the number of housing starts. Examples of construction and remodeling projects that typically do not require a building permit include: repainting a house, building small fences, repaving driveways and refurbishing kitchen appliances.
When more building permits are granted, this means that more money will be allocated towards housing, and thus the number of housing starts will increase. However, if housing starts begin to drop in comparison to building permits, this means that construction may be postponed in accordance to environmental or economic conditions
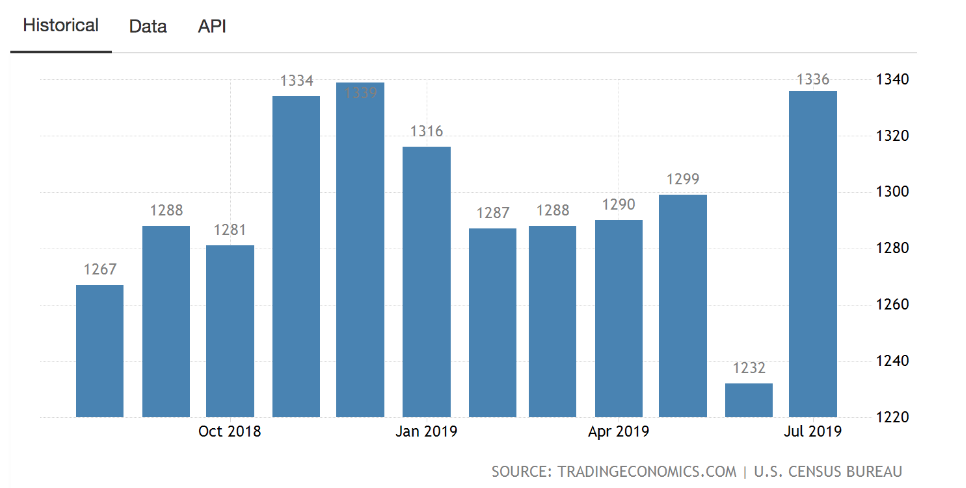
So where does the activity of building permits stand today? This past July, building permits in the U.S. increased by 8.4% (See graph above). This surpassed the market expectation of 3.1%. This growth in building permits is the steepest gain the U.S. has seen since June 2017. When broken down by region, it reveals that this growth was felt most prominently in the West and the South. Overall, building permits totaled an average of 1.33 million for July 2019. So far, December, which reached 1.3 million permits, has been the high of 2019.
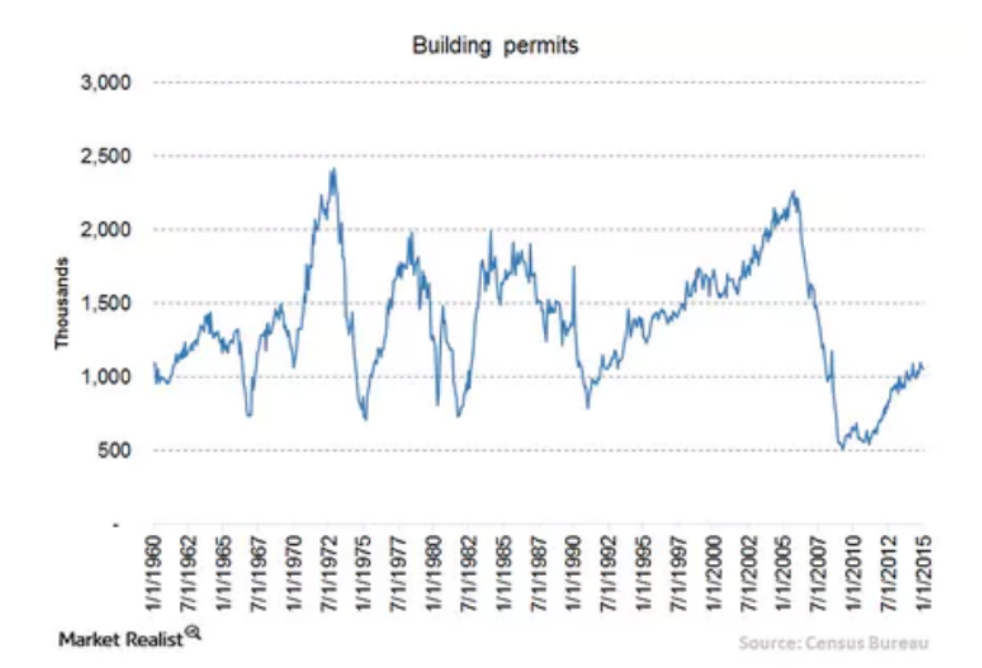
In 2005, when the U.S. economy was at one of its best moments, building permits almost surpassed the record high of 2.41 million in December of 1972 (See graph below). However, leading up to the 2008 recession, the number of building permits plummeted. As demonstrated by the data for June 2019, they have since recovered and are currently climbing. As an economic recession looms in the future for the U.S., building permits will be a key indicator to watch in the near future.
Sources:
http://www.incontext.indiana.edu/2001/april01/details.asp
https://tradingeconomics.com/united-states/building-permits
https://marketrealist.com/2015/02/understanding-building-permits-impact-homebuilders/