Nailed it: Can nail polish be the new lipstick index?

What has a) a million colors, b) a oft-ridiculous punny name, c) the capacity to survive a nuclear apocalypse on your toes but chips off in two days on your hands, and d) the ability to serve as an economic indicator? 

Nail polish.

OPI Planks A Lot Nail Polish
OPI “Planks A Lot” nail polish / Courtesy of The Fingernail Files

In the first ten months of 2011, less than five years after the Great Recession started, nail polish and product sales were 59% higher than in the same period a year ago, according to NPD Group, a market research firm. 

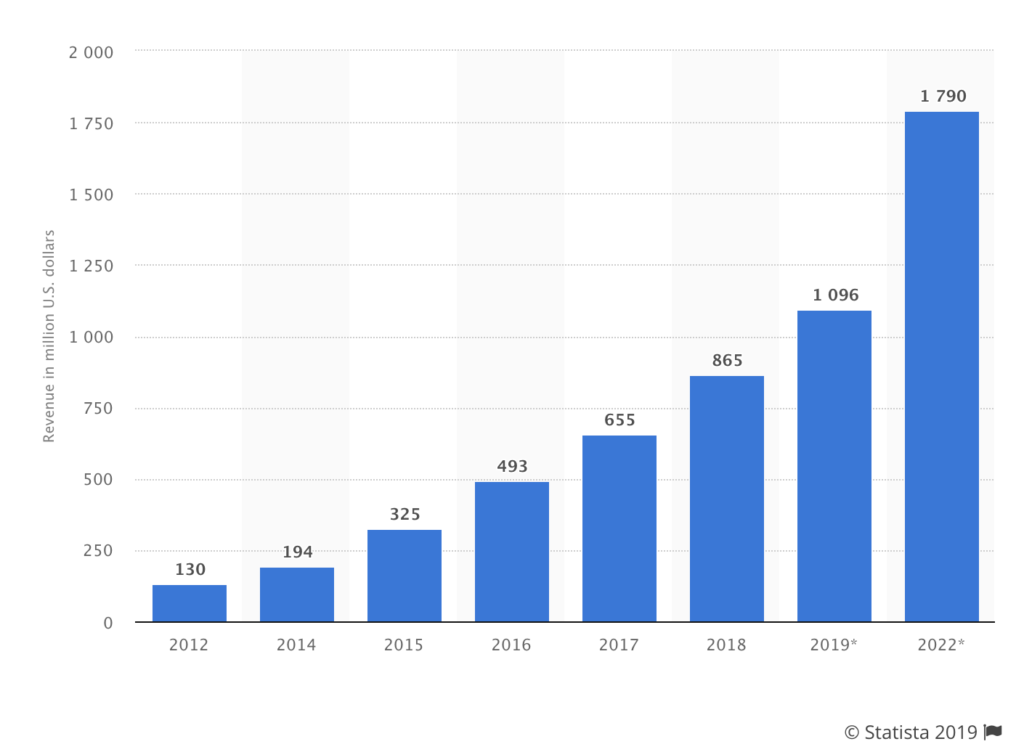
Adam Davidson, an economic journalist and co-founder of NPR’s Planet Money, wrote in a 2011 New York Times column that a “rise in nail polish sales indicates that we’re searching for bargain luxuries as the economy craters – and sales of nail polish are way up right now.” High nail polish sales = good times are a’coming. A 2017 study of the global nail polish market showed that the industry is projected to reach $15.5 billion in 2024. One factor in the projected growth is the popularity of nail designs in youth populations, as well as the popularity of nail polish products in international fashion capitals, such as Paris, London and Milan. 

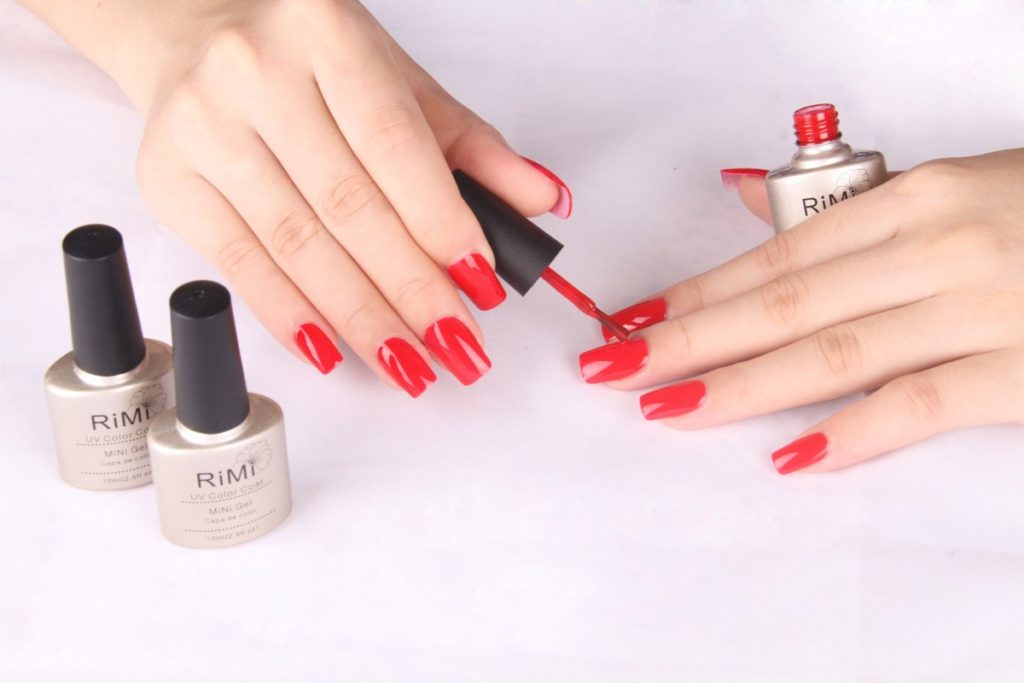
A key finding in the 2017 report is the increase of projected increase of gel polish. More expensive than the traditional “liquid” nail polish, gel is advertised to offer up to three weeks without cracking or chipping and faster drying time with the use of L.E.D. light. The high popularity of gel polish could be due to a variety of reasons, including a demand for longer lasting nail products. Consumers might be willing to pay more for what can read like a bionic manicure, but because of the durability of gel nails, may be spending less time at salons

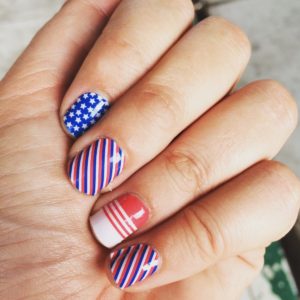
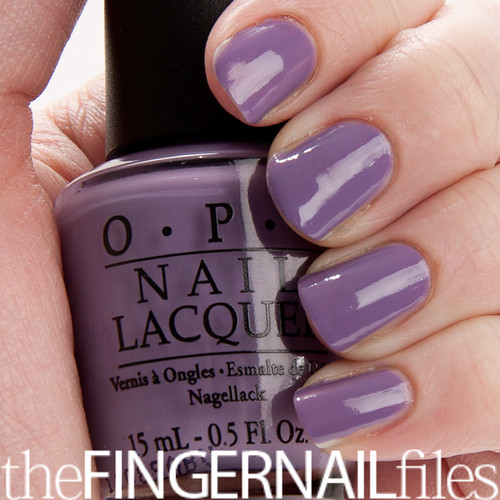
Economics is part psychology, as the recession-proofness of nail polish shows. A small pleasure, nail polish can be affordable (sometimes less than a dollar). Coming in a variety of colors from deep burgundies and plums to neon yellow, as well as a variety of textures (hello 2012’s “crackle” nail polish trend), nail polish is visually appealing, and for people that choose to forgo the luxury of a nail salon, painting your nails can be a relaxing, almost therapeutic activity. 

The Great Recession seems to have catapulted nail polish to the recession-proof big leagues – in 2011, TIME named it one of the “12 things we buy in a bad economy,” a list that also featured romance novels, donuts, chocolate and condoms. Good company? 

Nail polish appears to have pushed out lipstick as the recession-proof cosmetic. Termed the “lipstick index” by Leonard Lauder, chairman emeritus of Esteé Lauder, lipstick sales used to soar during not-so-great economic terms. Like nail polish, lipstick is a quick, colorful pick-me-up – (sometimes) affordable glamor in a tube. However, lipstick sales fell in 2010

After the lipstick index’s accuracy was called into question during the Great Recession, Lauder expanded on his original definition, claiming it was never about just lipstick.

“We have long observed the concept of small luxuries, things that can get you through the hard times and the good ones. And they become more important during harder times. The biggest surge in movie attendance came during the 1930s during the Depression.”

Leonard Lauder, chairman emeritus of Esteé Lauder.

Although nail polish may not be as important an economic indicator, per se, as the GDP or unemployment, OPI’s puke-green “Uh-Oh Roll the Windows Down” demonstrates that even in times of frugality, people are still willing to spend on little luxuries.

SOURCES

The Interest Rate in Ukraine Pays Close Attention to Economic Indicators

In 2014, Ukraine underwent a revolution ousting a Russian puppet-president which sent the country into complete chaos both economically and politically. Following the revolution Russia annexed Crimea and full-on warfare broke out on the eastern border of Ukraine killing thousands of people. The economy shrank dramatically, prices went up, and given the unstable state of the economy, investments stopped flowing into the country. The interest rates set by the National Bank of Ukraine skyrocketed immediately. This interest rate is what’s called the federal funds rate in the United States. It is the interest rate set by the central bank that tells commercial banks how much interest they should charge when making loans to each other. What can the interest rate tell us about the economy and why should you as a citizen of Ukraine or foreign investor care about it? The answer is simple: what banks charge each other sets the interest rate at which they pay or charge you! The central bank’s interest rate is one of the most important factors that sheds light on the economic indicators reflecting the current and expected economic health of a country.

Take a look at this chart:

Image from tradingeconomics.com

This chart shows the interest rate set by the National Bank of Ukraine in a 10-year period. There are a couple of conclusions we can make from observing the chart. The most noticeable one is that Ukraine’s economy is incredibly unstable. That is true and, in fact, the prime reason for a spike in interest rate starting in 2014 is high inflation.

Now, take a look at the following inflation chart:

At its highest peak, inflation reached more than 60%. In order to offset the increasing inflation, the National Bank of Ukraine set its interest rate at 30% during the same time period. Since then the rate has gradually subsided to 16.5% and inflation went down to 8.8% as of this writing. As soon as the economic indicators started showing signs of recovery: inflation decreased, and GDP increased from $91 billion in 2015 to $130 billion in 2019 it made sense to lower the interest rate. However, the interest rates are still high, especially compared to those of the U.S. which recently lowered its federal funds rate to a target rate of 1.75% – 2%. The underlining explanation might not be obvious but part of the reason for keeping interest rates high is to lure foreign investments to finance the government’s debt and to rebuild Ukraine’s economy amidst the war and political pressure. Here’s what Ukraine’s short-term government bond yield looks like:

Image from www.worldgovernmentbonds.com
Data as of September 23rd, 2019

These percentages are unbelievably high. According to CNBC, the investors’: “holdings of domestic bonds have jumped nearly 10-fold since the start of the year, to 61.6 billion hryvnias ($2.4 billion).” If you are an investor searching for a high yield investment this is the time and place to invest.

Unfortunately, the Ukrainian side of the interest rate story isn’t nearly covered as extensively as the story of the Fed’s rate cut. Nonetheless, it is still worth examining the economic indicators and search for possible connections to the interest rates.

Sources:

https://tradingeconomics.com/ukraine/interest-rate

https://tradingeconomics.com/ukraine/gdp

https://tradingeconomics.com/ukraine/inflation-cpi

https://www.cnbc.com/2019/07/08/reuters-america-poll-analysts-split-on-ukraine-interest-rate-decision-in-july.html

http://www.worldgovernmentbonds.com/country/ukraine/

Men’s underwear may tell you how the economy is doing

Photo credit to Global Times

A rise in men’s underwear sales might be part of the signal that the Liaoning Province in northeast China’s is on the path to recovery.

The economic growth of Liaoning Province was 4.2 percent in 2017 and 5.6 percent in 2018. At the same time, according to a report released by JD Big Data Research Institute, part of one of China’s biggest online shopping sites, sales of men’s underwear in Liaoning rose 42 percent in 2017 over the previous year and went to another 32 percent in 2018. The rate of increase in underwear sales in Liaoning was greater than in any other province. An analysis of consumption also shows that Liaoning’s consumers pay more attention to the quality and color variety of clothes.

“The recovery is mainly due to coal and steel prices rising during the period, and the recovery can also be seen in the volume of railway and road freight, electricity consumption of industry, volume of business and employment,” said Liang Qidong, vice president of the Liaoning Academy of Social Sciences, on a Global Times report.

Liang also addressed that the Men’s Underwear Index and similar indexes like “yogurt index” and “bread index” could be taken as an economic indicator.

Liang was not the first person to come up with the concept. Back in the 1970s, Alan Greenspan, the former chairman of the Federal Reserve, first introduced and popularized the Underwear Index. Greenspan found that there was a close connection between the economy’s performance and the sales of men’s underwear. Declines in the sales indicate a weak economy, while upswings predict a recovery in the economy. Behind the theory, a basic assumption is that men’s underwear is a necessity instead of a luxury item, so sales of men’s underwear will keep relatively stable except in times of a sluggish economy. Therefore, men’s purchasing habits for underwear is thought to be an effective economic indicator that can detect the beginning of a recovery during an economic downturn.

The sales of men’s underwear dropped in an economic recession in the United States. Data show a 2.3 percent drop in sales of entire men’s underwear products in 2009, according to Mintel, a London-based market research firm. While as the economy recovers, sales of men’s underwear in the United States have risen. As reported by Quartz, U.S. underwear sales grew by nearly $1.1 billion between 2009 and 2015, after falling in the wake of the 2008 financial crisis. Hanes, a popular lingerie brand, has seen a similar trend.

“If you look at sales of male underpants it’s just pretty much a flat line, it hardly ever changes,” economist Robert Krulwich told HuffPost in an article after the publishing of Greenspan’s book, “The Age Of Turbulence.” “But on those few occasions where it dips that means that men are so pinched that they are deciding not to replace underpants. And [Greenspan] said ‘that is almost always a prescient, forward impression that here comes trouble.’”

However, the concept may be not academically accurate, even though the Underwear Index can be used to reflect the economic situation from a province to a nation. Several reasons presented by critics on Investopedia should be considered, including the frequency of women purchasing underwear for men, and an assumption that men would not purchase new underwear until it is threadbare, regardless of the economic condition.

The Juiciest Economic Indicator

For the average person, economic indicators can be difficult to read. How can one look at the statistics released by Trading Economics and understand how the price of palm oil can affect his or her life?

In searching for a method of explanation for non-academics, I came across interesting publications. Business Insider detailed many unusual indicators, including “The First Date Indicator” and the “Plastic Surgery Indicator.” These seemed quite obvious to me. In tough times, individuals try to combat their loneliness and turn to dating. In times of prosperity and confidence, people allow themselves to splurge on plastic surgery. 

But one stood out among the rest and urged me to research further: The Big Mac Index created by The Economist. It was meatier than the rest, an asset that economists could actually utilize in their projections. It gives the common person an idea of how their currency holds up against the rest.

Essentially, this index looks at the global prices of McDonald’s Big Macs and compares them. It’s based on the Purchasing Power Parity (PPP) theory that a basket of goods should eventually cost the same in various countries. The values of these goods can indicate the exchange rates for currencies.

https://www.economist.com/news/2019/07/10/the-big-mac-index

By looking at Big Mac prices, one may be able to elucidate the status of an economy and possible under or overvaluations. While this index is not precise, it can provide some interesting data.

Where it Falls Short

Naturally, prices will be lower in poorer countries, as labor is cheaper. Additionally, places like India have dietary restrictions that would prevent a Big Mac from performing well. The model uses a poultry version of this product so that India can be included in the index, but it isn’t the same. Israel provides kosher beef, while Islamic countries provide halal beef, both of which would affect price and production.

Moreover, some places consider McDonalds a western novelty, while others see it in a more casual light. Because of this, McDonald’s creates different marketing strategies for different countries. They may push harder with a more effective approach in the U.S. than in Sri Lanka. Overall, while McDonald’s is a single corporation, it can have a very different meaning between nations.

How it Surpasses Expectations

When the Economist first created this index, it was meant to be more amusing than reliable. What began as a fun tool to judge misalignments between currencies started to be taken seriously. In response, The Economist added an adjustment of GDP per person, making it more accurate. 

https://www.economist.com/news/2019/07/10/the-big-mac-index

It is now referenced to explain PPP in academic articles and textbooks, according to The Economist. One researcher, Li Lian Ong, went as far as to say that he believed the Big Mac Index could have been used to predict the Asian currency crisis. While seemingly trivial, this indicator makes a great deal of sense. One can study the movement of exchange rates in the long run, while also studying their currency’s purchasing power in other countries. 

What it Tells Us Today

The Big Mac Index was created in 1986 and has since fizzled out. Most of the information on it comes from the early 2000’s and stops around 2011. Despite this, current data is still available.

The table to the right is the data reported by The Economist in July of 2018. The Key Takeaways are:

  • Cheap currencies are inching closer to the dollar.
  • Only three countries have higher priced Big Macs than the U.S. (Switzerland, Norway, and Sweden).
  • The Euro is undervalued, but considerably less than before.

Over & Underevaluations

https://www.economist.com/graphic-detail/2019/01/12/the-big-mac-index-shows-currencies-are-very-cheap-against-the-dollar

The above graphic illustrates that almost all currencies are undervalued when compared to the dollar, specifically countries with emerging economies. This makes the dollar seem very robust. But checking statistics dating back to the birth of the Big Mac Index in 1986, undervalued currencies typically grow within a ten year period.

Like all economic indicators, the Big Mac Index cannot accurately tell us what will happen in the coming years. It allows us to study the past, present, and potential futures. Some people are its biggest allies, while others are its biggest critics. Personally, I know it isn’t the most telling or reliable indicator, but I think it’s a delicious way to digest economic data.

Sources

  1. “Beefed-up Burgernomics.” The Economist, The Economist Newspaper, 30 July 2011, www.economist.com/finance-and-economics/2011/07/30/beefed-up-burgernomics.
  2. “The Big Mac Index Shows Currencies Are Very Cheap against the Dollar.” The Economist, The Economist Newspaper, 12 Jan. 2019, www.economist.com/graphic-detail/2019/01/12/the-big-mac-index-shows-currencies-are-very-cheap-against-the-dollar.
  3. “The Big Mac Index.” The Economist, The Economist Newspaper, 10 July 2019, www.economist.com/news/2019/07/10/the-big-mac-index.
  4. Boesler, Matthew. “The 41 Most Unusual Economic Indicators.” Business Insider, Business Insider, 11 Oct. 2013, www.businessinsider.com/unusual-economic-indicators-2013-10.
  5. Ong, L.I.. (2003). The Big Mac index: Applications of purchasing power parity. 10.1057/9780230512412. 
  6. “Our Big Mac Index Shows Fundamentals Now Matter More in Currency Markets.” The Economist, The Economist Newspaper, 20 Jan. 2018, www.economist.com/finance-and-economics/2018/01/20/our-big-mac-index-shows-fundamentals-now-matter-more-in-currency-markets.
  7. Pakko, Michael R., and Patricia S. Pollard. Burgernomics: A Big Mac Guide to Purchasing Power Parity. Nov. 2003, files.stlouisfed.org/files/htdocs/publications/review/03/11/pakko.pdf.


21st Century: Internet Speed as an Economic Indicator

The Internet’s impact on global growth is rising rapidly. The Internet accounted for 21 percent of GDP growth over the last five years among the developed countries MGI studied, a sharp acceleration from the 10 percent contribution over 15 years.
(McKinsey Analysis)

The next time you are in a public place take a look around you. Nine out of ten people you see have just recently been on the internet. And among young adults ninety-nine out of every one hundred have recently been online. The internet has changed our lives in the way that we are able to do work, exchange and discover new ideas, socialize, and communicate with one another. However, it is not often that we think about the significance of this transformation in economics and how it can be used to measure economic growth. 

Individuals from large enterprises, individual consumers, and small up and coming entrepreneurs all benefit from the enormous opportunities the internet has created such as building a competitive environment, boosting infrastructure and access, providing purchasing power, as well as nurturing human capital. In harmony these components have maximized economic growth and prosperity. 

If internet were a sector, it would have a greater weight in GDP than agriculture or energy. (McKinsey Analysis)

If measured as a sector of the GDP, internet related consumption and expenditures, would be larger than the agriculture and energy sectors. In the McKinsey Global Institute study on broadband internet and economic growth and prosperity, internet accounted for 3.4% of the GDP in the 13 nations researched.  

Internet speed can be used as an economic indicator because it correlates with a given countries internet contribution of GDP. Countries with a strong internet supply in terms of speed and broadband connectivity strength correlate with a higher internet contribution to GDP. For example, Sweden and The United States have the best “internet ecosystems” in the world and this correlates with their internet contribution to GDP. Which is respectively 3.9% in Sweden and 4.7 % in the United States. The average internet connection speed in Sweden is 22.5 Mb/s and 18.7 Mb/s in the United States. When compared to Germany which has a lower average connection of 15.3 Mb/s, internet related expenditures only account for 1.9% of the Germany’s GDP.  

Internet Contribution to GDP (McKinsey Analysis)

However, it is important to highlight that in most studies on developed nations it is noted that this positive correlation of broadband strength and economic growth reaches a threshold and other economic indicators should be used in conjunction when accessing economic growth. 

Sources:

https://www.statista.com/topics/2237/internet-usage-in-the-united-states/

https://www.businessinsider.com/mckinsey-report-internet-economy-2011-5

https://en.wikipedia.org/wiki/List_of_countries_by_Internet_connection_speeds

https://www.mckinsey.com/~/media/McKinsey/Business%20Functions/McKinsey%20Digital/Our%20Insights/Essays%20in%20digital%20transformation/MGI_Internet_matters_essays_in_digital_transformation.ashx

What does the bombing growth of eSports tell us

ESports, standing for “electronic sports,” are a form of online competition using video games. The first eSports competition was held at Stanford University in 1972, when players were invited to compete in a game called Spacewar. Since then, eSports industry has developed together with the surge of internet access and video game technologies. However, it has not become full-fledged until recent years. 

Visitors cheer for international teams during the tournament of the computer game ‘League of Legends’ on May 8, 2014 in Paris.
Lionel Bonaventure | AFP | Getty Images

The explosive growth of eSports shows that people (especially youth) are adjusting their ways of daily interaction and socialization in the fast-paced world of constant techonological breakthroughs. eSports is going to be the first global sport, predicted by many experts. 

In 2018, eSports market revenue worldwide was 865 million dollars. Experiencing “phenomenal” year-over-year growth, the revenue is expected to double in 2022, reaching 1.79 billion dollars.

eSports market revenue worldwide from 2012 to 2022 (in million U.S. dollars)

2019 is a landmark for eSports as the market surpasses 1 billion for the first timeAccording to Newzoo, eSports revenues will reach an impressive $1.1 billion in 2019, a year-on-year growth of +26.7%. 

Sponsorship is currently the main source of eSports revenue, generating $456.7 million in 2019. But media rights remain the fastest-growing segment, increasing by 81.5% in 2017.

eSports market revenue worldwide in 2019, by segment (in million U.S. dollars)

“When I look at 2018, I feel like it was the year that eSports really started cracking into the mainstream,” Jack Etienne, owner of North American eSports team Cloud9, told CNBC.

While the booming growth of eSports indicts infinite business opportunities across industries, retailers – who are experts on capitalizing opportunities – are eyeing on the gold mine eSports bring in. 

Of course, game retailers can look towards pushing higher-quality hardware as models with more features are being brought to market. But they are also making profit by manufacturing and adding production – such as physical stores.

Game Digital, a British video game company nearly bankrupted in 2012, launched physical stores called “Belong”, where gamers can pay to play together, participate in fan events and test new technologies like VR. 

With the rising of eSports, Game Digital seeks for its future not by just selling games but also by creating a mutual space for gaming, which shares the same idea of eSport competitions. In 2017, for the 12 weeks that ended on mid-March, physical game sales grew 0.5 percent in the U.K., according to Kantar Worldpanel.

Meanwhile, some retailers are dealing with a unique group of audiences – teenagers, also called Gen Zers.

Tilly’s, a Southern California-based accessories retailer focused on teenage customers, started a partnership with the High School Esports League (HSEL) and invited students across the country to win prizes by competing in augmented reality (AR) mobile game. The contest adds to the gross of revenue of Tilly’s physical stores. 

Another trending and lucrative direction for eSports giants is holding world championship events. The 2018 “League of Legends” World Finals had early 100 million viewers – more than the Super Bowl viewers. World Championship like this creates a perfect ecosystem for brands to get involved. As mentioned, over a third of $1 billion industry revenue stream comes from sponsorships, which have been a big driver for “League of Legends” franchise. The publisher announced Mastercard as a global sponsor last year, and the Chinese branch of “League of Legends” signed a partnership deal with Nike months ago.

A child plays Chinese version of ‘League of Legends’, which has 295 million downloads and earned 4.5 billion to date. (Photo by VCG/VCG via Getty Images)

On the consumer’s side, annual spending on eSports-related accessories increased 33 percent from 2017 to 2018, to a record $4.5 billion. The 2018 Entertainment Software Association report found that 64 percent of households own a video game device and 60 percent play video games every day.

Statista shows that the estimated average per capita spending on eSports will increase by two-fifths from 2017 to 2020.

Estimated average per capita spending on eSports related content worldwide in 2017 and 2020 (in U.S. dollars)

Both the industrial production(manufacturing) and consumer spending are swelling, indicating a big upsurge in eSports’ demand and supply. In fact, there is hardly any economic indicator shows the declining trend of Esports. With more and more eyes locked on this industry and more event held (i.e. The eSports Business summit to this month), this is definitely a golden era for eSports – with challenges ahead.

Sources:

  1. Desjardins, Jeff. “The Business of ESports.” Visual Capitalist, 29 May 2018, https://www.visualcapitalist.com/business-of-esports/.
  2. Goslin, Austen. “The 2018 League of Legends World Finals Had Nearly 100 Million Viewers.” The Rift Herald, The Rift Herald, 11 Dec. 2018, https://www.riftherald.com/2018/12/11/18136237/riot-2018-league-of-legends-world-finals-viewers-prize-pool.
  3. Gough, Christina. “Global ESports Market Revenue 2022.” Statista, https://www.statista.com/statistics/490522/global-esports-market-revenue/.
  4. Gough, Christina. “Global Consumer Spend on ESports 2020.” Statista, https://www.statista.com/statistics/691794/consumer-esports-spend/.
  5. Joseph, Seb. “Game Digital Is Looking to Esports to Turn around Retail Sales.” Digiday, 29 Aug. 2017, https://digiday.com/marketing/game-digital-looking-esports-turn-around-retail-sales/.
  6. Pannekeet, Jurre. “Global Esports Economy Will Top $1 Billion for the First Time in 2019.” Newzoo, https://newzoo.com/insights/articles/newzoo-global-esports-economy-will-top-1-billion-for-the-first-time-in-2019/.
  7. Pei, Annie. “Here’s Why Esports Can Become a Billion-Dollar Industry in 2019.” CNBC, CNBC, 23 Jan. 2019, https://www.cnbc.com/2019/01/20/heres-why-esports-can-become-a-billion-dollar-industry-in-2019.html.

Brexit: Why we’re still stressing out about it

(Courtesy: Pixabay)

Some background

Brexit is coming – and if Game of Thrones was still “in” right now, I would make a cheesy, poorly thought out “Winter is coming” joke. However, perhaps there is more in common with Brexit and the hit fantasy series, whose anticipated final season drummed up more controversy than acclaim, than meets the eye. 

Like Game of Thrones’s final season, Brexit – referring to the United Kingdom’s decision to leave the European Union, a political and economic coalition – has been a long-time coming, stressful, messy, controversial and disillusioning. Ever since the 2016 referendum where Brexiters narrowly between the “Bremain” crowd 52% to 46%, the United Kingdom has not actually managed to leave the United Kingdom, delaying their departure date twice due to an inability to strike and approve a satisfactory deal with the European Union. 

The United Kingdom is currently salted to leave the EU on Oct. 31, 2019. There is still no departure deal. Britain’s current prime minister, Boris Johnson – a controversial figure who has drawn comparisons to Trump for his hair and speech patterns – has stated that, if it comes down to it, the UK will leave the EU on Halloween without a deal

With the battle for Brexit getting more heated and members of Johnson’s own party rebelling against him and working with the opposition to draft a bill that would prevent a no-deal departure, Johnson has threatened to call for an election, potentially reshuffling the lines of power. 

What a no-deal Brexit could mean for the UK’s economy

A no-deal Brexit could impact not only the United Kingdom’s economy, but the economy of significant trading partners, such as the United States. In 2018, the Federal Reserve worried that a no-deal Brexit would make London subsidiaries of US banks make the costly relocation to another EU country in order to keep EU clientele and that it could become less profitable for US banks to loan to UK citizens.

Leaving without a deal would mean that the UK would leave a customs union and single market overnight. As a member of the EU, the UK’s goods were not taxed by other member countries. After going cold turkey on the organization, Britain will lose that privilege and the EU would start taxing their goods

According to the BBC, “This could lead to delays at ports, such as Dover, Some fear that this could lead to traffic bottlenecks, disrupting supply routes and damaging the economy.” With almost one-third of food in the UK coming from the EU, food shortages are another concern.

Source: https://www.bbc.com/news/uk-politics-32810887

In the weeks following the initial referendum, the value of the pound fell a little over 10% against the euro from €1.3017 to €1.1663, according to the Brexit currency fallout engagement rate tracker. The original vote also caused the Dow to drop 610.32 points. While Capital Economics’ Senior U.S. Economist Andrew Hunter points out for CNBC that the market volatility “unwound” itself in the weeks following the vote, and suspects the same could happen following Brexit.

What does the economic future of a country leaving the EU look like?

No one knows for certain. The United Kingdom would be the first nation to leave the European Union. There is no precedent. In many ways, it is a shot in the dark. A shot in the dark that has been making headlines for a little over three years and no satisfactory resolution in sight, creating a sense of anxiety for consumers. In August 2019, British consumer confidence fell to a seven-month low, with many attributing that to Brexit worries.

Source: tradingeconomics.com

According to The Guardian’s Sean Farrell, Britain’s economy has been treading water because of consumer spending amidst manufacturing and constructing shrinking and the unwillingness of companies to invest. However, the UK’s decreasing consumer confidence could encourage people to save rather than spend, putting a dent in that part of the economy.

What exactly is Brexit an economic indicator for? It’s unclear. It could be nothing. Or, it could help push the nation into a recession. Only time will tell, but as the prospect of a no-deal Brexit becomes closer to a reality, the UK and the EU’s economic futures may be the scariest thing on Halloween.

Sources:

#Trending: What can fashion and style trends tell us about the economy?

You can find economic indicators everywhere. From plastic surgery to the number of unclaimed bodies at your local morgue, to even the ‘intensity’ of marine corps advertisements, economists have found countless ways to chart the economic growth of the United States in recent years. However, for the last century of so, researchers and experts have found an area that can tell us quite a lot about the economy: fashion.

For example, let’s start with shoes. According to IBM, The “High Heel Index” works like this: the better the economy is going, the lower the heel. The 20th century echoed this theory quite nicely- in the 1970s, large platform heels and boots were in style, replacing the short, kitten-heeled sandals of the 60s. By the time of the “dot-com bust” at the end of the century, the low, block heels of the 1990s were replaced by high, stilettos popularized in shows like Sex and the City.

Social media analysis by IBM found that heel height peaked at 7 inches around the end of 2009- which according to the World Bank, the US GDP was at its lowest point. By 2011, when US GDP ceased it’s steady incline, heel height had fallen to around 2-3 inches.

The relationship between the strength of the United States economy and fashion extends to male style trends as well. According to Vox, beards can signify the triumph of American capitalism and innovation as they were popular with both Gilded-Age titans of industry and “characteristically disheveled figures” of the tech look like Steve Jobs.

However, it’s important to remember the significance of historical and cultural context when tracing the relationship between fashion and economic trends. For example, in the 1920s and 1930s hemlines were a much better tell at economic health. According to ABC News, economist George Taylor took note of how in the 1920s or the “The Age of the Flapper”, women took to higher hemlines to show off their stockings. By the time of the Great Depression, those stockings had gotten pricier, and women lowered their skirts to hide bare legs.

However, some fashion experts say the Hemline theory doesn’t quite add up. Valerie Steele, acting director and chief curator of The Museum at the Fashion Institute of Technology in New York, told ABC News: “Hemlines were starting to come down in ’27 and that was two years before the market crash.”

So is it possible to use fashion as a way to interpret the economy? Fashion, like any other industry, is certainly part of it. As for heel heights, hemlines, and beards- we’ll have to leave it to economists and historians from the future to decide.

Sources:

https://tradingeconomics.com/united-states/gdp

https://www.vox.com/videos/2017/3/17/14939608/beard-popularity-economics

https://www-03.ibm.com/press/us/en/pressrelease/35985.wss

The 40 most unusual economic indicators

https://abcnews.go.com/Business/story?id=86787&page=1

Rash Economic Indication

According to Advertising Age, the sales of diaper-rash cream may indicate the state of the economy. The logic behind the claim is that when the economy is down and parents are trying to spend less money, their budgets decrease and therefore they aim to spend less money on even basic supplies for their families. This mentality causes them to change their children less often in order to conserve diapers and spend less on this costly necessity, increasing the likelihood of babies’ sensitive skin becoming irritated by the wet material. 

As of 2011, diaper cream sales had been on the rise for several years, showing about 2.8% growth, despite the population of infants ages 2 and under in the U.S. falling about 3% in the same time period. Further, data SymphonyIRI data from Deutsche Bank suggests that since 2009, diaper rash cream sales have gone up despite a definitive decline in the sales of diapers themselves.

But does the cost of such a basic item really have an impact on families’ overall expenditures? Actually, yes, as the average American parent is expected to clean up their babies’ bums an average of 6.3 times daily, which adds up to an estimated $1500 per year.

[Source]

So, during a time of economic recession and high unemployment, it’s easy to imagine that parents may wait just a few hours longer to change their children in an effort to conserve their supply and spend less. Therefore, as obscure as it may seem, sales of diaper cream can be viewed as an economic indicator.

Other sources: CNN

The Quality of Our Dining Foreshadows the Health of Our Economy

There is an idiom expression in China saying that “hunger breeds discontentment.” It is not hard to understand that people are less likely to spend money on fancy meal and dining environment when the economy is bad. With little money in their pocket, people tend to turn to fast-food or eat at home, and the restaurant business goes down. Thus the Performance of the Restaurant Industry is a significant indicator of the health of our economy.

According to the National Restaurant Association(NRA), Restaurant industry sales constitute 4 percent of the U.S. GDP. The president of NRA Dawn Sweeney said restaurant business also stimulates employment and generates tax revenues. He said, “What’s more, for every dollar spent in restaurants, an additional $2 is generated in sales for other industries, generating even more tax dollars and economic activity.”

RPI Index

The Restaurant Performance Index provided by the National Restaurant Association examines a comprehensive health of the U.S. restaurant industry, including sales, traffic, labor and capital expenditures. If the index value is above 100, it means the American restaurant business is growing during this period of time. An index value below 100 means this business is shrinking.

If we compare this chart to the United States GDP, we could see a general trend that the RPI and GDP have a positive relationship. The higher RPI foreshadows a growing GDP, usually about one year ahead. For example, RPI falled below 100 value after 2007, while American confronted a recession in 2008. While RPI started to recover after 2009, the GDP began to increase after 2010.

American GDP Chart

Stifel analyst Paul Westra and his team believe that “US restaurants are showing signs of heading toward a sector-wide recession.” Restaurant spending is a strong indicator of consumer behaving, which is a large part of American economic growth. It also demonstrates people’s confidence about their money. Stifel’s team said “Restaurants have historically led the market lower during the 3-to-6-month periods prior to the start of the prior three US recessions”. The RPI and GDP charts above has backed up Stifel’s statement.

The RPI Index for 2017 is pretty close to the value of 100. Westra said, “restaurant performance this year, particularly in the second quarter, is shaping up to look pretty similar to the second half of 2000 and the first half of 2007 – the periods that immediately preceded the last two U.S. recessions.” If the history repeats itself, it means 2018 might become the beginning of another U.S. recession period.