Online Celebrity Industry: The Lipstick Effect In China

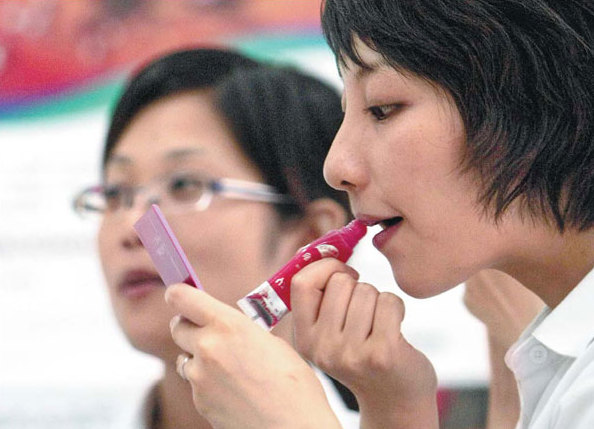
(Photo credit to China Daily USA)

The online star industry is booming in China, with countless internet celebrities posing videos on the Chinese music video platforms such as Tik Tok and Kuaishou. According to the South China Morning Post, Tik Tok has 150 million daily active users in China, and its market value is more than 20 billion dollars. Kuaishou has 120 million daily active users now, and it helped the company in receiving the Tencent’s 350 million dollar investment in 2017.

Unlike other popular Chinese social media such as WeChat and Weibo, these platforms are relatively young. Tik Tok was launched in 2016, and Kuaishou was established in 2014. Tik Tok is well-known for the videos of young female bloggers who are dressed in fashionable clothing and with gorgeous makeup. Famous online cosmetics stars sometimes earn the same amount of money as some Chinese movie stars such as Fan Bingbing and Zhang Ziyi do. Kuaishou, ironically, is criticized by the China Central Television news for the videos of underage pregnant women. According to the New York Times, Yang Qingning, a 19-year-old online blogger, posted the videos of her pregnancy and baby in Kuaishou and attracted millions of followers in 2017. Behind these ridiculous mini-videos, there are a thousand strings attached.

A CCTV reporter criticizes the underage pregnant Kuaishou bloggers.  (Video credit to the New York Times)

The lipstick effect is that women tend to buy more appearance-enhancing items during times of the economic recession. When the economy is depressed, people usually downsize spending on everything. Therefore, one of the explanations for the lipstick effect is to ensure women’s reproductive success. Financially insecure women are willing to attract wealthy partners by using more makeups. For example, L’Oréal, one of the world’s biggest cosmetics companies, had sales growth of 5.3 percent in the United States in 2008, when the rest of the economy suffered from the great recession. Researchers also find that women who are living in a harsh financial situation have stronger needs for immediate reproduction than those living in a financially stable environment.

During the great recession, American female workers hoped to enhance their appearance to keep their jobs or to appeal to men. With the development of the internet and social media, young Chinese females find an easy way to show their appearances or professions online. Even better, they can earn money by posing mini-videos related to sexual connotations. In China, the infrastructure construction on the countryside cannot satisfy people’s needs, although the GDP grew 6.9 percent in 2017. With the Chinese government’s strict control of its mainstream media, the majority of people living in the countryside has limited access to the outside world. Therefore, the internet is the only place they go. For instance, one anonymous man had pretended to be a China Southern Eastern flight attendant in Tik Tok for two years by posing the photos and videos that he found on the flight attendant’s other social media. He received 30,000 followers and sold his account to another online blogger. He said he could not tolerate the life of pretending an attractive, professional and young female attendant.

The lipstick effect is always related to the sexual attraction. With the assistance of the internet, online celebrities in China now are selling their images to people around the country. They can probably find their ideal partners or at least earn some money.


Sources:

Hill, S., Rodeheffer, C., Griskevicius, V., Durante, K., & White, A. (n.d.). Boosting beauty in an economic decline: mating, spending, and the lipstick effect. Journal of personality and social psychology103(2), 275–91. doi:10.1037/a0028657

Netchaeva, E., & Rees, M. (n.d.). Strategically Stunning: The Professional Motivations Behind the Lipstick Effect. Psychological Science27(8), 1157–1168. doi:10.1177/0956797616654677

https://www.scmp.com/tech/social-gadgets/article/2150528/most-popular-iphone-app-tik-tok-hits-150-million-daily-users

https://www.scmp.com/news/china/society/article/2159157/chinas-male-online-cosmetics-stars-and-booming-new-industry

https://www.nytimes.com/2018/04/06/technology/china-censor-teen-moms.html

https://www.bbc.com/news/world-asia-china-36802769

https://www.scmp.com/news/hong-kong/economy/article/1930485/how-lipstick-effect-can-create-gloss-economic-downturn-hong

Men’s fashion as an economic indicator

It’s a Monday morning. Usually it takes five alarms to make you move even an inch out of bed, but today you feel different you feel good. You open the curtains to let the light in. Those annoying birds actually sound pretty nice. After drinking a fresh cup of coffee, you open your closet and put on your best suit. You’re feeling confident, so you pick out your brightest tie. After all, it is a pink tie kind of day.

Believe it or not, that pink tie alone can say a lot about the economy.

According to a report by Forbes, many investors pay attention to subtle variations in product sales and use them as tools to determine the state of the economy. Known simply as economic indicators, these tools may take cues from social behaviors and product sales — in this case, fashion trends — to predict future economic performance.

As reported by Forbes, how men generally decide to wear their ties can point toward ups and downs in regard to the job market as a whole. When things are looking up for the economy, many workers decide to express their happiness through their wardrobes — that means brighter colors, like pink and fuschia. Width counts as well: When there’s a gloomy forecast for jobs, thinner ties — paired with dark, somber colors — become more popular among the workforce. According to chief economist for Regions Bank, “Men’s ties are a leading indicator because they’re a very inexpensive way to change a wardrobe.”

For example, Business Insider states that one of the most notable instances of this phenomenon occured in 2007, when rumors of layoffs in the job market caused a spike in tie sales specially for thinner ties. The reported reasoning was that, as their positions became less and less secure, many men wanted to show their bosses that they were serious, dedicated employees.

Image result for men tie stock photo

The existence of this indicator, along with many others just as bizarre, brings up an interesting discussion on the impact the general economy has on our daily lives. That something as minor as a wardrobe change can be used to predict the state of the job market proves how economically oriented the average citizen can be. In addition, there is also something to be said in widespread these changes can occur in such a short amount of time: International popular culture is becoming more interconnected than ever, and it can have unprecedented intersections with economic trends as well.

If anything, the prevalence of this trend should teach us to take a closer look at how changing social behavior can reflect a similarly changing economy. Whether they’re analyzed through the “Buttered Popcorn Index” or the “Hot Waitress Economic Index,” shifts in consumer culture can become fairly obvious if one only looks for them All it takes is a trained, and sometimes fashionable, eye.

And for all our sakes, hopefully things will start to look pink.


Housing Starts: the champion of consumer confidence

The volatility of the housing market has long been a reflection of American economic activity, itself a somewhat unstable force. The “New Residential Construction Report” expressed data surrounding how many residential construction projects have begun within a certain time versus the number of issued building permits. Analyzed and reported on by the U.S. Department of Housing and Urban Development, housing starts, building permits and housing completions are key economic indicators in considering the housing market not only as a system of vending, but also one of constant (or interrupted) development, reflecting not only national financial welfare but also consumer confidence.

In March of 2018, Time Magazine characterized housing starts as the indicator responsible for predicting every recession since 1960—going on to say that a 7% fall in housing starts was a warning signal that, despite what other economic indicators reflected, the rate of economic advancement was perhaps not as lofty as initially believed. This is to say that, while GDP grows, a falling housing market cannot be overlooked. Housing and its embedded costs—building, purchase, renovations, and maintenance—account for a sixth of the total GDP. This influence is only heightened by the reverberant efficacy of the housing industry. An analysis of housing to some extent determines the supply of preexisting homes on the market, as well as the calibration of mortgage lending and homeowners insurance. An increase in housing starts signals an increase in demand for the construction industry, and their suppliers. It is also indicative of an increase in demand and potential employment for commercial ventures marketing household appliances, furnishings, and other home improvement goods. Home Depot, for example, witnessed a 15% decrease in shares between January and March of 2018, despite earning and sales reports that well exceeded expectations—while it might seem bold to define this decline as a projection of a weakening broad economy, there is a truth to the coupling of commercial performance and economic trajectory. Stores like Home Depot are perhaps somewhat niche markets, but an analysis of business cycle “pivot points” (a daily average high, low and closing prices at the end of the market day) and the performance of housing is a good ledger for considering the agency of housing as a critical economic indicator.

Perhaps one of the greatest draws towards housing as a vital economic indicator is its capacity to guage and budget for future trends. Terri Spath, chief investment officer for Sierra Investment Management, considers housing starts as a “terrific leading indicator of the economy.” Given the many month commitment a buyer is faced with when investing in a new construction housing project, potential homebuyers will often hold off, erring on the side of caution if there is potential for an imminent economic downturn. “Who wants to engage in the biggest investment of their life — buying a house — if they’re worried about losing their job?”, asks Sam Stoval, chief investment strategist for CFRA research firm. This sentiment, above all, is a demonstration of consumer confidence in full effect. While housing is a somewhat pigeonholed factor, customer optimism and trust in the stability of their jobs, the security of their personal finances, and the overall quality (and longevity) of the economy all serve broaden the threshold of area of consideration, speaking volumes to both housing’s influence and reactivity.

That being said, the use of housing starts as an economic indicator is not without its drawbacks. It is, at times, an expression of incomplete data, drawing only from one specified area of the economy, despite the centrality of housing as contingent on other, more holistic economic sects. With a high rate of differentiation and modulation across different regions of the US, weather also takes a somewhat unexpected hold over the discriminate variability of housing starts in different areas of the country, as do the diverse range of sub-economies within these variant regions. A case can also be made for the oversight of this data, as it considers numeric  statistical data without acknowledging quality and size of homes—another potential indicator of consumer confidence, given the fluctuant commitment of signing on to build a one story home in a development versus a privately contracted compound. However, while housing starts alone are inconclusive when considering the broader economic welfare of the country, they are an integral part of a cause-and-effect system, impacting employment, spending, loans and insurance, and indicating not only a general sense of the economy, but a more specific declaration of consumer assurance.


SOURCES

https://www.northerntrust.com/insights-research/detail?c=deafd74fb1792c12488100138c985da3


http://time.com/money/5202597/economic-indicator-housing-market-stocks/


The Economic Story Behind Lipstick Sales

The rise in consumer spending is always perceived as a signpost for positive economic growth among analysts, there are, however, exceptions to this rule. Apart from the traditional economic indicators such as the unemployment rate and trade balance, there are sayings that lipstick sales can also serve as an indicator to measure the economic health of the country.

The Leading Lipstick Indicator, also known as the Lipstick Index, was coined by the Leonard Lauder, chairman of Estée Lauder, in 2011 when he witnessed the company’s lipstick sales doubled after the September 11 attacks. The idea behind the Index is that people are inclined to save up amid uncertainties and more prone to small luxuries.

History tells us that the uptick in lipstick spending often happens during economic recessions. The U.S. experienced an 11% surge in lipstick sales during the fall of 2001, while the spending on cosmetic products was up 25% back in the Great Depression. A jump in the Index mirrors a drop in consumer confidence because of the shift to relatively inexpensive luxuries.

Though the Index does not have the backing of official analysis and research to support its recession measurement, the shift in consumer behaviors heralds a diminishing consumer confidence when women forgo the pursuit of lavish handbags and jewelries and turn to affordable indulgences like lipsticks.

Despite not seeing similar lipstick sales trend in 2008, another cosmetic product is emerging as an indicator measuring economic strength. According to an interview conducted by the TIME magazine, nail-enhancing products are outpacing lipsticks that send women into a frenzy, said Lauder. The release of new lipstick shades does not excite women as much as it did decades ago. Instead of splurging on what they already own in their closets, people began to hunt for trending products in the beauty market. During the economic downturn from 2008 to 2011, the sales of nail-related goods increased exponentially by 65%, once again buttressing the analysis that people tend to avoid big purchases and pamper themselves with small luxurious products in times of economic hardship.

As time goes by, the lipstick effect has evolved as a term to describe the rise of smaller-ticket purchases amid economic downturns. As people are pulling back on opulent enjoyment, the odds of a falling economy grow.

So everyone, be wary the next time when you are about to purchase a lipstick. It might signal a slowdown in the economy!

Sources:
What Lipstick Tells Us About the Economy
https://www.economist.com/unknown/2009/01/23/lip-service

Consumer Confidence: An Underappreciated Indicator

In the world of economics, real numbers, unsurprisingly, have always been the pinnacle of people’s attention. Economy is about money, and what better way to talk about money than numbers representing actual money involved in the economy. However, there is always more to the big picture than meets the eye, and besides the buzz around more commonly used economic indicators, such as Consumer Price Index, and Producer Price Index, the less talked-about, and lesser-known Consumer Confidence deserves much more recognition than it currently gets. Consumer Confidence is, in fact, monumental, in that it reflects on many of the most important areas of the economy, such as housing, unemployment, and inflation. Furthermore, unlike CPI and PPI, trailing indicators that document the past, Consumer Confidence, a leading indicator, often times paints us an accurate picture of what the economy looks like in the foreseeable future, and that is where the key difference lies. Although there is much to be learnt from the history and the recent past, we study economics for the future, and more time and energy ought to be devoted to analyzing stats that predict economy in the future, rather than the past.


Consumer Confidence is, in itself, a comprehensive, yet somewhat abstract indicator due to the many factors that come into play when it is calculated. When being asked to consider future expenditure, consumers would weigh their economic circumstances carefully, and give their opinions, namely, confidence level. The higher the Consumer Confidence in general, the more consumer-friendly the current market and economy is, and the more consumption will be taking place. Because it is measured by opinion polls and surveys filled out by the general public, the results are directly from the consumers themselves, and so is highly representative of the overall consumption in the next six months. It is relatively abstract because the Consumer Confidence numbers will be a result of many aforementioned factors combined, without clearly stating how each is faring in specific. Still, it does its job in predicting the general trend of consumption in an economy.


While indicators like CPI and PPI presents a picture faithful to economy in the past, Consumer Confidence takes advantage of conditions of the near past and present to make an outline for the future. Granted, we could look at the pattern of recent CPI and PPI, and predict that it is highly probable that the trend will continue. But, these indicators being what they are, in essence, trailing indicators, they have no way of estimating a change in the pattern ahead of time. In economics, timing is crucial, and a leading indicator like Consumer Confidence has the benefit of providing people with the convenience of being able to know what happens ahead of time. The leeway helps governments to be Johnny on the spot when making new policies, and can prevent them from losing money. More analysis on Consumer Confidence can prove quite valuable for governments in the long run, for it will help stabilize the economy, and kill off potential financial setbacks before they take form.

Consumerism as a vital indicator of the American economy

Consumer spending is, without a doubt, one of the backbones of American culture. In the United States, it’s often impossible to go even one day without buying something, whether it’s purchasing a simple pack of gum or dropping some serious cash on a brand-new car. With these everyday, but vital, contributors to the United States’ economy in mind, it’s no wonder that consumer spending is one of the most important economic indicators for the U.S., accounting for about two-thirds of the U.S. economy. More specifically, retail sales (often the most common picture of consumerism) cover 40 percent of consumer spending. Given the seasonal nature of retail, sales reports are released on a monthly basis to be compared to that same month of a previous year. So yes, one could say that the holiday season and exchanging presents are not just about good will to all, considering sales made during that time are an especially strong indicator of how well (or how poorly) the U.S. economy is doing.

Additionally, it is important to note that, naturally, retail sales directly reflect consumers’ wealth and confidence in the economy. The more household incomes increase and stock prices rise, the wealthier people feel, which inclines them to spend more. If consumers are economically insecure about the future, they will spend less. To best illustrate this concept, let’s briefly look at consumer spending before and during the Great Recession of 2008.

On Oct. 25, 2011, The Economist published an article titled “Hard times: How the economic slowdown has changed consumer spending in America.” Given the year, 2011, the piece was written as the United States was attempting to climb from the depths of the crash that began in 2008, and the above graph depicts how resulting consumer spending changed between 2007 and 2010.

Personally, I was still in late elementary school when the crash occurred, and I distinctly remember that the recession did not hit my family hard until 2011 when my father was laid off from his full time job. As the graph communicates, the recession led to an overall decrease in consumer spending by the nation, and I definitely remember that my family had to reduce our spending, too. Now that I’m studying the topic years later with a more mature perspective, it’s interesting to see how my family’s decreased spending habits at the time reflected those of the nation as a whole, which is something my 11-year-old self could not process.

Most notably, the article points out how consumer spending had changed at large, writing, “Between 2007 and 2010, average annual consumer spending per unit—defined as a family/shared household or single/financially independent person—fell by 3.1% to $48,109. Average prices over this period have risen by 5.2%, so real consumer spending has fallen by almost 8%.” The article then compares these spending habits to those of the “peak years” of 2003-2006, stating that consumer spending actually rose by 8.2 percent during that time. Consequently, recession years brought less spending on luxuries like sugar and nicotine, whereas the earlier prosperous years saw an increase in spending on non-necessities, namely household goods and alcohol, by 13 percent and 19 percent, respectively.

Simply put, as depicted by this short sliver of time that had such a drastic, historic impact on the U.S. economy, when consumers aren’t spending, it’s not because they’ve lost interest in American consumerism; rather, decreased consumer spending indicates a much larger problem within the grander economic landscape. After all, America is nothing without its consumer goods, so a thriving economy is the best way to keep America and it’s (morally conflicting) consumerist values alive and well.


SOURCES:

https://www.economist.com/graphic-detail/2011/10/25/hard-times

Greg IP. The Little Book of Economics

Terri Thompson. Writing About Business

Pick A Pickle to Understand Urbanization in China

We can always rely on food to tell changes in an economy.

Zhacai (榨菜) is a type of pickled mustard plant stem similar to Korean Kimchi. In China, it is popular among low-income group, particularly transient workers. By looking at the change in the sales of zhacai in different regions, one might tell where the workers were flowing into, which reflects how the cities has developed.

There has been large demand for labor forces as China embraces aggressive urbanization since its Reform and Opening-up. More and more breadwinners of rural households have attempted to opt out the life as farmers to pursue an imaginarily decent one in modern cities. In 1950, 13% of people in China lived in cities; by 2010, the urban share of the population had grown to 45%. The idea of using zhacai as an economic indicator was brought up in 2013 by Prof. Ba Shusong, Deputy Secretary General of China Society of Macroeconomics. He predicted that transient workers in east coastal areas would go back to their hometowns in west central China, as labor-intensive industries in the coastal areas had begun to migrate to the central regions since 2008 due to rising costs in land and resource.

According to the financial statements of Chongqing Fuling Zhacai, the biggest zhacai manufacturer in the country, from 2010 to 2012, the sales in Central China, Northwest China and Central Plains increased by 67.4%, 65.2% and 56.8% respectively, while the growth rate of South China was only 8.82% during the same period, which was the lowest in the nine sales regions of the country. The data then consolidate the argument of Prof. Ba.

The concept, however, is not entirely academically accurate. A migrant worker, for instance, might stop buying zhacai because of rising income levels or changing dietary preferences, while he himself was not migrating to anywhere else. Such changes would not reflect the physical move of the consumers.

Despite that, government officials in Guangdong Province might felt a huge relief seeing this number, for it suggests that their pressure on resettling the migrant population will be greatly reduced. Officials in the west central China, however, would have to feel a little bit of anxiety, because they might need to cope with tens of millions of people returning to the towns – they would then be crowded with problems of employment, health care and public services…

Indexes and Indicators

If you’re reading this, you’re most likely in college or at least very familiar with higher education. If so, you may be aware of the yearly increase colleges make to their final Cost of Attendance (COA). Yes, part of that may be because of the increased expenses and simply an administrative decision, but there is another underlying reason the cost goes up in small (though sometimes not-so-small) increments. Take the tuition of University of Southern California, for example.


The Widney House, then known as Hodge Hall at the University of Southern California circa 1880. 

The original cost of tuition when USC was first founded in 1880 was a whopping $15.00 per term. Today, that is about the cost of a single dining hall meal at USC (if not cheaper). But if we examine even the past few years, the tuition at the University of Southern California has increased 3.5% or more every year. The economy experiences inflation and the American dollar’s value starts to depreciate. In other words, you have to start paying more money for the same products, like your panini sandwiches.  

Graphic made by Baylee Nagda from the Daily Trojan Newspaper


The inflation, or the “weaker dollar,” versus deflation, or the “stronger dollar” refers to how much value the same dollar bill holds. Though it is important to note that this is not true in every case—sometimes, the rising prices may simply signal a bustling economy and the dollar will increase along with the stimulated economy. 

But why is this important? The strength of the dollar in any nation’s economy can be a strong economic indicator. One way of measuring inflation is through the Consumer Price Index, or CPI for short. It takes a general list of essential things most Americans or the citizens of a certain nation buys and tracks its cost. Seeing where the trend lies in the Consumer Price Index can let us know as Americans, consumers, investors, and global citizens how the foreseeable economic future will be shaped to some degree. This knowledge can influence what we choose to do or not do with our money, influencing decisions.


In more specific breakdowns, these statistics are differentiated by Urban consumers and non-Urban consumers. The Bureau of Labor Statistics from the US Department of Labor reveals a monthly Consumer Price Index summary— this past month in July of 2018, the Bureau reported that the CPI has increased 0.2 percent.


Graphic by George Petras from USA Today. 


However, Dan Caplinger of the USA Today speculates that the inflation rate isn’t always accurately reflected in our everyday lives. He explains that the statistics for the Consumer Price Index that is taken are averages of the general population. This includes different categories of the workforce such as employed, unemployed and the growing group of the baby boomer generation that is starting to retire. Thus, different age brackets and income brackets. Age inevitably has a stronghold of influence on our personal spending, but also the allocation of money even within our “necessities.” An example would be that health care is most likely to cost more the older you get. Yet, some may argue that in the bigger picture of economic activity, a specific demographic will only change consumer behavior so much. Ultimately, consumers will spend when the economy is favorable and spending becomes attractive. 


Understanding that the primary goal of CPI statistics are for tracking the economy rather than personal accuracy is important to note. This means that the CPI statistics are not going to be accurate in every neighborhood of the United States, but are referenced as the average cost of an item during a certain time period. Considering all of these factors, we can extrapolate from this data to give us guiding clues about how the economy is going to behave.

The Corruption Perceptions Index

It seems as though daily someone gives another push to the revolving door that is scandal in the Trump administration. Last week, it got quite the shove, as Trump’s former personal attorney Michael Cohen said in court that the president had directed him during the 2016 campaign to pay off two women who claimed they had affairs with Trump. Cohen’s accusation implicates the president in a federal crime.

Many across the country—and across the world—see the Trump administration and the United States as heavily corrupt. The U.S. is, however, the 16th least corrupt country in the world, according to the Corruption Perceptions Index (CPI), that is.

The CPI is published yearly by Transparency International (TI), an NGO dedicated to fighting global corruption. It is perhaps the best-known measure of corruption worldwide. The CPI ranks 180 territories on a scale from 0 to 100. The closer the country’s score is to 100, the better that country prevents government corruption. A score below 50 implies the country has deeply-rooted issues with corruption, while a score below 30 suggests the country is capable of meddling in a U.S. presidential election wherein the winner of that election might go against all American intelligence officials and deny the country guilty of any wrongdoing. Just kidding. But it does suggest that corruption for the country is as basic as borscht.

The CPI takes into consideration the results of 10 surveys and studies conducted by a range of institutions. Sources include the World Bank, the African Development Bank, data from the Economist Intelligence Unit, and executives at the World Economic Forum. Transparency International evaluates the quality of studies gathered and employs a team of both in-house and independent researchers to assist in original data collection.

Participation in corruption can affect an organization in negative ways whose effects are felt long-term. In many cases, corruption causes inefficiency, especially when funds are wrongfully used. Bad press is sure to follow instances of realized corruption, likely causing customers to lose confidence in its business practices. An organization’s damaged reputation discourages possible business partners from becoming involved.

At this point, the company might need an entire public relations campaign to regain its footing, costing both time and money. This dedication of resources might rob another area of the company of the attention it needs, exposing inefficiencies and potential financial losses. This scenario can be applied to an entire country and its economy.

Corruption is discouraged when there are tools of accountability in place. They promote a culture that values stout ethical practices while maintaining a system of punishment for those who breach standards. Companies can minimize corruption by implementing easy ways to report offenses.

It’s still unclear whether or not Trump will ever be prosecuted for any instances of corruption, but it’s doubtful that he’ll retain the services of Michael Cohen if he is.