California’s market-based response to climate change tries to avoid the problems with markets

A layer of smog rests over the Los Angeles Basin in Sept. 2007. (Flickr user vlasta2, CC BY-NC-ND 2.0)

When California Gov. Jerry Brown signed major climate legislation in June, he returned to the spot where his predecessor, Arnold Schwarzenegger, signed his own climate law more than ten years earlier: Treasure Island.

It was an apt location. The artificial island in the San Francisco Bay was created in the 1930s to showcase California’s grandeur for the World’s Fair. Likewise, these climate bills are intended largely to demonstrate to the world that California is leading on climate change.

Schwarzenegger signed Assembly Bill 32 into law in 2006, setting the stage for the creation of California’s cap-and-trade program. A concept that’s been around for only a few decades, cap-and-trade aims to create financial incentives for polluters to adopt more eco-friendly technologies and reduce their greenhouse gas emissions. Brown extended the program to 2030 on Treasure Island and created more ambitious targets.

The state’s goal is to reach 1990 levels of greenhouse gas emissions by 2020, despite a projected population increase of nearly 37 percent over 1990. In 2017, that goal was toughened to reach 40 percent below 1990 levels by 2030.

But so far, it’s been hard to measure the cap-and-trade program’s success, and market-based approaches to the environment can have many of the same flaws and failures found in other kinds of markets. The state’s efforts to address these flaws led to redundant “complementary” policies, meaning that the centerpiece of California’s climate policy actually only plays a small part in its emissions reductions.

A modern cap-and-trade system is designed to reduce greenhouse gas emissions through a flexible market rather than one-size-fits-all regulation. By putting a price on greenhouse gases and creating a market to trade them, the system creates economic incentives for firms to reduce their emissions in the way that’s most cost-effective. To reach the state’s 2020 goal, emissions will need to be about 15 percent below a “business as usual” scenario.

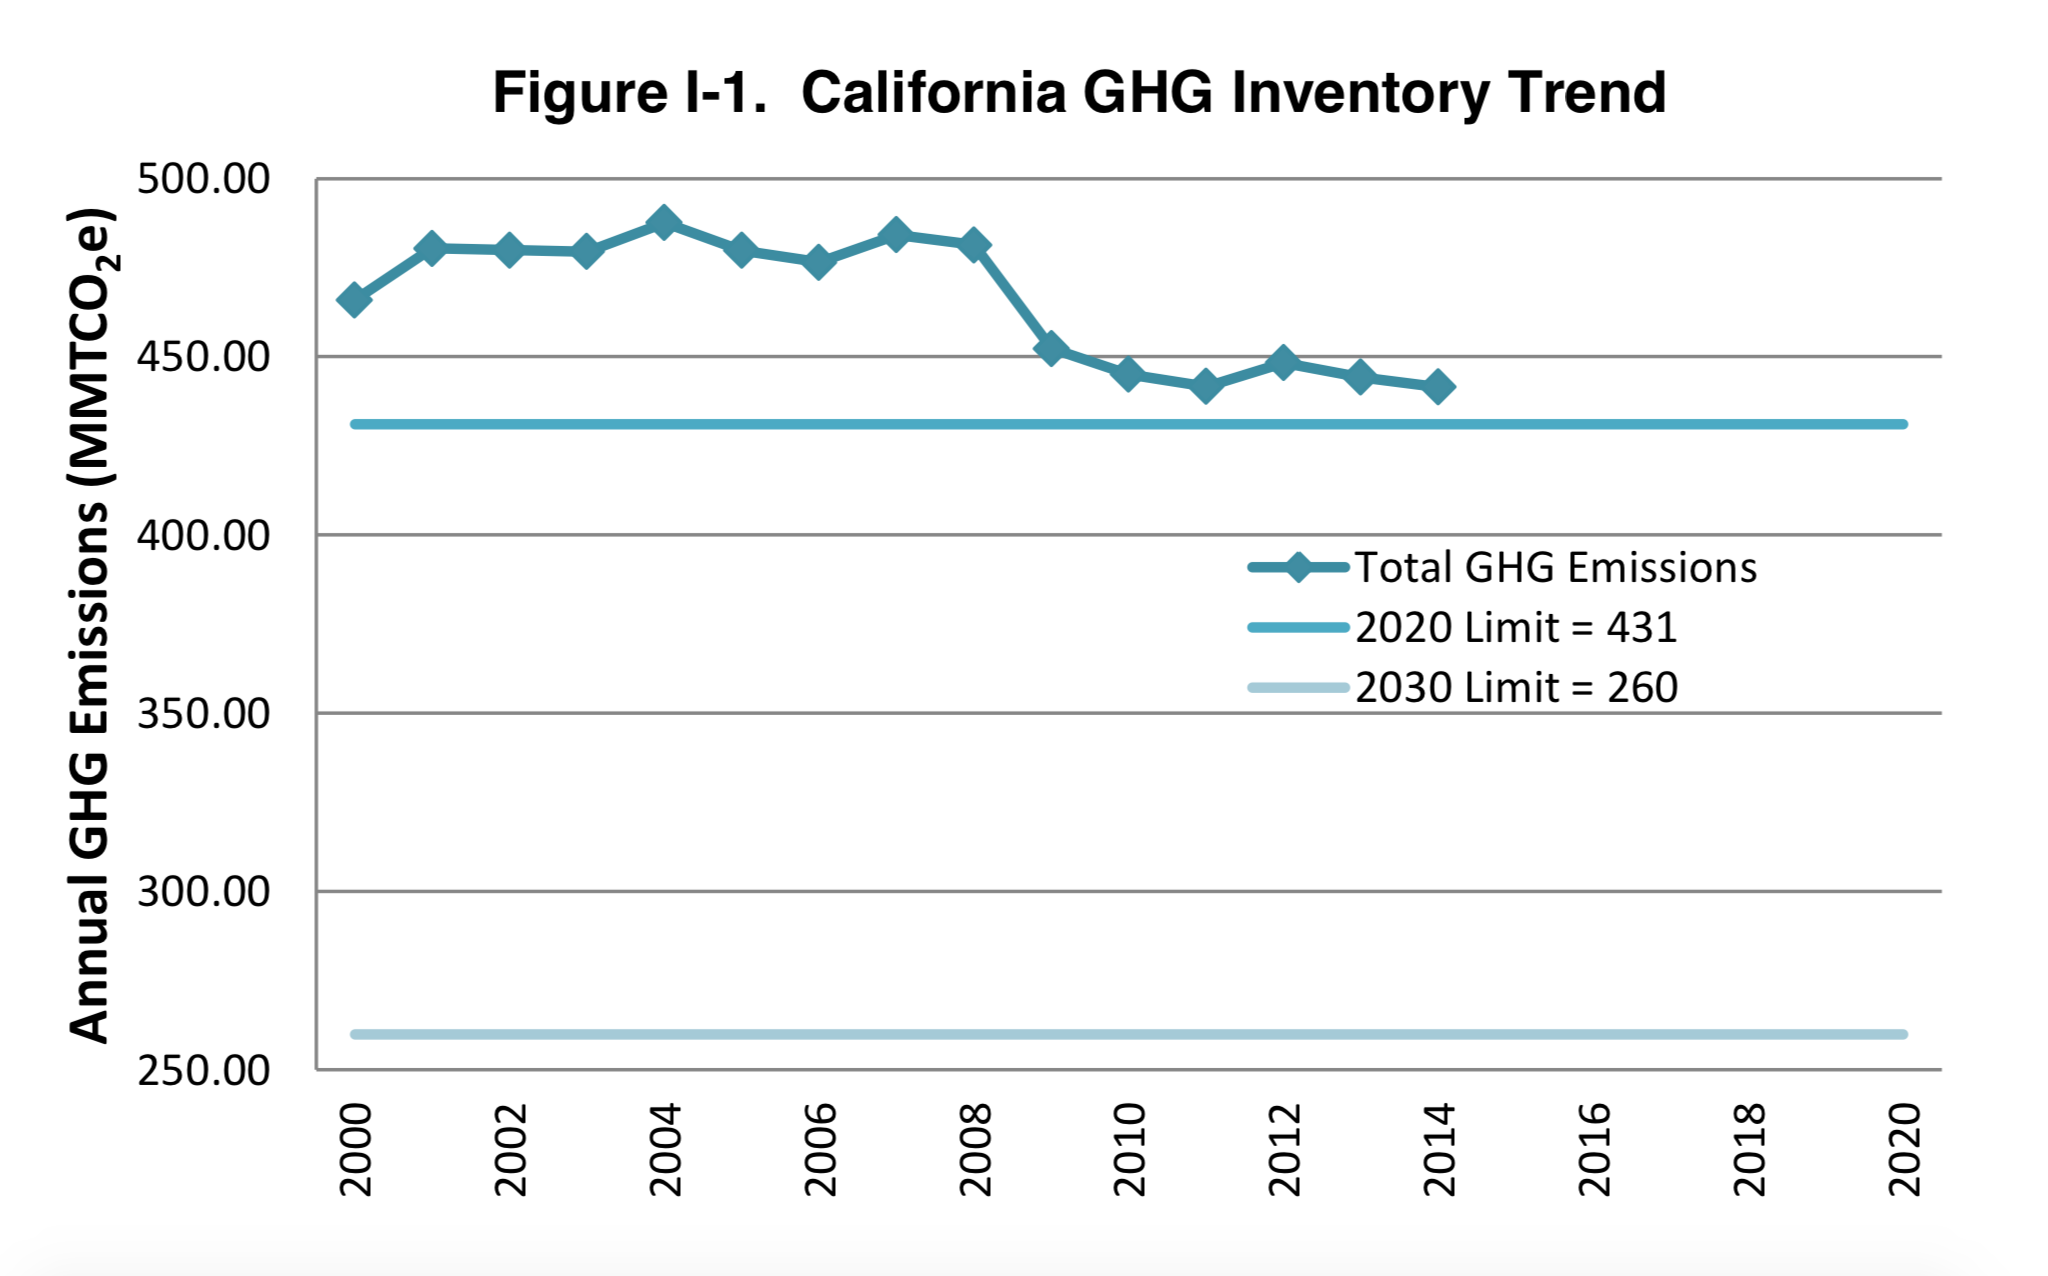
The California Air Resources Board keeps track of the state’s greenhouse gas emissions. This chart from CARB’s 2017 Scoping Plan shows emissions from 2000 to 2014.

To illustrate how this works in practice, let’s imagine you run a natural gas power plant and you produce 100 tons of CO2-equivalent in a year (in reality, this figure would be much higher). Knowing that you emit 100 tons, the California Air Resources Board would issue you 100 carbon credits. You’d get most of them for free, but a few would need to be purchased on the market, either from the state or from other polluters. The idea is that you would save money by taking steps to reduce your emissions rather than purchasing credits, and then if you use fewer than what you’re given for free, you can sell the rest and make a profit. The total number of credits given by the state decreases every year to encourage emissions reductions.

California’s cap-and-trade system began on Jan. 1, 2013, with large power plants and industrial facilities. It was expanded to fuel distributors in 2015, meaning that cap-and-trade now affects about 85 percent of greenhouse gas emissions in the state. Some major companies in the state, like electric utility Pacific Gas and Electric, which serves nearly two-thirds of California’s geographic area, have said they support the program as the best way to address climate change.

In the United States, California has the most extensive cap-and-trade system, which affects all companies emitting more than 25,000 tons of CO2-equivalent in a year. By 2018, its market will be linked to both the Quebec and Ontario emissions markets (more on this later). There’s also a regional cap-and-trade system for electric utilities in New England, and there have been others in the past, such as one created in the 1990s to reduce acid rain-causing emissions. But no nationwide emissions trading system exists today in the U.S. The last big effort to create one, the Waxman–Markey bill in 2009, passed in the House but fell through in the Senate after facing opposition from senators from coal-reliant states.

So far, emissions auctions in California have raised nearly $5 billion for the state, according to the state Legislative Analyst’s Office. State law requires this money to be spent on projects that further reduce greenhouse gas emissions. More than $1.3 billion has been spent on the state’s high-speed rail project, and nearly $700 million each has been spent on low carbon vehicle incentives and affordable housing programs.

Critics of cap-and-trade policy say it’s burdensome for businesses and have pointed to high-profile companies like Toyota moving their operations out of California. But USC environmental economist Kate Svyatets said the state has been successful in balancing competing interests: economic freedom and environmental protection.

“A lot of businesses, instead of being overburdened, they make money,” Svyatets said. “It’s possible to have both a cleaner environment and economic growth, and California shows how to achieve it.”

For most economists, cap-and-trade is the “preferred solution” for regulating greenhouse gas emissions, UCLA researcher Ann E. Carlson wrote in the Harvard Journal on Legislation. Other methods of emissions control, like a carbon tax or mitigation rules, require direct government enforcement and are not as economically efficient as a market system can be — they impose a price on carbon on the state rather than letting one emerge through economic activity.

“It’s hard for the government to decide exactly how many carbon credits to allow,” Svyatets said. “The carbon experts say it’s not expensive enough yet. It’s still better than nothing, but it’s not expensive enough for some companies to switch to clean technology.”

But though California’s cap-and-trade system is designed to create price incentives to reduce emissions, it has not been very instrumental in doing so. The emissions cap each year has been higher than actual emissions in the state, meaning that the emissions trading system does not have the chance to seriously affect how polluters behave. Prices on the emissions market also fell precipitously in 2016 as a court case made the program’s future uncertain. They’ve since rebounded but remain near the state-mandated price floor.

When emission credits don’t cost enough, it becomes cheaper for firms to pollute than to invest in methods that would reduce their emissions in the long term. The European Union is an example of this. It started its cap-and-trade system in 2005, but the European Commission allowed too many credits in the market. Prices fell to ineffective levels by 2008, and companies were profiting off the EU’s mistake by selling the extra credits.

As in California, the prices have since stabilized. At the time of writing, the allowance to emit a ton of greenhouse gases costs roughly $7 in the EU, compared to $13 on California’s market. The 2017 price floor in California is $13.57.

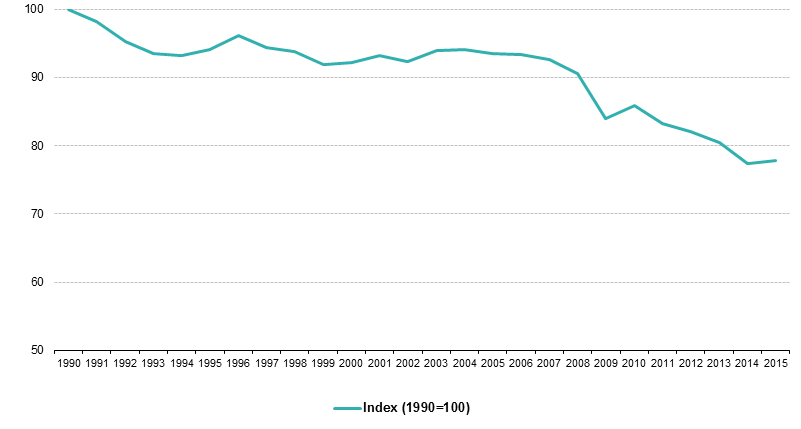
This chart from the European Commission of the European Union shows how the EU’s greenhouse gas emissions have changed since 1990. The data are shown as an index, with 100 being the 1990 level.

Carlson said that when emissions trading systems don’t work, “policymakers may need to enact complementary policies to address those market failures.” California has supplemental requirements like the Renewable Portfolio Standard, which requires an increasing portion of electricity sold in the state to come from renewable and emissions-free sources, and the Low Carbon Fuel Standard, which requires gasoline and diesel fuels to be less “carbon-intensive.”

These policies are perhaps the greatest limit to cap-and-trade’s effectiveness. The complementary policies are responsible for about 80 percent of emissions reductions, with cap-and-trade in place to “sweep up remaining cuts,” according to MIT researchers’ interviews with California officials.

All three policies were created together in what the researchers have called an “insurance” policy to “create a mechanism that could make up emission reduction efforts that were lost if any of the major complementary policies were to fail.” In a way, this means that cap-and-trade in California is intended to be largely a backup plan in case the state’s other policies are not enough. This limits the role that the market has and therefore the incentive for polluters to reduce emissions in the most cost-effective way.

One common issue in many markets is a lack of competition or the monopolization of resources, but despite some speculative activities in emissions trading, anti-competitive behavior hasn’t been a problem in large markets like the European Union or California. German researchers found that those kinds of issues only arise in small trading pools, such as the RECLAIM market for nitrous oxide and sulfur oxide emissions in Southern California.

“Firms within the same industry do not want to sell allowances to buyers with whom they [otherwise] compete,” the researchers wrote. But in large cap-and-trade systems with diverse stakeholders, this has not been a problem.

To make emissions trading systems even more competitive, governments have sought to link their markets with others, allowing credits to be sold across them. More buyers and sellers of emissions means more competition and less room for market abuse.

“If you have a very small market, what if nobody wants to buy your allowances? Just imagine you want to sell a used car or your cell phone or something,” Svyatets said. “If it’s just you and I in this market and nobody else, what if I don’t want your cell phone? What if I don’t want your car?”

But linkages introduce a problem seen in other cases of cross-jurisdictional common markets, like the European Union. When the Greek debt crisis struck that country in 2008, leaders at the European Central Bank found their hands tied when it came to monetary policy to relieve the nation’s ensuing recession. According to UCLA researcher Juliet Howland, linked emissions trading systems could face a similar problem in which one government “may not be able to regulate the price of carbon credits in order to prevent serious damage to [its] economy.” The MIT researchers found through their interviews that California’s system was intended to be flexible for linkages with other western states (which later abandoned their cap-and-trade ambitions), but were concerned that it could be hurt by linkages to weaker cap-and-trade markets.

Linked emissions systems don’t even have to be geographically close — California’s market is linked to the province of Quebec and soon to Ontario, while the European Union has started the process of linking its system to Australia’s. The thought is that in tackling a global problem, it doesn’t matter where greenhouse gas emission reductions happen as long as they happen somewhere.

But California has taken steps to ensure local benefits for its cap-and-trade program. Twenty-five percent of funds are automatically earmarked for high-speed rail, plus 20 percent go to affordable housing and 10 percent to transit systems. All revenues from the sales of emission credits on auction go toward programs that the state says promote public health, and by law, one-quarter of revenues must benefit “the state’s most disadvantaged and burdened communities.”

Those communities, it turns out, are some of the most affected by climate change.

California’s cap-and-trade system aims to reverse course on greenhouse gas emissions to help protect all communities from the harmful effects of global climate change. But despite its large potential impact, the program in practice is only secondary to the state’s more heavy-handed regulations.

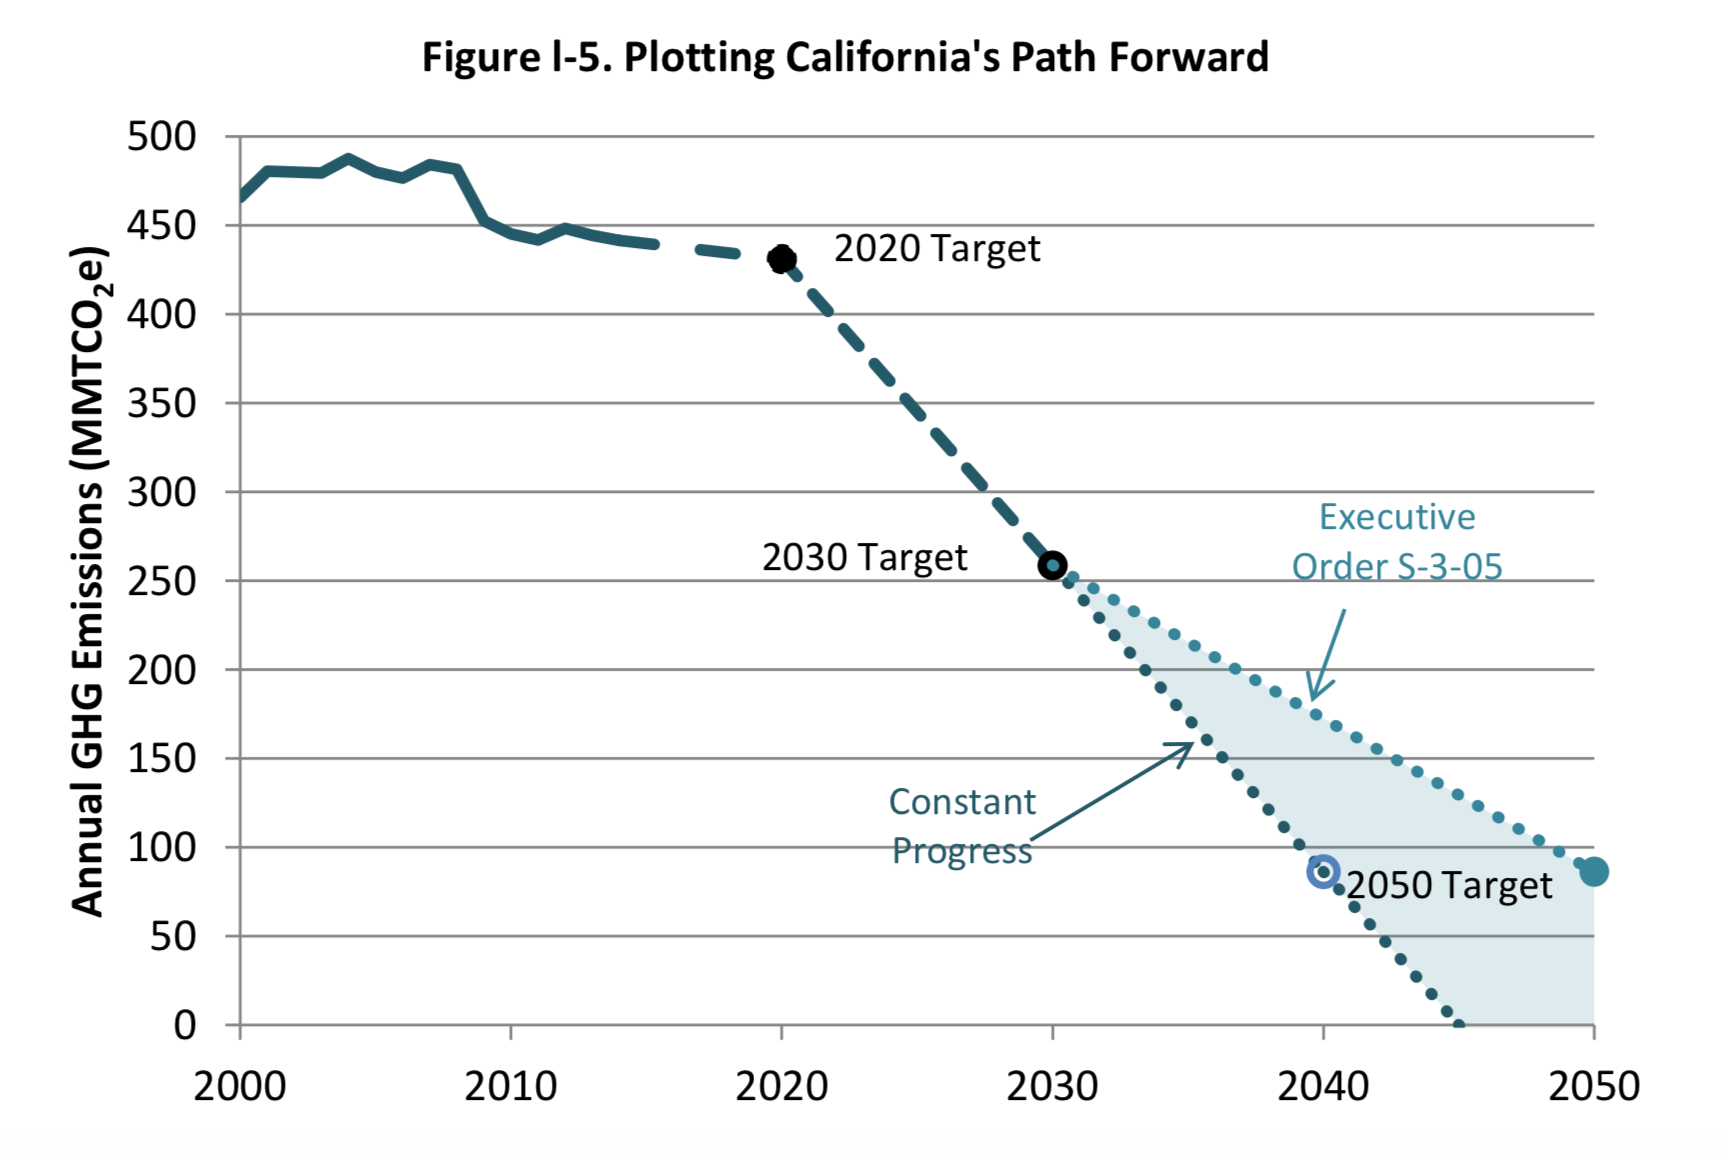
This chart from the California Air Resources Board’s 2017 Scoping Plan shows that potential statewide greenhouse gas emissions reductions under the continuation of planned policies would exceed those required under the governor’s executive orders.

That could change. The California Legislative Analyst’s Office found in 2017 that the state was on track to meet its 2020 emissions goal, but the 2030 target is much more ambitious and will require much more severe greenhouse gas reductions.

The cap-and-trade program will likely become more essential over time as the cap becomes increasingly tighter, but this will increase the burden on polluters too and potentially increase costs for consumers. The analysts estimated that some policies needed to reach the 2030 target could cost $300 per ton of carbon dioxide equivalent — or more than 20 times the current price for one allowance on the cap-and-trade market.

Who will be hit hardest by the cost of these reductions remains to be seen, and the impact on the economy is unclear. The analysts said long-term carbon prices depend on factors that are “highly uncertain,” and the state Department of Finance does not provide economic growth projections past 2020.

For now, the California Air Resources Board is working on a plan to reach its 2030 emissions goals. What comes out of those meetings will determine the future of California’s climate policy.

The Economic Side Effects of the Affordable Care Act on the Health of the Nation’s Economy

Disrupting America’s existing healthcare system was not going to be easy, but President Obama centered his legacy legislation around the effort. According to the Commonwealth Fund, “The Affordable Care Act (ACA) represents the most fundamental change to the structure of U.S. insurance markets in decades.” The disruption was a long time coming and the need for charge originally stemmed from many problems, but most notably, rising healthcare premiums. Please see the data below from The Commonwealth Fund which exhibits the rise in premiums over just 3 years:

Something needed to change and President Obama saw this market failure as an opportunity for intervention. When introducing the bill, President Obama articulated the reasons why the change was necessary at a speech in Maryland. He stated, “I knew that if we didn’t do something about our unfair and inefficient health care system, it would keep driving up our deficits, it would keep burdening our businesses, it would keep hurting our families, and it would keep holding back economic growth.” Fast forward to 2017. Looking at the healthcare system before the implementation of the Affordable Care Act, and now 7 years later in 2017, there have been notable market effects that are worth looking into.

First, the Affordable Care Act introduced more patients into the healthcare market by expanding insurance to more people. Health Affairs summarized the way The Affordable Care Act expanded health insurance in three ways: “the expansion of Medicaid to cover the poorest segment of the population (those with annual incomes below 138 percent of the federal poverty level), health insurance subsidies on the new exchanges for low- and medium-income people (those with annual incomes of 100–400 percent of poverty) who lack access to employer coverage or Medicaid, and a mandate for the uninsured to buy coverage.” When there are more people in the market, subsequently there is more business for the market. According to an article The New York Times published just one year after the Affordable Care Act became law, it reported that the stock market actually performed quite well for hospitals, drug companies and for-profit health insurers and that “the S&P 500 Health Care Index rose by 24 percent over the last year, outperforming the overall stock market.”

However, with a growing pool of healthcare recipients, greater risk is inevitable. Before the Affordable Care Act, people with pre-existing conditions who did not have access to insurance from the government or their employers, did not have many options for gaining healthcare coverage. Now, those high-risk patients are qualified for insurance coverage under the law and put on an equal playing field with healthy patients. Although more people are getting coverage, the new people being introduced into the pool are mostly poorer, sicker people. The Kaiser Family Foundation looked deeper into how the addition of higher-risk people would fluctuate the existing premiums. “Prohibiting discrimination against people with pre-existing health conditions will tend to raise premiums as higher cost individuals who have previously been excluded from the market buy coverage,” Kaiser concluded but eased worry with the fact that “this may be offset by an influx of younger and healthier people, due to the ACA’s individual mandate and premium subsidies for low- and middle-income people buying insurance in new health insurance marketplaces (also known as exchanges).”

Secondly, not only has more risk entered the market, but new economic restrictions have been placed on the insurance industry. With more people and more insurance companies, competition within the market is heightened. The Supreme Court ruled in 2012 that states had the opportunity to opt of the Affordable Care Act’s Medicaid expansion. As a result, some state governments now have differing policies and rules for the insurance market. According to Kaiser, insurers are being more closely monitored by not only the federal government, but some individual state governments, including a cap on how much those insurers can make from coverage of individuals. Not only are insurers being restricted, but hospitals are as well. The New York Times reports that “hospitals are being hurt by a provision of the law that cuts their Medicare payments by $260 billion over 10 years, but they have benefited from having more insured customers who can pay their bills.”

So it seems the healthcare market has a way of naturally balancing what seem to be significant effects on its existing market, but of course with change, there are always winners and losers. So who is suffering the most for the greater good of all Americans? The answer:  Middle class, healthy Americans who already had health insurance before the Affordable Care Act became law. Yahoo Finance reported people who have already purchased insurance plans, because they could afford it or qualified for the existing coverage, had their coverage cancelled because it did not meet the new requirements by law of the Affordable Care Act. The market once again balanced out according to a study done by Health Affairs, concluding that most of the Americans who had to exchange their plans were probably going to switch anyway and were mostly likely getting a better a deal on their new plan than if they were to purchase it before the Affordable Care Act came into play.

Naturally, there are outliers in this situation. Brenda Laster, a 49-year-old self-employed, single mom of two living in Rogersville, Tennessee is one of the losers in this situation. She claims, “Blue Cross Blue Shield of Tennessee provided me with good coverage and access to good doctors and I didn’t want to switch. Now I am paying more for coverage and I don’t see a difference.” People like Brenda get the short end of the stick with the Affordable Care Act, but it seems as if it is a necessary evil to improve healthcare for all Americans in the future.

Kentucky has some similar cases as well. A spokesperson from the Majority Leader’s Office states that “middle class Kentuckians are hurt the most by the ACA because of the increasing costs. Because the costs keep rising, many of the healthy middle class individuals are leaving the market and paying the penalty instead.” This is bad for the middle class, but so many poor and sick Kentuckians, especially in the Appalachian region, are now getting access to insurance, which as mentioned before, is offset by the inclusion of younger, healthier people into the market. The healthy people are subsidizing the sick and those with pre-existing conditions, which is helping ease more people into the market, providing a way for the government to get involved and address some of the inherent problems President Obama mentioned earlier, without breaking their own bank.

On the opposite side of the spectrum, the sacrifice of some will pay off for our economy as a whole. The New York Times reported “the Department of Health and Human Services estimates that hospitals will save $5.7 billion in so-called uncompensated care costs this year because more people have insurance. And nearly three-quarters of those savings, $4.2 billion, has gone to the 25 states and the District of Columbia that expanded Medicaid at the beginning of 2014.” The temporary pain will be worth the long term gain for the healthcare market as a whole, because improvements have already been made. The New York Times also reported progress back in 2014 stating “the last few years have seen a significant slowdown in the growth of health spending. Across nearly every measure — medical price growthemployer insurance premiumsper capita Medicare spending — the amounts the country spends on health care have increased by much smaller margins than the nation is used to.” However, we have to take the decrease in health spending with a grain of salt. Kaiser conducted a study that found that “because GDP and inflation influence health spending with a significant lag, the effects of economic cycles on the health system are not always apparent from looking at such simple relationships.This study is essentially saying it is possible the Affordable Care Act could not be the only reason for the decrease in health spending and that GDP, inflation and even global economic trends can also play a role in that decrease.

For most middle class Kentuckians and Brenda Lasters of the population, it seems unfair but the pros will outweigh the temporary cons in terms of the Affordable Care Act having a positive economic effect on the healthcare market. The implementation of the Affordable Care Act was always going to attract political controversy because change usually does, but from an economic perspective, the data supports a mostly positive impact on the economy as a whole. After 7 years of the Affordable Care Act being embedded in the economy, alterations to the law would have a significant impact on all Americans. CNN gathered research from the Congressional Budget Office estimating that “repealing Obamacare would increase Medicare spending by $802 billion over 10 years.” President Obama’s legacy legislation had the intent of disrupting the current economic market and disrupt it has. Current debate of removing the law and replacing it will have just as much of an economic impact as introducing the Affordable Care Act in the first place.


How Military Spouses Play a Large Role in the Imperfect Labor Market

By: Libby Hewitt


There are many factors that go into unemployment. However, for one section of the population, unemployment essentially comes with the territory: the spouses of the nation’s military personnel.

The military spouse unemployment rate is a huge problem that is not being given the attention it deserves. Not only do military spouses feel the effects on their families personally when they are unable to find work or make an income, but there are societal impacts on the economy as a whole as well. Military spouses are a huge reason that many of our nation’s most respected individuals are able to fight for our country’s freedom. Without the support and help of their spouses, many of them would not be able to fulfill deployments and other responsibilities that come with being a service member.

A survey from Hiring Our Heroes, a US Chamber of Commerce foundation, found that of all military spouses, of which there are over 226,000, 92 percent are female. The unemployment rate for these people is 16 percent, which is four times the rate for all adult women in this country. Of the military spouses that are employed, 14 percent are working part-time jobs, and half of that group wishes to be working full-time. Even those military spouses with a bachelor’s degree who do find work often make 40 percent less than their civilian counterparts.

Source

Many factors that make it harder for military spouses to find steady work, the main one being the frequency of moving that takes place for a military family.

Nan McCarthy, the spouse of a former Marine Colonel, spoke about her experience with the job market when her husband’s job took them to Japan in 1983.

“I was extremely lucky to find a job in Okinawa at a magazine,” said McCarthy. “The job needed someone who could speak English, so I had an advantage there, even though I was competing with a lot of other military spouses for the job.”

While she enjoyed her time working and was able to put her college degree in advertising to some use, McCarthy said her salary was nothing to write home about.

“The magazine job in Okinawa was great experience, but I was severely underpaid,” she said. I earned 500 Yen per month (the equivalent of $6,000 per year at the time), which was still practically nothing, even back then.”

When the McCarthys made their next move to Quantico, Virginia, in 1986, Nan found part-time work as both a daycare center assistant during the day, and a clerk at a Hallmark store during the evenings. She faced similar difficulties in both workplaces.

“I remember specifically talking with the owner of a clothing store next to the Hallmark card store where I worked,” she said. “He expressed interest in hiring me, but once he found out I was a military spouse he said he wasn’t hiring. I could not find full time work.”

Even though the numbers and prejudice business owners have against this population is alarming, the huge economic impact these unemployment rates are making should be paving the way for change in the future. This problem needs more attention from policy makers, employers and other civilian workers in general in order to make any progress moving forward.

In 2011, Michelle Obama and Jill Biden started The Joining Forces and the Military Spouse Employment Partnership, organizations that helped push through legislation allowing military spouses in fields requiring licenses like teaching, nursing and law to transfer those licenses easily from state to state as they move. This effort has created about 15,000 jobs available near military bases. According to Government Executive, companies involved in this new program include Hilton Hotel call centers, customer service positions at places like Arise Virtual Solutions, and other marketing and communications companies like Agility Marketing that allow work-from-home employees. The Joining Forces initiative has made over 54,000 jobs available to military spouses to date.

Additionally, further pushes for a fair labor market have been set in motion with sites like usajobs.gov, which helps military spouses in applying for federal jobs. While these initiatives are helping move this issue in the right direction, it seems as though further programs could be put in place to help military spouses by utilizing technological advancements like the internet, apps, and more that offer work-from-home options.

Apart from just improving this group’s quality of life and ability to provide for their families, it seems obvious that the benefits would outweigh the costs of tackling this unemployment problem for the country as a whole.

The unemployment issue with military spouses is affecting not just those individuals and their families, but also the U.S. economy altogether. In fact, a study commissioned by the nonprofit Blue Star Families determined that the economy is losing between $710 million and $1 billion each year because of military spouse unemployment. This number is mainly made up of the loss of income tax that spouses would have paid, totaling between $578 and $763 million, but this is only part of the loss the economy would suffer. If all of the over 200,000 military spouses were being properly utilized in the labor market, the economic losses would be much less severe.

Many military spouses are on a constant hunt to find a remedy to their unemployment problem. Some have even found that the best solution is to start their own business, whether that be utilizing their personal talents like art, writing, etc. or starting an online store selling jewelry, clothes and more. Many military spouses are looking for ways to incorporate their personal knowledge from their degree into the work force wherever their spouse has been stationed.

“Tons of military spouses are taking matters into their own hands by starting their own companies and hiring other military spouses,” said McCarthy, referencing companies like R. Riveter, which was founded by two military spouses and remotely employs other military spouses across the country to create custom handbags – some of which are made from repurposed military uniforms.

It took years of frustration, lack of employment resources and low pay for McCarthy to discover that the best way for her to become most effective in the labor market was to be self-employed. McCarthy launched her own publishing company, Rainwater Press, in 1992 and has since written, edited and published several novels.

“Being self-employed is an excellent solution for military spouses,” she said. “As a self-employed writer/editor I could do my job from any location and moving around didn’t impact my ability to work, other than requiring me to take time off to manage the moving process each time we moved.”

However, as ideal as it would be for every military spouse to have a personal talent or hobby that could garner a full-time business and income, that notion is simply unrealistic for many military spouses. This is where a large part of the problem lies. The work-from-home jobs and increase in military spouse-friendly companies are helpful, but there are even more difficulties military families face when moving so frequently, like the loss of so much potentially billable time.

As McCarthy mentioned, managing the moving process of each new location took more time and is an additional hardship that civilian families do not have to face.

“Every time a military family moves, someone needs to spend at least two months on each end of the process preparing for the move and then settling into the new location,” she explained. “And that someone is almost always the military spouse because the service member is either deployed or otherwise unavailable to help due to his or her job.”

These transitions into and out of locations cost not just time, but money as well.

“I’ve calculated that each of our moves cost me about 4 months of income,” McCarthy said. “So out of the 7 times we’ve moved, that’s at least 28 months of not earning outside income.”

Obviously, this problem is far from solved. However, with more and more companies willing to hire military spouses, the introduction of policies that are helping this population find jobs and maintain their licensing, plus the overall awareness of the country about the issue, the military spouse unemployment problem will hopefully be lessened in the coming years.

As for suggestions moving forward in reference to military spouses, McCarthy says:

“People just need to continue raising awareness of military spouse underemployment and compensation inequalities. They need to be educated that the breadth and variety of experience of military spouses is a positive thing, rather than a negative. People need to understand that by supporting military spouses, they are supporting our military.”

Should Americans Kick Shoe Tariffs?

nike-rereleases-forrest-gump-nike-cortez-colorway-2-202x300Last year, Nike brought back their Air Cortez sneaker in the White/Varsity Royal-Varsity Red color scheme– the very same style Tom Hanks was seen donning in the 1994 movie Forrest Gump. Producing this shoe is incredibly labor-intensive– its leather stitching, exposed padding on the nylon tongue, and crisp white laces have undoubtedly been produced in one of hundreds of Nike’s manufacturing plants outside of the United States. However, a significant portion of what consumers pay for when purchasing shoes like the “Forrest Gump sneaker” go not only towards manufacturing costs, wages, and shipping, but also tariffs and shoe taxes. Unbeknownst to many, outdated shoe tariffs have been contributing to the rising costs of shoes and have led to many Americans, like Forrest Gump, running their shoes into the ground.

With a globalized economy and companies increasingly outsourcing plants to take advantage of cheaper labor, brands produced in the United States have difficulty competing with low prices. In order to counter the low costs of the textiles and apparel imports, the United States government has imposed tariffs of up to 67.5 percent compared to an average 1.4 percent on most other goods to protect the United States’ dwindling domestic manufacturing supply chain (The Hill). However, with only one percent of shoes manufactured in the United States, American consumers could be the ones suffering the burden through unnecessarily high costs of shoes.

The shoe tariff was created in 1930, when the United States boasted a large domestic footwear manufacturing base (The Hill) that needed protection from foreign companies. Back then, footwear manufacturing was even more labor intensive than it is now, with each stitch handmade and leather meticulously done. Numerous European craftsmen brought with them knowledge and credibility in the art of shoemaking, which helped the United States manufacturing base flourish. Since the rapid globalization of the shoe industry, cheaper labor across seas made manufacturing in the United States less practical. Today, European shoemakers are not competing with the United States for shoe manufacturing, but counterfeits and cheaper goods from countries like Vietnam and China.

Generally, imposing high tariffs are meant as a supportive measure for the domestic manufacturing market. Raising prices of incoming goods keeps prices competitive for imports and domestic products, thereby encouraging United States consumers to continue supporting the United States economy on a local level. In the United States, over 99 percent of shoes are imported, mostly from Asia (Wall Street Journal). However, these tariffs still exist to protect the remaining one percent, whilst most Americans cannot name one American shoe companies manufactured in the United States.

An example of a company benefitting from the high tariffs is New Balance, an American sneaker company, and one of the last to continue manufacturing in the United States. Even New Balance, however, says that it is struggling to keep manufacturing in the United States. Though Robert DeMartini, CEO of New Balance, insists on keeping manufacturing in the United States, stating that New Balance’s U.S. plants are “twice as effective” as Asian plants, and that “we learned a lot because we had to in order to survive” (Wall Street Journal), the company is still facing difficulties to keep work at home. Manufacturing in the United States costs 25 to 35 percent more than to manufacture abroad in Asia (Daily News), and a majority of New Balance’s shoes have parts manufactured outside of the United States. In fact, the company manufactures two-thirds of its shoes across waters and relies heavily on machinery in order to keep costs low. Though the main argument for maintaining the high shoe tariffs is to keep manufacturing jobs at home, are they simply supporting jobs that we can no longer afford to keep in the United States?

Nike is one company protesting the high tariffs. Nike claims that current money going towards tariffs and taxes could go towards research and development advancing sustainability and innovation. The company argues that lowering tariffs can actually increase manufacturing jobs in the United States by allowing the company to develop advanced manufacturing methods that would make keeping jobs in the U.S. more practical. However, many Americans are skeptical of Nike’s promises to create jobs if tariffs are cut, especially as the company continues to move jobs overseas. Lori Wallach, the director of Public Citizen’s Global Trade Watch, is one skeptic. She says, “Nike’s job creation claim mimics the broken job creation promises that multinational corporations have used to push for past controversial trade pacts, only to turn around and offshore U.S. jobs after the pacts took effect” (NPR). Though Nike is viewed as having the financial and political backing to end shoe tariffs in the United States, the reality is that many Americans would rather trust a company like New Balance on an issue concerning American jobs due to its positive association of being made by Americans, for Americans.

footwear-tariff-pic-impacting-childrens-shoes-1024x829The 99 percent of shoes manufactured abroad pay a significant portion of their budget towards shoe taxes, which in turn ups the prices of shoes for unsuspecting Americans. Shoe tariffs are enforced based on shoe classification, which are assigned in a complicated process based on the shoe material, function, target gender, size, construction, and value. Generally, shoes that are more likely to have been produced through cheap, foreign labor have a higher tariff imposed. These shoe tariffs range from zero percent for men’s golf shoes, to 84 percent for cheap sandals and are implemented by volume, per shoe (Harmonized Tariff Schedule). Annually, these shoe tariffs provide an additional 2.7 billion dollars for Congress (NPR). Because most Americans purchase 7.3 pairs of shoes annually each regardless of age, the estimated 2.4 billion dollars that Americans could be saving according to industry analysis could be going towards other household expenses.

Due to the fact that shoe tariffs disproportionately affect prices on the cheapest shoes to manufacture — children’s shoes and low-cost-to-produce sneakers, the Americans hit hardest by shoe tariffs are often those who cannot afford to pay the extra costs. According to Economist Bryan Riley, shoe tariffs increase costs of the cheapest shoes by about one-third. For example, if shoe tariffs were removed on a $10 shoe, they would be reduced by $3. This in turn impacts how families living paycheck-to-paycheck end up spending money in other household necessities like groceries. Purchasing goods and services to support their children and their family’s health are affected unnecessarily.

Though the 1930s shoe tariffs were intended to protect the United States shoe manufacturing industry, the tariff is now outdated as American manufacturing work has since traveled overseas. Americans are left paying the costs of keeping a slim number of manufacturing jobs at home. Most Americans are unaware of the shoe tariffs, and with companies like Nike and New Balance arguing both sides of whether or not to keep them, Americans who are informed are decidedly split on the issue. As tariffs come to the forefront of politics, it will be interesting to see whether or not Americans decide to kick the tariffs costing them so much.

Sources:

New Balance Opposes Push to End U.S. Shoe Tariffs

https://hts.usitc.gov/?search_txt=shoes&query=shoes

Importing Shoes : HTS Shoe Import Duty and Shoe Tariffs

http://fdra.org/key-issues-and-advocacy/legislative-initiatives/

http://www.usalovelist.com/american-made-shoes-ultimate-source-list/http://www.aei.org/publication/the-us-has-imposed-protective-shoe-tariffs-on-americans-for-decades-even-with-no-domestic-shoe-industry-to-protect/

The Economy and a Pair of Shoes

http://www.npr.org/sections/itsallpolitics/2015/05/08/405196569/would-lower-shoe-tariffs-actually-encourage-american-jobs

http://thehill.com/blogs/congress-blog/economy-budget/264019-footwear-needs-tariff-relief

http://www.wsj.com/articles/SB10001424127887323764804578312461184782312

http://money.usnews.com/money/personal-finance/articles/2011/10/28/how-consumers-and-communities-can-benefit-from-buying-local

http://www.usnews.com/opinion/blogs/economic-intelligence/2012/09/21/the-wasteful-culture-of-forever-21-hm-and-fast-fashion

http://www.forbes.com/sites/danikenson/2013/07/23/textile-protectionism-in-the-trans-pacific-partnership/#275d91d593a8

http://www.wsj.com/articles/SB10001424127887324735104578123523795505336

http://hypebeast.com/2016/7/nike-classic-cortez-og-forrest-gump

Brexit and Breadwinners: What leaving the EU means the future of the UK workforce

Behind the Vote

Brexit. A term that filled newsrooms, Facebook feeds, and local pubs all summer long.

It’s the word that became a reality on June 23rd, 2016, when the UK voted to revoke its membership from the European Union with a 52% majority vote. The decision sent shockwaves around the world, as countries questioned what the future of Europe would look like. With such a slim victory margin from the “Leave” campaign, the decision was highly controversial and has continued to cause political, social, and economic anxiety in the months since.

The official campaign for Britain was called Vote Leave, and was built on the notion that the UK had to leave the EU in order to protect its borders, strengthen its economy, and increase employment and wages for British nationals. Immigration was one of the most important components of the Vote Leave campaign, as proponents argued that until the UK had full control of its own immigration policy, it would not be able to handle the influx of European immigrants that arrive each year. However, according to the Office for National Statistics, of the 636,000 people who immigrated to the UK in 2015 only 270,000 were EU citizens. “Leave” voters also argued that immigrants were driving down wages in certain sectors and taking away many low-level jobs from British workers.

As for the economy, “Leave” voters claimed that Britain’s ties to the EU were preventing it from formulating trade relationships in emerging markets, such as China and India, where there is no major trade deal at present. Furthermore, these voters argued that leaving the EU would not affect London’s position as one of the world’s leading financial centers nor would banks relocate their headquarters. This is largely because Britain has very low corporate tax rates. Lastly, the Vote Leave campaign argued that an exit from the EU would mean that UK tax payers would no longer have to subsidize and bail out European countries that use the Euro and already have a majority in the Union. Instead, this money would be used to fund and support domestic issues such as the education system, NHS, and affordable subsidized housing.

picture1

“Remain” voters, however, argued that Brexit would seriously hurt UK trade levels and foreign direct investment. These voters believed that a decision to leave could prove extremely challenging for the UK, as it would sever the existing economic, social, and political relationships that it had with many EU nations. As for the question of jobs, the “Remain” side claimed that around three million jobs were linked to the EU which, if taken away, would destabilize the economy. Additionally, “Remain” voters insisted that businesses would be less likely to invest in the UK if they were not in the EU. This would be extremely disruptive because, according to a report by the Bank of England, foreign direct investment accounted for 10% of UK’s assets and liabilities in 2015 equaling around £10.6 trillion ($13.1M). The feeling of uncertainty surrounding Brexit was clearly felt in the UK’s financial market in the months leading up to the vote, as the Financial Times reported that UK investment declined by 2.1% in the final three months of 2015, despite growing by an average of 1.4% in the previous quarter.


 UK Job Market on the Ballot

 The implications of Brexit on the workforce was a key issue heading into the vote. Many economists argued that a decision to leave would trigger an economic downturn in the UK which could significantly weaken the British pound and lower employment levels. The British Treasury released a report in May 2016, which claimed that if Brexit were to happen, unemployment would be 520,000 higher, wages 2.8% lower and house prices 10% down. These statistics demonstrate why there was a high anxiety throughout the UK, as economists and citizens alike were trying to predict what the future of the UK may or may not look like.

picture1


However, because no other country had left the EU before there was no precedent for economists to compare the UK with. This meant that many of the arguments from both sides involved an element of speculation.

When the European Union was formed, it was created with the idea that there would be “free movement of labor” across all member nations. This meant that any citizen of the EU would be able to travel to Britain and seek employment without any formal job offer. Therefore, “Leave” voters viewed Brexit as an opportunity to gain back the jobs given to those immigrants and to increase national employment levels. According to research by Oxford University’s Migration Observatory, as of June 2016, there were 2.2 million EU workers in the UK composing for 6.6% of the total workforce.

The referendum drove voters to ask serious questions about long-term job security and availability. Would Brexit make it easier for young people to find jobs in the UK? Would wages increase as the result of a decreased supply of labor? What would happen to those jobs of migrants forced to leave? Where will the UK stand in terms of the international workplace?

Some economists predicted that in the short term, companies would choose to either transition their operations overseas or put a hold on hiring new employees until there was more economic certainty. The “Leave” campaigners argued that certain sector jobs, previously given to migrants, would now be available to British nationals.

However, there is very little evidence proving that immigration lowers wages or increases unemployment. According to Jonathan Wadsworth, an economist at the Center for Economic Performance at the London School of Economics, he says: “there is still no evidence of an overall negative impact of immigration on jobs or wages.” His claim was further supported research published by the UK Office for Budget Responsibility in 2015, which found that there was a small negative effect of migration on wages of workers in the semi-skilled and unskilled service sector such as shop assistants and restaurant and bar workers.


But do UK nationals really want those jobs?

While many argue that that Brexit will supply a large number of low-level jobs for UK nationals, the question must be asked of whether or not people are actually going to be willing to take them.

As seen below, EU workers are predominantly industry based with the manufacturing, retail, and health services accounting for the largest number of workers. Because the UK relies heavily on migrants to fill these low-skilled roles, the vote brought anxiety to employers in these industries, as they had to determine whether or not they will be able to fulfil their quotas if their workers were to be deported because of Brexit. While “Leave” campaigners argued that British nationals would seek these jobs if the referendum happened, “Remain” voters countered this by saying that British workers had not sought out these jobs before… so why would they now?

picture1

Amy Smith, a student at the University of Sheffield, expressed her concern, saying:

“Having grown up in Germany, I witnessed the benefits of immigration first-hand. Immigrants are vital for filling the low level positions German natives are less willing to take. I think the UK needs to recognize that the same implications can and will happen here.”

This issue was further discussed by economist Jonathan Porte, who described the demand for immigrant jobs as not being just a zero-sum game. In an article published by the Guardian he explained, “it’s true that, if an immigrant takes a job, then a British worker can’t take that job – but it doesn’t mean he or she won’t find another one that may have been created, directly or indirectly, as a result of immigration.”

Porte’s argument stands exactly opposite to that of the Vote Leave campaign, as he argues that a rejuvenation in the UK workforce will not occur simply by deporting migrants. Rather, it will happen with innovation and the exchange of ideas – which are a direct result of migration.


 Current State of the Workforce

 It has been four months since the vote, and economic numbers are showing more promise than expected. Although there was fear from the ‘remain’ voters that a decision to leave the EU would cause widespread job losses, economic data following Brexit is saying the opposite.

picture1

October figures from the Office for National Statistics (ONS) show that the UK unemployment rate remains steady at 4.9%, its lowest rate since 2005. According to the Guardian, this number remained unchanged since August, despite a 10,000 increase in unemployment.

Furthermore, the employment rate has remained at a record high of 74.5%. However, employment growth slowed from 173,000 in the three months leading up to July to 106,000 in August, with a large proportion of these being part-time workers.

So with these economic forces showing positive signs for the UK, does this mean that the workforce still has to worry?

Maybe not so fast.

While UK employment continues to rise, the country has seen a sharp rise in inflation which poses a major threat to job levels and wages. According to the ONS report, the UK’s inflation rate increased from 0.6% in August to 1% in September – the highest it has been since November 2014.

The issue of inflation is further exacerbated by the decreased value of the pound, which hit a new 31-year low against the dollar in October, and now exchanges at $1.22. This is largely driven by the uncertainty surrounding the terms of Britain’s exit from the EU, as financial markets lack confidence in the UK’s long term economic prospects.

An increase in inflation could potentially affect the UK’s unemployment rate going forward, as market anxiety can lead to decreased investment and lower economic growth in the workforce.

Furthermore, because the drop in the pound’s value has increased the cost of imports for British manufactures, certain sector jobs may be taken away as companies adjust to higher costs and decreased demand for goods.

But for now, until an official decision is made on Brexit’s terms, workers and immigrants across the UK must patiently wait… and hope that the decision to leave didn’t take their jobs with them.


SOURCES:  

https://www.ft.com/content/953671ba-b784-37f6-8f29-45402e846d50

https://www.theguardian.com/business/2016/aug/17/uk-unemployment-claimant-count-falls-after-brexit

http://www.telegraph.co.uk/business/2016/08/19/what-brexit-apocalypse-no-sign-of-economic-woe-after-the-referen/

http://www.independent.co.uk/news/business/news/brexit-uk-economy-eu-referendum-result-jobs-employers-hiring-a7191381.html

https://www.ft.com/content/3d0de756-1764-11e6-b197-a4af20d5575e

http://www.independent.co.uk/news/uk/politics/points-based-immigration-system-theresa-may-explained-brexit-referendum-australia-a7227001.html

http://www.voteleavetakecontrol.org/why_vote_leave.html

http://www.telegraph.co.uk/business/2016/06/28/brexit-will-foreign-investment-dry-up/

http://www.bankofengland.co.uk/publications/Documents/speeches/2015/euboe211015.pdf

https://www.ft.com/content/cca62354-e052-11e5-9217-6ae3733a2cd1

http://www.ons.gov.uk/peoplepopulationandcommunity/populationandmigration/internationalmigration/bulletins/migrationstatisticsquarterlyreport/may2016

https://www.ft.com/content/0deacb52-178b-11e6-9d98-00386a18e39d

http://ukandeu.ac.uk/fact-figures/where-do-eu-migrants-in-the-uk-work/


The Student Debt Crisis: How Your Degree is Causing Economic Unease

The Problem

Pursuing a degree in higher education is often romanticized. Education is revered as the investment of a lifetime, and a staple of the American dream. However, the price tag associated with this dream has either left millions in anxiety-inducing debt or deterred people from pursuing a degree at all.

In 2016, The White House released a study that evaluated the benefits and challenges of student debt. According to the study, “the average full-time worker over age 25 with a bachelor’s degree earns nearly $1 million more than those with a high school diploma.” Therefore, those with more debt due to pursuing a master’s degree, M.D., or J.D. will have greater ability to pay off their debt over time. This should make us feel better; it is statistically proven we will not be in debt forever. Despite this, it might as well be forever as paying off student loans can take decades. Additionally, the benefits of a degree still do not justify the rise in student debt, as there are many issues within the Federal system of student loans.

According to the “Student Loan Servicing” report by the Consumer Financial Protection Bureau (CFPB), student loan debt is up to $1.2 trillion (a decade ago it was $300 billion,) spread among 40 million borrowers, with an average debt of $30,000 per borrower. The annual report “Trends in Student Aid” by the College Board, revealed a 48% increase in loan borrowing from 2000-01 and 2005-06 (in inflation-adjusted dollars.) This increased to 65% by 2010-11. Although loan borrowing decreased by 23% from 2011-12 to 2015-16 student debt has only continued to increase.

screen-shot-2016-11-04-at-5-15-02-pm

Looking at those who received their degree from a public four-year, the average debt level went from $11,300 in 1999-00 to $15,900 in 2014-15, a 40% increase overall. For a private four-year, the average debt went from 15,000 in 1999-00 to 19,900 in 2015-16, a 32% increase overall. Those who did not complete college had even higher debt averages.

screen-shot-2016-11-04-at-5-26-39-pm

To some, it is too soon to call the student loan debt issue a crisis. The White House study acknowledges there are changes to be made, but public concern should be low. Additionally, economists such as Joel Elvery from the Federal Reserve Bank of Cleveland agree with this. According to the CFPB, the average monthly payment for those in the 20 to 30-year-old range is $351. Despite statistics like this, Elvery believes that post-grad earnings and repayment options offset these charges.

So how did we get here? Why has this happened? I will do my best to answer these pressing questions. However, the most important question is why should you care? If everyone eventually pays back his or her student loans, how does this affect the economy?

The Economy

If you take a step back and look at the big picture student loan debt affects everything in one way or another. Consumer spending and the housing market are the main concerns. Barbara O’Neill, a specialist in financial resource management for Rutgers University, believes student loan debt has slowed down the economy. As student loan payments become a priority, major life decisions (aka the ones that cost you the most) such as purchasing a car, and buying a home are put off for longer spans of time. Living to witness the entire U.S. financial system collapse does not help one’s views on financial well-being. If people doubt their financial ability, it is only logical that frugality will be the result.

The Census Bureau revealed that the housing market has dramatically shifted from owner-occupied to renter-occupied, which is mostly thanks to millennial’s (the most recent college graduates.)

screen-shot-2016-11-07-at-12-17-39-am

When looking at homeownership trends, the Federal Reserve found that fewer 30-year-olds have bought homes since the recession. Millennial’s join the work-force, wages rise, but purchases of single-family homes were down 6.0% in May according to the Commerce Department. Although this rose in September by 3.2%, the combination of high housing demand and low supply (you can only build so many homes) has increased housing prices.

One of the largest investments Americans will make in their lifetime is the mortgage. Mortgages are an important part of our GDP, and if purchasing of mortgages continues to decrease, there are consequences. For example, those who are currently trying to sell their homes are forced to sell below value, or worse off, not sell at all. We can’t blame millennial’s and their student debt entirely for issues in the housing market. Nonetheless, there is no denying that millennials are the future of our economy, and their halt in spending will have long-term negative effects.

Another concern is the fact that not everyone pays back student loans. In 2015, The Federal Reserve Bank of New York performed an analysis on repayment. They found that only 37% of borrowers were actively making payments, and 17% were delinquent. From the pool of borrowers that were struggling, 70% were from lower income zip codes. However, 35% of people from higher income zip codes also struggled with repayment. Higher delinquency rates are associated with not finishing school, but default rates still exist for those who did complete school. The highest percent of people who default (35%) have loans for $5,000 or less. This just goes to show that everyone is struggling with student loan debt in some shape, way, or form. It’s not fair to blame the borrowers entirely when all they wanted was the opportunity to get an education. Allowing more access to student loans was a good idea overall, but it is time we face the reality that the government may have been too generous.

The Screwed Up System

The main problem with student loan debt is that as tuition prices rise, a number of loans distributed must rise too. It is a continuous, vicious cycle. Private universities who have strong financial aid programs claim the right to have high tuition prices to make up for the deficit of those covered by aid. The problem is no better in public universities. Back in the 1970’s, public four-year institutions were the cheapest alternative. Although they are still cheaper than private universities, it is unknown how long it can stay this way. According to the College Board’s “Trends in College Pricing” from 1986-87 to 1996-97 there was a 3.9% average annual increase in tuition; from 1996-97 to 2006-07 there was a 4.2% increase, and by 2016-17 a 3.5% increase. As you can see, this is a pretty steady increase per year. Today, tuition plus room and board at a public four-year costs around $20,000, when it was closer to $10,000 in 1996.

screen-shot-2016-11-07-at-4-37-53-am

One of the reasons for this is the decrease in state funding. According to the Center on Budget and Policy Priorities, the average state is spending 18% less per student post-recession. The worst part is that these tuition spikes only make up for the deficit due to less state funding. The opportunities for students are not as plentiful as they could be when faculty must be fired to make a tight budget work.

A more obvious reason for tuition increase is economics 101: supply and demand. As more people enroll in college, the demand goes up. Despite there being plenty of colleges for every American, the supply or availability of spots at high ranking universities decreases. Colleges love to see how much they can charge before demand goes down. So far, we have all given into this experiment and paid the price. Additionally, the promise of a wonderful education from an affordable state school creates even more demand, but at some point, there must be cut-offs.

Finally, the main concern is the system itself. According to U.S. Department of Education, undergraduate students are allowed to defer loans if they have half-time enrollment in school, graduate school, face economic hardship, or a period of unemployment. Deferment is available for up to three years in most cases. Although this is a way to help students, some students use it as a way to put off loan payment for long periods of time. The current interest rate for direct loans is 3.76%. However, if the average borrower has $30,000 in undergraduate loans, $40,000+ in graduate loans, and interest, this can lead to repayment issues. Perhaps not default in every case, but it only takes a few late payments to hurt your credit score. If your credit score drops, eligibility for other loans such as for cars and mortgages are negatively affected.

Thankfully, there are precautionary measures that exist. The Obama Student Loan Forgiveness program provides many solutions for loan repayment. This includes income-based payments and interest rate reductions. Better yet, loans can be forgiven after 20 years if enrolled in the corresponding payment plan Pay As You Earn. Even with options of Pay As You Earn, the people in lower income regions are the ones who are still struggling with repayment. All these preventative measures will likely help, but it will take years to see the results. If tuition continues to rise at a steady rate, the need for student loans will increase ten-fold, and only so many steps can be taken to aid students in repayment.

There is no perfect solution, but ideally, putting tighter restrictions on loan availability and deferment could lower student loan debt. In addition, many borrowers are not fully aware of the binding loan contracts they are signing. If our high schools prioritized loan counseling as a part of college advisement, students may feel less inclined to borrow or make the effort to attend a more affordable university. Student loan debt is something that will most likely haunt us for decades to come, but hopefully, a decrease in student loan debt over time will jumpstart the economy. The economy may be doing well now, but the reality is the student loan debt crisis is a bubble waiting to burst. If we can decrease student loan debt, then the spending habits of young adults will also change and therefore increase long-term economic stability.


Is A Rising China More Appealing Than U.S.?


“I miss the price of my hair service in Beijing,” said Yuyuhou Li, a graduate student from the University of Southern California studying Strategic Public Relations, after her recent pricy experience in Korean Town. The total cost of having her hair dyed was “about $280, including tips.” In other words, having her hair dyed once in Los Angeles equals to three hair-dyeing appointments at a similar salon in Beijing.

No wonder it seems that living in America is quite expensive, at least in most Chinese people’s eyes. China’s economy is growing at an impressive pace. In the past decade and half, China has risen from ranking second in the world in nominal GDP, to pulling itself from poverty at least in its southern coast. “Made-in-China” label is being used worldwide and the grand hosting of the Beijing Olympic Games shows China’s economic power. Even the great Uncle Sam started to fear the rising eastern star.

Meanwhile, in the hopes of receiving a better education and a better life in the future, Chinese students are rushing to pursue academic degrees in the United States. The most recent figures, from the 2014-15 academic year, show that 304,040 international students in the US hailed from China – far more than from any other country, a 10.8% higher than previous 2013-14 academic year.

education


Faced with the army of ambitious up-and-coming Chinese professionals, are Americans worried? Yes, they are. The loss of jobs is one of the top three problems that are rated as a very serious problem by approximately 60 percent of the American public, according to a survey in 2015.

u-s-perceptions-of-china-report-03

Undoubtedly, China is in need of fresh blood for a consistent and steady growth. On the one hand, China is experiencing its reorganization and optimization in industrial structure from labor-intensive industry to high-tech industry. Without those young talents, the process will be much slower. On the other hand, China’s rising wages calls for increasing productivity, which cannot be achieved without technological advancement. Therefore, enticing young talents to come back and contribute is significant.

However, a massive loss of talent for China is endangering the long-term development of the rising country. An estimated number of 2.64 million Chinese have moved overseas to study since 1978, but only 272,900 students returned to China over the forty years, according to the Ministry of Education. Moreover, a 2014 report by Oak Ridge Institute shows that 85 percent of the 4,121 Chinese students who received doctorates in science and engineering from American universities in 2006 were still in the U.S. five years later. The stay rate was 98 percent a decade earlier, which actually marks an improvement.

Such a brain drain seems to indicate that living in the States are more appealing than living in China, especially for a young and upcoming generation. How to make a decision when choosing a country to live and work? Living in an affordable place and working in a promising place are two important factors.

Living Cost & Purchasing Power Parity (PPP)

Pick up an apple from a Walmart in Shenzhen, one of the most developed coastal cities in China, and read the price tag carefully. Those lovely red apples are sold at ¥4.98 (=$0.75)per 500g. Now let’s move the scene to a Walmart in Los Angeles, where a large price tag reading $2.47/lb ($2.24 per 500g) sits on top of those made-in-America apples.

It is not uncommon to see an almost triple price difference between consumer products made in the most developed cities in China and those produced in America. A box of 12 cage-free eggs are sold at ¥12.9(=$1.93)in the Shenzhen Walmart, while eggs in the LA Walmart are more than double that price. Not only groceries, but also basic necessities such as toilet paper and laundry detergent suffer from the huge price gap. For example, Tide detergents of the same size in both China and the US do not break the spell of the three-times price difference.

Both Shenzhen and Los Angeles are coastal cities with a high volume of port trade and technology-intensive industries. However, as the chart below is shown, people would need around ¥35,143.95 ($5,266.80) in Los Angeles to maintain the same standard of life that they can have with ¥21,000.00 ($3123.60) in Shenzhen (assuming you rent in both cities). As the chart below shows, Shenzhen’s living cost is higher than Beijing’s, but still falls way behind Los Angeles’.

cost-of-living-index

(Source: Numbeo)


Purchasing Power Parity (PPP) plays a vital role in evaluating the living cost in the respective country. PPP is arguably more useful than nominal GDP when assessing a nation’s domestic market because PPP takes into account the relative cost of local goods, services and inflation rates of the country, rather than using international market exchange rates, which may distort the real differences in per capita income.

According to the International Monetary Fund, China’s economy surpassed the U.S. in purchasing power for the first time in 2014 and continued to rank in first place in 2015.

ppp

(Source:IMF)

With the same amount of money, you can enjoy more goods and services in China than in the United States. For example, Yuyuhou Li can buy the same detergent and enjoy similar hair dyeing services in both Shenzhen and Los Angeles; but in China, where labor and rent are lower, dyeing her hair and purchasing basic daily necessities cost much less than she pays in the U.S.

This round, China beats America by a huge margin.

Per Capita Personal Income

“If I am making money in dollars, living in the United States won’t be that expensive,” said Yutian, Li, a graduate student studying in USC with a major in computer science. There’s no doubt that computer science is one of the most well-paid jobs in the United States. But earning dollars and spending yuan is very tempting because the exchange rate between the yuan and dollar is more than 6:1.

“You earn a lot less money in China, but you can save more,” said Robert Little, who used to teach English at the University of International Business and Economics in Beijing. “America is much more expensive to live in because the cost of living is much higher,” he added.

The National Bureau of Statistics of China reveals that the average per capita personal income in Shenzhen was 73,492 yuan (=11,010.45USD) in 2014. The latest data shows that the average per capita income in Los Angeles County is 42,042 USD, almost 4 times higher than in Shenzhen.

If we divide the items sold at the Walmart in both cities by the average per capita personal income, interestingly, the percentages are so similar.

  Los Angeles Shenzhen
Apple 0.006% 0.007%
Egg 0.01% 0.018%
Toilet paper 0.03% 0.03%
Tide detergent 0.02% 0.03%
Hair dyeing 0.67% 0.82%


But what causes Los Angeles’ cost of living to run ahead of Shenzhen’s? Although the overheated property market in China has driven the prices up and up, rent prices in Shenzhen are 50.93% lower than in Los Angeles. “My living cost per month is about $3,000,” said Jake Davidson, a senior from Los Angeles studying accounting at USC.  According to Jake, he has to pay $1,600, almost half of his living cost, for his rent. In that case, people living in major cities in the United States such as Los Angeles and New York actually suffer more renting pressure.

However, Shenzhen’s hair dyeing services, when compared against average incomes, run higher than Los Angeles’. The comparatively high percentage meets a current trend of more expensive service industry in China’s big cities.


Opportunities Matter   

“I prefer to work in the United States,” said Caixin Yang, a sophomore who comes from Chongqing City and now studies economics in America. For her, the United States has more advanced and mature financial systems and markets. “China is under transformation and everything is in a mess,” she said.

The same answer goes with Yuyuhou Li, who thinks highly of a well-established public relations career path in America. “Although the living cost is really high here, especially in LA, working in the United States represents a more stable life,” she added.

In spite of skyrocketing living cost, especially the rent in the United States, Chinese students are eager to earn a degree in the United States. What entices Chinese students who receive education in the United States to choose to make a life in a foreign country even though China has become the second largest economy? Free work culture, decent income and better welfare treatment could be the answer.

“High living cost is not something I value if I choose to stay in the United States or in China,” said Yiling Jiang, 23, studying communication management at USC. He values personal development, opportunities, lifestyle, family, and friends when judging which country is more appealing. Not only Yiling, but all of the five interviewees studying in USC with footprints in both China and America agreed that the U.S. living cost is high but not a huge problem. In fact, the highly rigid bureaucratic working ethics, complicated relationship (guanxi) and unfair career treatment are three main factors that prevent young professionals coming back to China.

In addition, as living environment worsens, China’s most well-educated have begun fleeing the country. Caixin Yang also mentioned her concern in her interview about the long-lasting severe pollution in some Chinese metropolitan cities such as Beijing, the Capital of China.

At the same time, there is still a number of Chinese students who pursue degrees in America prefer to go back to China. Yutian admitted that current American life is more attractive in terms of advanced education and career training, but in the future, living in China will be more appealing to him, as the country’s pace of change is accelerating.

“China has a lot more potential in development and I am willing to be a contributor in this process,” said Yutian Li.


Mongolia to Minegolia: A nation’s struggle to develop amidst sudden economic expansion

A nomadic herder rides past a traditional ger in Northern Mongolia.

A nomadic herder rides past a traditional ger in Northern Mongolia.

Traveling outside of Mongolia’s only major city, Ulaanbaatar, can seem like traveling back in time 800 years. Among the hundreds of miles of rolling hills, I was hard-pressed to find any permanent, man-made structure. It was a natural landscape so untouched by modern man that I half expected to see Genghis Khan’s enormous army thunder down a hill aboard hardy little ponies.

Nomadic herding culture has been a part of Mongolia for thousands of years and it remains a major part of Mongolian life. However, Mongolia’s economy is undergoing massive transformation that could change both the cultural and natural landscape forever.

From 2009 to 2013, the Mongolian GDP nearly tripled in size from a scant $4.584 billion (US) to $12.582 billion, according to the World Bank.

mongolia-gdp-per-capita

Mongolia’s explosive rise in the Asian sphere began in the late 1990s when Mongolia found itself to be, quite literally, sitting on top of a gold mine. More important than the gold mine, however, was a copper mine, one of the largest in the world, that was buried underground, just north of the Gobi Desert.

Combining lush national resources and its location just north of resource-hungry China, Mongolia was set to launch itself from rural nomadic countryside to industrialized nation within a span of a few years.

Throughout its expedited transition from a largely agricultural economy to an economy in which one fifth of GDP relies on the mining sector, Mongolia has struggled to strike a balance between rapid growth and growth that is sustainable, fair, and environmentally responsible.

Today, the mining industry makes up 20 percent of Monglia’s GDP. This makes the Mongolian economy somewhat reliant on fluctuating commodity pricing as it sells its copper, gold, and other earth minerals to China. It is possible, however, that mining’s share of the GDP is much higher but the Mongolian government is presenting its nation as a well diversified and therefore more stable economy for investment.

Even at 20 percent of the economy, if metal and earth mineral prices plummet, as they did in the second quarter of 2012, GDP growth can halt or even contract without other industries to offset decreased revenue.

Since the beginning of development at the Oyu Tolgoi mine, a major contributor to GDP growth, GDP per capita has grown over 800 percent. However, the Gini Coefficient, a measure of income distributions in which a value of 0 represents perfect equality and 100 represents absolute inequality, Mongolia is rated a 36.5.

This rating ranks Mongolia 70th in terms of equality among nations worldwide. To put this in perspective, the most equal country is Ukraine with a score of 24.8 and the second most unequal country is South Africa, a nation that is still suffering great disparity along racial lines as an aftereffect of apartheid, with a score of 65.

While not nearly as bas as South Africa, nowhere is the disparity of development in Mongolia better illustrated than in Ulanbataar. In the center of downtown lies the massive Chinggis Square, named after the nation’s hero, Genghis Khan. On one end of the square sits the Blue Sky Building. This $200 million project is a glass and steel office building and hotel reaching 344 ft. high which would not look out of place in London, New York, or Shanghai. From this vantage point, the city skyline is dominated with towering cranes building offices, apartments, and shopping centers.

Construction on the Blue Sky Building in Ulaanbataar before the hotel and office building opened in 2009.

A mere 15-minute drive away from the downtown area is a very different sight. On the outskirts of the city an estimated 800,000 former nomads have settled in their gers, traditional felt tents that have been used by nomads for centuries. Here, there is no plumbing, running water, or civil services like trash collection. Some estimates place unemployment in these ger districts as high as 60% and without their herds to support them, many are likely living in poverty.

The story of Mongolia’s rise from uniform underdevelopment to the state of Ulanbataar today began in 1997, when the democratic government, established after the fall of the Soviet Union, which maintained Mongolia as a buffer against China, passed the Minerals Law of Mongolia. This law established the state’s ownership of all mineral resources within its borders and reserved the right to sell mining and exploration licenses.

The goal of this law was to grow Mongolia’s economy after a dip that left their GDP below the billion-dollar mark from 1993 to 1994. If the government could sell its mining and mineral exploration rights to international mining corporations, it could, in theory, increase levels of foreign direct investment, lower unemployment, and raise GDP.

Investors found abundant Mongolian reserves of copper, gold, fluorspar, and uranium highly attractive. In addition to owning natural resources, Mongolia shares a border with China, the world’s largest importer of raw materials. This presents a lucrative opportunity to sell materials to China at a lower price by minimizing transportation costs that make metals and minerals from South America more expensive.

Combining natural resources with its proximity to China, a country that imported $25.1 billion in refined copper and $63.9 billion in gold in 2014, Mongolia looked like the world’s premier destination for mining operations.

Turquoise Hill Resources Ltd., a subsidiary of the Canadian Ivanhoe Mines, found a massive copper reserve in southern Mongolia. It announced a $4.4 billion investment in underground development at its mining sight Oyu Tolgoi on December 14, 2015. Estimated to be the world’s third largest reserve of copper, Turquoise Hill originally invested $6.2 billion in 2013, after years of exploration and analysis, to begin production.

Turquoise Hill Resources has invested over $10 billion so far in the Oyu Tolgoi mine and surrounding infrastructure.

These investments were massive in communities where wealth was generally measured by herd population rather than hard currency. The influx of capital and demand for labor encouraged many nomads to abandon traditional herding practices in order to work for mining companies or construction companies which were needed to build infrastructure like roads and bridges virtually from the ground up.

In order to include Mongolian interests in mining decision-making, the Mongolian government and Turquoise Hill spent five years negotiating the Oyu Tolgoi Investment Agreement. The agreement states that the Mongolian nation has a 34 percent equity stake in the mine with the ability to renegotiate their ownership to 50 percent as soon as initial investments have been recuperated. This clause is very favorable for mining companies which are essentially guaranteed the recuperation of their investments.

Additionally, the agreement holds the investor accountable for regional economic development, adhering to national and international environmental standards, contributing to national infrastructure, maintaining a workforce that employs mostly Mongolians, and investment in the education of the Mongolian people.

While these terms are written into the official contracts, there is little evidence to support the clauses did anything more than pay lip service to ideas of sustainable development.

With the volatility of commodity pricing, those who have sold all of their herds and bet on Mongolia’s industrialized future by settling in cities are facing just as much if not more uncertainty than their countrymen and women who remain herders. Over the past five years, copper prices have fallen over 50 percent affecting both wages and unemployment.

After a severe dip in prices following the global economic crash in 2008,  copper prices rose. Since 2012, prices have been decreasing.

After a severe dip in prices following the global economic crash in 2008, copper prices rose. Since 2012, prices have been decreasing.

Dwindling copper prices have slowed economic growth to a crawl, the World Bank predicts 0.8 percent growth rate in 2016, and the Mongolian currency, the togrog, has plummeted in value.

Many economists blame Mongolia’s economic downturn on changes in the slowing Chinese economy. China, which is the destination of 80 percent of Mongolia’s exports, has decreased its demand for commodities like copper and coal, which has driven down international commodity prices significantly. This serves as a double blow to the Mongolian economy because China is not buying as much and prices are falling in the international marketplace.

Despite contractions in copper prices and resulting economic uncertainty, many nomads continue to settle in cities either to seek economic opportunity or escape the uncertainty of harsh winters that can wipe out an entire family’s herd, a Mongolian’s source of wealth and survival. The increasing frequency of these unusually cold winters are intensifying movement to urban areas, as herds die off on the ice covered steppes. These extreme weather conditions have been attributed to pollution and its affects on climate change.

Just like in Ulanbataar, families who renounce their nomadic lifestyles settle in gers on the outskirts of mining towns. During the winter months, when low temperatures average around -28 degrees Fahrenheit, former nomads burn massive amounts coal to keep warm and cook. Air pollution is so bad in the colder months that it exceeds the World Health Organization’s most lenient standards by 600 to 700 percent.

This creates a spiral of urbanization. As more nomadic families leave the countryside and gather in mining towns and cities, pollution increases thereby worsening and increasing the frequency of hard winters, forcing more families to trade their herds for mining or manufacturing jobs.

Former nomads settle in their gers near mines to find work.

What were once seen as beacons of opportunity are now more like poverty traps. Those who work in the mines are either susceptible to injury or the arduous labor prevents many miners from being hired past age 40. Even people who have moved to cities to support the growth of mining towns by opening shops and restaurants are feeling the strain of dwindling copper prices as miners become unemployed and have less to spend. And without the herds of sheep, goats, yaks, and horses that used to sustain Mongolians through the harsh winters, those who can no longer find work will find an economic landscape almost as barren as the Gobi Desert.

Barreled & Tapped: The History & Impact of San Diego’s Craft Beer Scene

San Diego is known for its robust craft beer scene, but it’s the history and economics behind this industry that makes this city shine in a nation filled with craft beer cities. According to the Brewer’s Association, in 2014, small and craft breweries contributed $55.7 billion to the U.S. economy and supported over 424,000 jobs with 115,000 directly at breweries or brewpubs. In San Diego, for every brewery job that is added within county, 5.7 jobs in supporting industries are created. The rich history, educational practices and connectivity between brewers and has allowed more breweries to open led to success of San Diego craft beer.

Craft beer may reign in San Diego, but it didn’t start there. The story of beer actually started in Mesopotamia in 5 BC with the Sumerians who participated in the brewing and drinking of beer that was passed down from generations through a poem. Oxford scholars found this poem from1800 BC that involves Ninkasi, the goddess of brewing, and the production of beer from barley. Thousands of years later in North America, Spanish missionaries came to spread Catholicism and brought fermentation practices that produced sacramental wine, which would eventually be used in the beer making process. When the Mexican government gained independence from Spain and in 1848, the United States took the region of San Diego from Mexico.

Beer making in San Diego can be traced back to 1868 when Conrad Doblier began brewing European-style beer as an emigrant from Austria as a brewer. In 1868, two breweries were created in San Diego named the San Diego Brewing Company and Mission Brewery. During Prohibition from 1920-1933, many San Diegans moved south to Tijuana, Mexico in order to produce and drink beer legally. While there, they opened Aztec Brewing Company and Mexicali Brewery, which soared in popularity due to the low supply and high demand of alcohol in the U.S. At the end of Prohibition in 1933, the San Diego Brewing Company and Aztec Brewery were responsible for 25 percent of California’s beer production. Once beer powerhouses like Anheuser-Busch, Coors Brewing and Miller Brewing started their production of beer in the 50s, they caused commercial beer production halt in San Diego breweries until 1987.

San Diego’s craft brewery scene started again in the 80s when California legislation was passed that legalized the brewpub throughout California. It also made commercial production ands sale of beer in restaurants and home brewing legal, giving beer enthusiasts the chance to capitalize on their hobby. Home brewers started swapping recipes, experimenting and eventually, built the connection between brewers in San Diego that exists today. However, during the 80s, one brewery stood out as the founder of this new era of beer. It is the story of two best friends who formed the Karl Strauss Brewing Company. Chris Cramer and Matt Rattner opened The Karl Strauss Brewing Company in Downtown San Diego and kick-started the craft brew revolution on February 2, 1989. It was the first brewery in operation since the 50s and the first-ever brewpub in San Diego. The 1980s marked a period of brewing pioneers innovators and craft brewers in the U.S. had gone from eight in 1980 to 537 by 1994, with Karl Strauss as one of them. Today, there are 518 craft breweries opened in California alone, the most out of any state, with over 120 located in San Diego.

coasters, pivni tacky, bierdeckel

www.beercoasters.eu

Karl Strauss started their business by only brewing a golden ale, an amber lager and a dark brown ale. Because of their innovative flavors that challenged the typical light beers that were on the market, there was a high demand for Karl Strauss beer and in 1991, Karl Strauss opened a distribution center in order to ramp up their production. Today, Karl Strauss has eight brew pub locations and has plans to open a second distribution center because of the demand for their beer. Even though they only distribute their beer in California, Karl Strauss is ranked the 45th– for the largest volume of craft beer distribution in America out of 3,000 breweries. According Karl Strauss, “craft beer is not just a job, it’s who [they] are.” This can be seen through their extensive network they created with employees that were mentored at their brewery and branched out on their own.

Karl Strauss started the careers on many brewers in San Diego who added the to culture of education and family. According to the founder of Karl Strauss, Chris Kramer, “One of the reasons why San Diego has become such a mecca for craft beer is we started off with a group of individuals who were friends and collaborative rivals.” This is still true today and is the reason why San Diego’s craft brewery scene is so interconnected. Many employees who had their start at Karl Strauss opened their own breweries, adding to the ever-growing family of craft brewers in San Diego. Karl Strauss’ original bartender, Scott Stamp, opened the San Diego Brewing Company and their first-ever waitress; Gina Marsaglia opened the ever-popular Pizza Port in 1992 with her brother Vince. In addition, Karl Strauss’ original tour guide, Jack White, opened the renowned brewery Ballast Point in San Diego in 1996, which is now the 11th brewery in America for its wide distribution, innovative flavors and unique offerings. The small craft brew circle that started at Karl Strauss has promoted the art of beer making is one of the reasons why San Diego craft brewing is successful today.

hc117_bk_timeline_r1

sandiegohistory.org

The interconnected nature of the San Diego craft industry started with Cramer and Rattner in 1989, but the San Diego Brewer’s Guild allowed the craft brew industry to continue to grow in San Diego. Founded in 1997, the guild was created with two goals: to promote San Diego’s brews and to create an open line of communication between brewers. This type of communication has allowed San Diego to continue to grow the industry while also keeping the competitive market friendly with the sole goal of promoting the craft as whole rather than individual businesses. The guild advances their mission to, “promote… locally brewed beer through education and participation in community events.” Craft powerhouses like AleSmith Pizza Port, Stone Brewery, Green Flash and Karl Strauss are all members of this coalition, making it easier for brewers to unite within San Diego. Although there are guilds throughout the U.S. that promotes craft beer, the SDBG is different because their breweries continue to innovate together within San Diego. As a team in 2014, San Diego breweries dominated the World Beer Cup where they won 11 of the 14 medals awarded. During the World Beer Cup in 2016, the SDBG won more medals than the entire United Kingdom and even beat-out Germany in the category for Kölsch, which is a German style beer. Just this October, the SDBG took home another 18 medals at the Great American Beer Festival in Denver, Colorado, cementing San Diego as a destination for craft beer innovation. Denver is often thought of as a craft-brewing center as the home of the Great American Beer Festival, but only won eight medals.

screen-shot-2016-10-25-at-2-21-18-pm

Great American Beer Festival

The strong dynamic to promote the craft within the industry and become a world competitor as a city has been promoted by the San Diego Brewer’s Guild but has remained a part of the craft culture with San Diego as well. . Because most brewers had their start at other breweries, they formed a sense of respect and trust for the craft culture in San Diego. When Vinnie Cilurzo created the Double India Pale Ale in 1994 in San Diego County, nearly every brewer has embraced this style of beer in San Diego. In fact, San Diego is now internationally known for their Double IPAs, which is often referred as the San Diego Pale Ale. Stone Brewery, Karl Strauss and AleSmith, all a part of the SDBG, are famous breweries that carry the torch of the Double IPA today. The creativity and education that solidified the bonds between brewers allowed many brewers to leave the breweries they worked at to form their own and create a craft beer boom in San Diego.

brew-licenses

voiceofsandiego.org

Between 2009 and 2011, nearly 40 breweries opened in San Diego causing a surge in the craft beer market. In 2011 alone, the county’s brew pubs generated $300 million to the county, generated over $600 million in sales and created more than 2,800 jobs in San Diego. The expansion of breweries in San Diego translates to a boom of jobs and contributions to the local economy through these jobs, revenue and taxes to the City of San Diego. During this time, more brewers came to San Diego than competing cities because of the respect the city has garnered for itself and wages provided. In 2012, San Diego had the highest average wage for brewery workers in the U.S. compared to Portland and Denver, which are often regarded in the same category. Today, the wage gap has closed where the average salary is around $36,000 a year. Although wages slowed in 2014, the craft brew sector grew overall and had a direct economic value of $600 million, which is twice the amount three years prior. This figure is generated based on San Diego’s 120 local breweries and their revenue, profits, wages and jobs the industry produces. Wages may have helped grow the craft industry, but it is education portion that diversifies San Diego from other brewing regions.

screen-shot-2016-10-25-at-1-57-39-pm

NUSIN Institute

According to the NUSIN Institute, San Diego provides more education programs for industry professionals entering the craft beer market than their competitors. These types of programs further the industry and allow brew masters to pass on their knowledge within the industry. There are two major education programs in San Diego: the San Diego State University College of Extended Studies Business of Craft Beer Professional Certificate and the University of California– San Diego Extension Brewing Certificate. Both were founded in 2013 and follow the mission of the SDBG to promote local beer through education. In addition, many brewers encourage their employees to participate in the Cicerone Certificate Program, which was created in 2008 to educate people and create craft beer leaders. Similar to sommelier training in the wine industry, the Cicerone program trains professionals in the knowledge of beer in sales and services. In the NUSIN Institute study, 57 percent of craft breweries indicated that their employees participated in the Cicerone Certificate Program. Karl Strauss is one brew company that prides themselves on having multiple employees that are certified Cicerones and beer servers because, “everything from beer and food pairings to style education is part of the Karl Strauss experience that goes above and beyond what you’ll find anywhere else.” It is experiences like this that adds an extra layer of knowledge to employees and education to customers on their journey of beer in San Diego further expanding art of beer making into other industries in San Diego.

Jobs are being created within the craft brew industry and in supporting fields. Throughout the county, NUSIN has identified that one third of local industry jobs are directly relate to brewing while two thirds focus on brewpub operations. Brewpubs are dependent on food service and hospitality sectors that are composed or hosts, servers and cooks. Because of this specialized nature of brewing, supporting fields have popped up within San Diego such as: brewing equipment design and manufacturing, packaging, sales and marketing, brewing labs, home brewing supply stores and hops and farming. All of these industries that have an impact on the brewing process generates an average $56.6 million in sales annually.

untitled

NUSIN Institute

San Diego is a hub for the innovative beer market because of the rich history of beer making and the connections between brewers that has allowed the city to work together to educate people and produce beer as one unit. These factors are the reason that San Diego has its own IPA category of beer and produces more than 2,000 unique beers annually. If Karl Strauss had not started the craft sector in the 80s, the industry would not be the same. It is the need for creative flavors, friendly and collaborative rivals and the growth of an industry that Karl Strauss created that keeps the San Diego craft beer industry alive today. It is also the reason why they won mid-size brewing company and brewer of the year at the 2016 Great American Beer Festival. If the San Diego craft beer industry stays true to their message that craft beer is a family network that succeeds based on innovation, education and interconnectivity, there is a chance that the beer bubble won’t bust for a while longer and small batch brewers will continue to succeed.

Misused Policy: China’s Electric Vehicle Subsidy Fraud

The Chinese government has poured 33.4 billion yuan in subsidies since 2009. The government decided to establish a world-leading industry and increase jobs and exports, and to reduce oil dependence and the urban pollution. The incentive policy offers subsidies to encourage the companies that build electric cars, plug-in hybrids and fuel-cell vehicles to produce and sell electric vehicles (EVs). But a report from the Ministry of Finance of China exposed that at least five automakers defrauded the government for a total of 1 billion yuan ($150 million) in subsidies aimed at promoting EVs in September 2016.

Since some incentive regulations were vague and under weak supervision, speculators learned how to reap the benefit from a poorly crafted subsidy system the government had launched. For example, a big portion of the subsidies flowed into unqualified or non-existing cars made by dishonest companies. One of the bus manufacturers involved in the scandal was the Higer Bus in Suzhou, which received about a half billion yuan in subsidies through sales inflation. The five companies defrauded an average of 25,000 yuan per car, according to the government report.

In some cases, the manufacturers sold unqualified or faulty cars to related parties (for example, the companies’ own leasing subsidiaries). After the companies received the subsidies from the government, the buyers returned the cars. In other cases, the makers installed dysfunctional batteries or even one battery in different vehicles.

The high profit under the government support cultivated another deal model between the sellers and the buyers. An electric bus worth one million yuan would be priced at two million yuan. The buyers only needed to pay one million yuan, but the sellers forged a two million yuan receipt to apply for the government subsidy.

2015%e5%b9%b4%e4%ba%a7%e9%87%8f


China saw a big boom of EVs in 2015

The government planned to phase out the subsidies on the EV industry from 2016 to 2020. The manufacturers stepped up the production by adding incomplete or unlicensed vehicles, especially in the end of 2015. The total number of EVs sold in the fourth quarter increased by 92,000 dramatically. The monthly production in December 2015 quadrupled compared to the number in December 2014. Higer Bus sold 2,000 EVs with 83.9 percent incomplete in December 2015, which amounted to one-fifth of the company’s yearly sales.

subsidy-standards2
China’s EV Subsidy Criteria during 2013-2015

The policy designed to support the EV industry hurt the market instead. The vague criteria in the incentive policy lowered the threshold for receiving subsidies. Under the standard from 2013 to 2015, the amount of subsidies an EV could receive was mainly based on its range (mileage) or length. There were no rigorous standards for the vehicles’ technology and actual quality.

The subsidies have been blamed for attracting the ‘wrong crowd’ according to Zhang Zhiyong, a Chinese market commentator and auto-analyst based in Beijing. Many new players in the market decided to make EVs just to get the subsidies. They came not with previous manufacturing experience or R&D input, but with a gold-rush mentality.

China registered the largest amount of plug-in electric vehicles (PEVs) in the first quarter of 2016, yet ranks lowest on the Plug-In Electric Vehicle Index, which is a quarterly index tracking the production effectiveness and impact of the PEV market in different countries. “Despite having more than 200 manufacturers of new-energy passenger vehicles, buses and special-use vehicles, China still lags behind global leaders in terms of quality, reliability and key technology,” said Wang Cheng, an official at the China Automotive Technology and Research Center.

pev-index

According to the subsidy policy from 2013 to 2015, a qualified minibus with a length of three to four meters can help its maker receive subsidies ranging from 300,00 to 600,000 yuan. To get the subsidy, the company didn’t even need to know how to manufacture the electric bus; the company only needed to buy a 20,000-yuan diesel-engine bus and install an electric battery.

Though unqualified EV companies have cheated on the subsidy system, it does not mean the government support is unnecessary. Government incentives for EV industy are common practice in several national and local governments around the world, such as France, Germany, Japan and the United States. EV programs in these countries also encourage the residents and local bus transit agencies, which target more relevant parties than just the car makers. For example, California established the Clean Vehicle Rebate Project, which allows residents to get up to $7,000 for the purchase or lease of an EV. The transit agencies can benefit from the program of Electric Vehicle Supply Equipment Loan and Rebate. “They are set up to encourage local agencies to purchase electric vehicles like those from BYD, which help the environment while growing jobs here in California,” said the PR spokesman Joshua Goodman from BYD USA, an EV bus manufacturer with its headquarter in Los Angeles, “the California Air Resource Board also offers several different incentives to us (the EV manufacturers).”

Foreign countries’ practice offers good examples that China can learn from. The leading industry does not contradict the support from the governments. But a germane policy is in need. The Chinese government is trying to improve its policy now . The regulators plan to impose tougher policies on incentives, such as stricter technology standards on manufacturers. The government also considers limiting the number of startup EV makers to a maximum of ten.

Works Cited:

Bloomberg News. China Swats ‘A Few Flies’ to Temper Electric-Car Maker Excesses. Web. 11 September. 2016.

An Limin, Bao Zhiming and Han Wei. China Hammers out Tougher Subsidy Plan for Electric Vehicles. Caixin News Online. Web. 30 September. 2016.

Sustainable Transport In China. New Policy on Electric Buses Published in China. Web.

Bloomberg News. 95% of China’s Electric Vehicle Startups Face Wipeout. Web. 28 August. 2016.