Why the world’s biggest plane manufacturers are fighting over the future of air travel

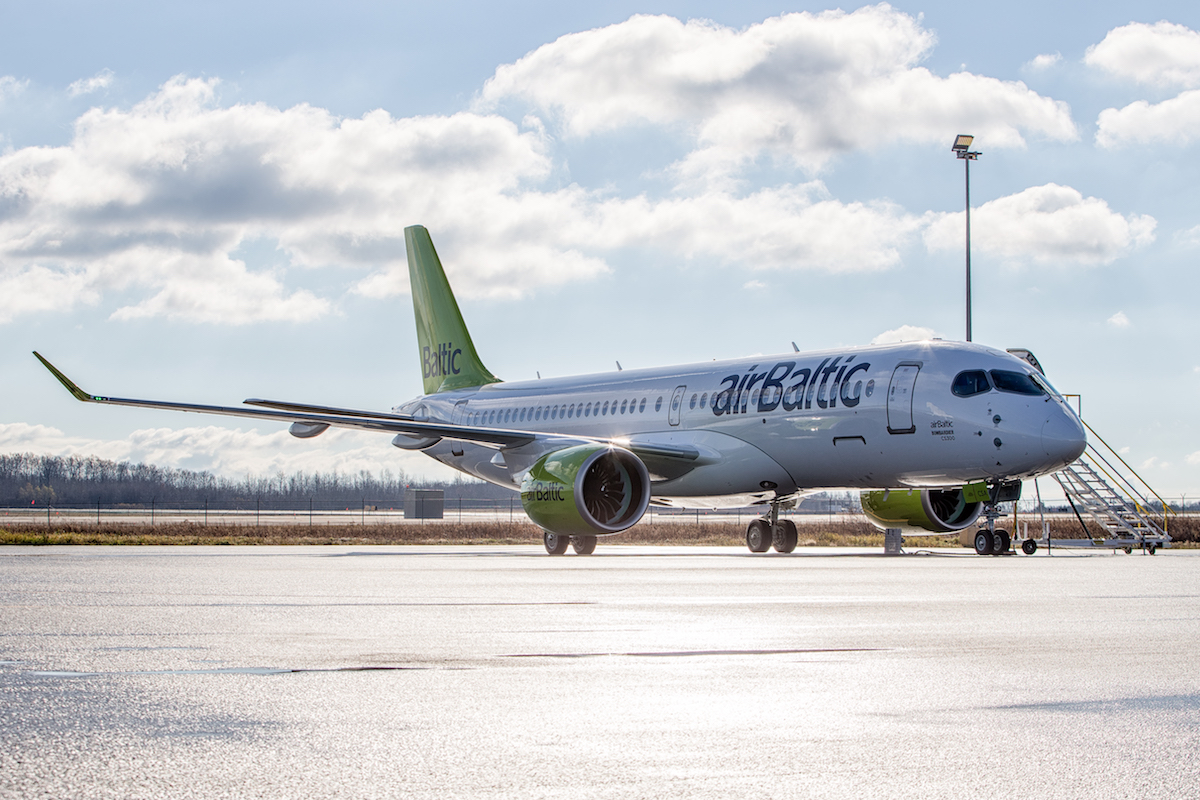
An airBaltic Bombardier CS300 sits on the tarmac. (Image courtesy Bombardier)

Norwegian Air made headlines earlier this year when it advertised flights between the United States and Europe for as low as $65. It was unthinkable. No airline could possibly pull it off.

But Norwegian has created a new business model as a low-cost long-haul airline, riding on a wave of innovation from airplane manufacturers. Thanks to the fuel-efficient Boeing 787 Dreamliner and 737 MAX, it’s now possible for airlines to fly relatively small jet planes between far-off destinations and avoid the expense of flying large planes through large and costly airports.

This link between the airplane business and the airline business is strong and has been for decades. But it takes years for a concept for a new plane to become a flyable reality, so aerospace companies are always trying to predict the future: what will airlines and their customers want?

Bombardier is trying to do for domestic and regional flights what the 787 Dreamliner did for international travel. With its C Series, an entirely new 100- to 160-seat plane built with modern technology, the Canadian aerospace giant is betting that the future of air travel is direct flights between destinations on smaller planes rather than large flights through crowded hubs.

But the C Series program has been plagued by trouble, and other manufacturers are jumping at the chance to be first to the point-to-point air travel future. Boeing took action that led to hefty tariffs on Bombardier’s jets, and Airbus has since acquired a majority stake in the program.

As airlines phase out their large planes, what happens next will decide who dominates the airplane market for years to come.

A brief history

Prior to 1978, air travel in the United States was heavily regulated by the U.S. government. A federal agency dictated routes that airlines had to run, the fares they were allowed to charge for those routes, and how frequently they had to serve them. These mandates limited the ability of the industry to respond to changes in demand or fuel prices and the ability of individual airlines to innovate or compete with one another.

The deregulation of airlines in 1978 led to a period of rapid change in the industry, with most airlines coalescing by the end of the 1980s around what has become known as the hub-and-spoke model.

In a hub-and-spoke airline network, flights from “spoke” airports in smaller cities fly toward a larger “hub” airport, with the arrivals timed so that passengers can connect to other flights at the hub and fly to their destination. For example, a traveler leaving Oklahoma City headed for New York City could fly to Chicago first and connect there to a New York-bound flight. The system made up for uneven demand across cities by consolidating passengers headed for one destination onto one route.

The hub-and-spoke system enables airlines to provide more frequent service on larger aircraft at a lower per-passenger cost, creating an economic incentive for aerospace companies to design and produce larger planes. Its primary alternative, a point-to-point network, encourages the opposite: fast and frequent service on comparatively small — or “right-sized” — planes. This model was first popularized by Southwest Airlines, which has transformed the airline industry since its nationwide launch in the 1990s.

Avoiding a stop at a hub reduces costs by up to 30 percent, researchers at Embry-Riddle Aeronautical University found, and those savings can be passed on to the passenger. In a hub-and-spoke system, many flights arrive at a hub airport within a short time period and then depart together somewhat later. This increases congestion at the airport and means that planes and staff go unused between groupings of flights. Additionally, nonstop point-to-point service reduces the need for ticketing agents, gates, lounges, and baggage facilities by spreading demand throughout the day.

How aerospace companies respond

These different models of airline routing demand different kinds of planes, which has shaped the strategies of plane manufacturers over time. Research and development for a new model of airplane takes years, sometimes up to a decade from conception to delivery. This is a huge investment of resources for the manufacturers, so they try to anticipate trends years in advance.

But sometimes the big players don’t agree on where things are headed. Looking at the programs that duopolistic Airbus and Boeing pursued throughout the 2000s, we see diverging trends: Airbus believed that bigger planes would bring costs down through economies of scale, while Boeing thought efficiency would help midsize planes travel more cost-effectively over long distances.

The Airbus A380 program officially began in December 2000 with the goal of allowing high-capacity flights between hub airports at a low per-passenger cost — consistent with the hub-and-spoke model. Airbus has described this as a necessary response to growing demand for air travel, which it says will lead to overall air traffic doubling every 15 years. Years after its release, the A380 remains the world’s only double-decker plane, able to carry more than 600 passengers over distances of more than 15,000 km.

But it seems that Airbus made the wrong choice in pursuing size over economy. Very few cities have passenger counts that could reliably fill a 600-seat plane, and the four jet engines on the A380 mean that flying one that isn’t full becomes prohibitively expensive. Not a single airline in the United States has purchased an A380, and their attitude toward large planes is shown in their treatment of its closest equivalent, the iconic Boeing 747: all American airlines plan to retire their 747s by the end of this year.

“Every conceivably bad idea that anyone’s ever had about the aviation industry is embodied in [the A380],” aerospace analyst Richard Aboulafia told the New York Times.

Airbus initially predicted it would sell 1,200 of its superjumbos within two decades of launching, but the most recent data show that only 317 have been ordered.

Thousands of miles away in Washington state, Boeing was developing a different kind of airplane: one efficient enough to fly the longest routes in the world and small enough to avoid overcrowded hub airports.

With the 787 Dreamliner, Boeing used composite materials rather than metal to create a plane far lighter than its peers, saving up to 40,000 pounds. This, combined with more efficient engines and battery-based systems, made the plane 20 percent more fuel-efficient, bringing costs down to levels that made a 300-seat plane appealing to airlines flying international routes.

Despite launching commercial service four years after the A380 and being grounded worldwide for months due to early safety concerns, the 787 has sold three times as many planes as the Airbus superjumbo, with 1,283 orders as of Oct. 31.

Going even smaller

Bombardier, looking to the success of efficient planes and point-to-point networks, has tried to scale down the business model of Boeing’s 787. In 2008, it publicly announced the C Series, a line of small jets that could seat between 100 and 160 passengers. This placed it in the market between an increasingly popular line of regional jets from Brazilian firm Embraer and the ubiquitous Boeing 737 and Airbus A320 series mainline jets. Bombardier expected to sell more than 3,500 planes in this market within 20 years.

The C Series was designed to increase efficiency on domestic routes, and its smaller size is meant to make it feasible for shorter runways at smaller airports while still allowing more passengers than a regional jet. Bombardier says it will “let operators open more new routes and offer the frequency being demanded by passengers, without increasing costs.”

Bombardier and the governments of Canada, Quebec and the United Kingdom all invested heavily in the development of the C Series, totaling about $4.4 billion by early 2015 — or about two-thirds of Bombardier’s market value at the time.

“We all kind of loosely used [the term] ‘betting the company’” to describe the project, former Bombardier Commercial Aircraft president Gary Scott told the Wall Street Journal.

But the company has struggle to make that big investment worthwhile. New technology meant the C Series could be more efficient than other airplanes, but fuel prices began plummeting soon after the project was announced, and production delays eliminated the first mover advantage that Bombardier had over Boeing and Airbus. Both the big players quickly launched new versions of their 737 and A320 series with more efficient engines, something that Bombardier hadn’t anticipated.

Competing directly against Boeing and Airbus proved difficult for Bombardier, which in the past avoided such competition by focusing on smaller regional jets. After Delta Airlines placed an order for 75 C Series jets, Boeing began demanding the U.S. Department of Commerce place a tariff on those planes, which would be produced with what it called a Canadian government subsidy. The government agreed, levying a 300% tariff on the C Series.

To save the program from extinction, Bombardier gave half the C Series program to Airbus at not cost. Since Airbus has more resources, U.S.-based manufacturing plants, and worldwide service centers, it’ll be able to sidestep the tariff and make the C Series more appealing to airlines. Plus, Airbus gets to benefit from the revenue on a plane it paid nothing to develop.

This fierce and somewhat unprecedented battle over small jets signals a major shift in the industry and perhaps the end of the reign of hub-and-spoke networks. Airbus has said it expects to sell up to 6,000 C Series planes in the next 20 years, which make the new category nearly as widespread as its own A320 family, one of the world’s most common planes.

Looking ahead

As air travel demands increase and large airports become more crowded, planes like the C Series will allow airlines to more completely meet passenger demand, flying long and thin” routes between cities that are too far from each other for regional jets to travel but don’t have enough demand to profitably maintain service with something like a 737 or A320.

According to Embry-Riddle researchers, only about 5 percent of airport pairs in the U.S. could sustain nonstop point-to-point service on mainline jets. For an airline like Southwest that flies only Boeing 737s, it would be hard to break into markets with unsatisfied demand.

But a plane like the C Series could open new markets to air travel, and that’s why aerospace companies are vying for pieces of this new segment. At an airport with short runways like London City Airport, the C Series can go twice as far as any other aircraft and with 25 percent more passengers, Bombardier program head Rob Dewar told The Globe and Mail. For other airports like this around the world, a new generation of planes can create new routing possibilities, expanding the reach of point-to-point networks to places they couldn’t have gone before.

Taylor Swift’s album can’t be streamed (yet), and that’s the economically smart thing to do

Taylor Swift performs on her 'Speak Now' tour in Sydney, Australia, in March 2012.

Taylor Swift performs on her ‘Speak Now’ tour in Sydney, Australia, in March 2012. (Photo by Eva Rinaldi via Flickr under CC-BY SA 2.0 license).

Last week, Taylor Swift was responsible for one-third of all music sold or streamed in the United States. Her newest album, reputation, on its own sold nearly double the rest of the Billboard 200 combined. And despite releasing only four singles from the album on streaming services, Swift came to dominate those charts as well.

Swift’s choice to withhold access and force listeners to pay for her music has interesting implications for the streaming music industry, which remains unprofitable despite climbing numbers of paying subscribers. The latest numbers peg market-leader Spotify at 60 million subscribers, with second-place Apple Music coming in at 30 million. The growth of these services has been the primary driver of increasing revenue for record companies, whose U.S. revenues grew 11.4 percent in 2016 to reach $7.7 billion, according to industry association RIAA.

But that figure is still only about half of what it was in 1999, before early music streaming services like Napster entered the market, the RIAA said. As music became widely available online, consumers became less willing to pay for it, driving down revenues. The recent uptick in paid subscriptions has yet to make up for more than a decade of declines.

“We’re no longer running up a down escalator,” Warner Music CEO Stu Bergen told The Guardian, “but that doesn’t mean we can relax.”

The major challenge faced by both streaming services and the music industry is the popularity of YouTube, where songs are often available for free (legally or illegally) and revenues sent back to the music industry are miniscule. Spotify contributes an average of about $20 per user to the industry, according to The Guardian, while YouTube sends less than $1 its way. In 2016, that meant just $553 million in total revenue from YouTube compared to $3.9 billion from Spotify. Both these figures are far lower than comparable music sales revenue would be for the same number of listeners.

Throughout her career, Swift has taken a stance against making music widely available online, defending her copyright on YouTube and withholding her releases from streaming services. Her entire catalog was only available to stream for a few months in 2017, until reputation was released to buy but not to stream.

Swift wrote in 2014 that “music is art, and art is important and rare. Important, rare things are valuable. Valuable things should be paid for.”

Free or subscription music can be great for consumers, but it prevents sellers in the marketplace from gauging how much someone values an artist’s creation. In economic terms, Swift’s choice to temporarily withhold her latest album from streaming services and allow interested customers to pay for access enables a kind of price discrimination that can increase efficiency and better match supply and demand. As John Paul Titlow of Fast Company explained:

Many of the people who care most about her music felt compelled to do something that seems rare these days: They bought the album. Others, like me, did nothing.

[…]

And to be sure, many of the diehards who bought a physical copy of Reputation will likely add it to their streaming libraries as well. But by then, Swift will have already smartly extracted maximum value out of the people who care the most. And why shouldn’t she?

California’s market-based response to climate change tries to avoid the problems with markets

A layer of smog rests over the Los Angeles Basin in Sept. 2007. (Flickr user vlasta2, CC BY-NC-ND 2.0)

When California Gov. Jerry Brown signed major climate legislation in June, he returned to the spot where his predecessor, Arnold Schwarzenegger, signed his own climate law more than ten years earlier: Treasure Island.

It was an apt location. The artificial island in the San Francisco Bay was created in the 1930s to showcase California’s grandeur for the World’s Fair. Likewise, these climate bills are intended largely to demonstrate to the world that California is leading on climate change.

Schwarzenegger signed Assembly Bill 32 into law in 2006, setting the stage for the creation of California’s cap-and-trade program. A concept that’s been around for only a few decades, cap-and-trade aims to create financial incentives for polluters to adopt more eco-friendly technologies and reduce their greenhouse gas emissions. Brown extended the program to 2030 on Treasure Island and created more ambitious targets.

The state’s goal is to reach 1990 levels of greenhouse gas emissions by 2020, despite a projected population increase of nearly 37 percent over 1990. In 2017, that goal was toughened to reach 40 percent below 1990 levels by 2030.

But so far, it’s been hard to measure the cap-and-trade program’s success, and market-based approaches to the environment can have many of the same flaws and failures found in other kinds of markets. The state’s efforts to address these flaws led to redundant “complementary” policies, meaning that the centerpiece of California’s climate policy actually only plays a small part in its emissions reductions.

A modern cap-and-trade system is designed to reduce greenhouse gas emissions through a flexible market rather than one-size-fits-all regulation. By putting a price on greenhouse gases and creating a market to trade them, the system creates economic incentives for firms to reduce their emissions in the way that’s most cost-effective. To reach the state’s 2020 goal, emissions will need to be about 15 percent below a “business as usual” scenario.

The California Air Resources Board keeps track of the state’s greenhouse gas emissions. This chart from CARB’s 2017 Scoping Plan shows emissions from 2000 to 2014.

To illustrate how this works in practice, let’s imagine you run a natural gas power plant and you produce 100 tons of CO2-equivalent in a year (in reality, this figure would be much higher). Knowing that you emit 100 tons, the California Air Resources Board would issue you 100 carbon credits. You’d get most of them for free, but a few would need to be purchased on the market, either from the state or from other polluters. The idea is that you would save money by taking steps to reduce your emissions rather than purchasing credits, and then if you use fewer than what you’re given for free, you can sell the rest and make a profit. The total number of credits given by the state decreases every year to encourage emissions reductions.

California’s cap-and-trade system began on Jan. 1, 2013, with large power plants and industrial facilities. It was expanded to fuel distributors in 2015, meaning that cap-and-trade now affects about 85 percent of greenhouse gas emissions in the state. Some major companies in the state, like electric utility Pacific Gas and Electric, which serves nearly two-thirds of California’s geographic area, have said they support the program as the best way to address climate change.

In the United States, California has the most extensive cap-and-trade system, which affects all companies emitting more than 25,000 tons of CO2-equivalent in a year. By 2018, its market will be linked to both the Quebec and Ontario emissions markets (more on this later). There’s also a regional cap-and-trade system for electric utilities in New England, and there have been others in the past, such as one created in the 1990s to reduce acid rain-causing emissions. But no nationwide emissions trading system exists today in the U.S. The last big effort to create one, the Waxman–Markey bill in 2009, passed in the House but fell through in the Senate after facing opposition from senators from coal-reliant states.

So far, emissions auctions in California have raised nearly $5 billion for the state, according to the state Legislative Analyst’s Office. State law requires this money to be spent on projects that further reduce greenhouse gas emissions. More than $1.3 billion has been spent on the state’s high-speed rail project, and nearly $700 million each has been spent on low carbon vehicle incentives and affordable housing programs.

Critics of cap-and-trade policy say it’s burdensome for businesses and have pointed to high-profile companies like Toyota moving their operations out of California. But USC environmental economist Kate Svyatets said the state has been successful in balancing competing interests: economic freedom and environmental protection.

“A lot of businesses, instead of being overburdened, they make money,” Svyatets said. “It’s possible to have both a cleaner environment and economic growth, and California shows how to achieve it.”

For most economists, cap-and-trade is the “preferred solution” for regulating greenhouse gas emissions, UCLA researcher Ann E. Carlson wrote in the Harvard Journal on Legislation. Other methods of emissions control, like a carbon tax or mitigation rules, require direct government enforcement and are not as economically efficient as a market system can be — they impose a price on carbon on the state rather than letting one emerge through economic activity.

“It’s hard for the government to decide exactly how many carbon credits to allow,” Svyatets said. “The carbon experts say it’s not expensive enough yet. It’s still better than nothing, but it’s not expensive enough for some companies to switch to clean technology.”

But though California’s cap-and-trade system is designed to create price incentives to reduce emissions, it has not been very instrumental in doing so. The emissions cap each year has been higher than actual emissions in the state, meaning that the emissions trading system does not have the chance to seriously affect how polluters behave. Prices on the emissions market also fell precipitously in 2016 as a court case made the program’s future uncertain. They’ve since rebounded but remain near the state-mandated price floor.

When emission credits don’t cost enough, it becomes cheaper for firms to pollute than to invest in methods that would reduce their emissions in the long term. The European Union is an example of this. It started its cap-and-trade system in 2005, but the European Commission allowed too many credits in the market. Prices fell to ineffective levels by 2008, and companies were profiting off the EU’s mistake by selling the extra credits.

As in California, the prices have since stabilized. At the time of writing, the allowance to emit a ton of greenhouse gases costs roughly $7 in the EU, compared to $13 on California’s market. The 2017 price floor in California is $13.57.

This chart from the European Commission of the European Union shows how the EU’s greenhouse gas emissions have changed since 1990. The data are shown as an index, with 100 being the 1990 level.

Carlson said that when emissions trading systems don’t work, “policymakers may need to enact complementary policies to address those market failures.” California has supplemental requirements like the Renewable Portfolio Standard, which requires an increasing portion of electricity sold in the state to come from renewable and emissions-free sources, and the Low Carbon Fuel Standard, which requires gasoline and diesel fuels to be less “carbon-intensive.”

These policies are perhaps the greatest limit to cap-and-trade’s effectiveness. The complementary policies are responsible for about 80 percent of emissions reductions, with cap-and-trade in place to “sweep up remaining cuts,” according to MIT researchers’ interviews with California officials.

All three policies were created together in what the researchers have called an “insurance” policy to “create a mechanism that could make up emission reduction efforts that were lost if any of the major complementary policies were to fail.” In a way, this means that cap-and-trade in California is intended to be largely a backup plan in case the state’s other policies are not enough. This limits the role that the market has and therefore the incentive for polluters to reduce emissions in the most cost-effective way.

One common issue in many markets is a lack of competition or the monopolization of resources, but despite some speculative activities in emissions trading, anti-competitive behavior hasn’t been a problem in large markets like the European Union or California. German researchers found that those kinds of issues only arise in small trading pools, such as the RECLAIM market for nitrous oxide and sulfur oxide emissions in Southern California.

“Firms within the same industry do not want to sell allowances to buyers with whom they [otherwise] compete,” the researchers wrote. But in large cap-and-trade systems with diverse stakeholders, this has not been a problem.

To make emissions trading systems even more competitive, governments have sought to link their markets with others, allowing credits to be sold across them. More buyers and sellers of emissions means more competition and less room for market abuse.

“If you have a very small market, what if nobody wants to buy your allowances? Just imagine you want to sell a used car or your cell phone or something,” Svyatets said. “If it’s just you and I in this market and nobody else, what if I don’t want your cell phone? What if I don’t want your car?”

But linkages introduce a problem seen in other cases of cross-jurisdictional common markets, like the European Union. When the Greek debt crisis struck that country in 2008, leaders at the European Central Bank found their hands tied when it came to monetary policy to relieve the nation’s ensuing recession. According to UCLA researcher Juliet Howland, linked emissions trading systems could face a similar problem in which one government “may not be able to regulate the price of carbon credits in order to prevent serious damage to [its] economy.” The MIT researchers found through their interviews that California’s system was intended to be flexible for linkages with other western states (which later abandoned their cap-and-trade ambitions), but were concerned that it could be hurt by linkages to weaker cap-and-trade markets.

Linked emissions systems don’t even have to be geographically close — California’s market is linked to the province of Quebec and soon to Ontario, while the European Union has started the process of linking its system to Australia’s. The thought is that in tackling a global problem, it doesn’t matter where greenhouse gas emission reductions happen as long as they happen somewhere.

But California has taken steps to ensure local benefits for its cap-and-trade program. Twenty-five percent of funds are automatically earmarked for high-speed rail, plus 20 percent go to affordable housing and 10 percent to transit systems. All revenues from the sales of emission credits on auction go toward programs that the state says promote public health, and by law, one-quarter of revenues must benefit “the state’s most disadvantaged and burdened communities.”

Those communities, it turns out, are some of the most affected by climate change.

California’s cap-and-trade system aims to reverse course on greenhouse gas emissions to help protect all communities from the harmful effects of global climate change. But despite its large potential impact, the program in practice is only secondary to the state’s more heavy-handed regulations.

This chart from the California Air Resources Board’s 2017 Scoping Plan shows that potential statewide greenhouse gas emissions reductions under the continuation of planned policies would exceed those required under the governor’s executive orders.

That could change. The California Legislative Analyst’s Office found in 2017 that the state was on track to meet its 2020 emissions goal, but the 2030 target is much more ambitious and will require much more severe greenhouse gas reductions.

The cap-and-trade program will likely become more essential over time as the cap becomes increasingly tighter, but this will increase the burden on polluters too and potentially increase costs for consumers. The analysts estimated that some policies needed to reach the 2030 target could cost $300 per ton of carbon dioxide equivalent — or more than 20 times the current price for one allowance on the cap-and-trade market.

Who will be hit hardest by the cost of these reductions remains to be seen, and the impact on the economy is unclear. The analysts said long-term carbon prices depend on factors that are “highly uncertain,” and the state Department of Finance does not provide economic growth projections past 2020.

For now, the California Air Resources Board is working on a plan to reach its 2030 emissions goals. What comes out of those meetings will determine the future of California’s climate policy.

How to choose ocean versus air shipping (hint: ocean usually wins)

Let’s start with the numbers.

The Port of Los Angeles moves the most containers of any port in the world, carrying 182.8 million metric tons of freight. Nearby Los Angeles International Airport moved 2.1 million tons of cargo in 2016.

Maersk is the world’s largest shipping company, with more than 16 percent of market share, 15 percent of all sea freight capacity, and 652 ships.

FedEx operates the world’s largest air freight business, moving 15.8 billion metric ton-kilometers’ worth of cargo on 657 planes from more than 375 airports.

You’ll notice that the sea freight business is significantly larger than air freight. But why?

Today’s newest and largest cargo ships can carry a lot more stuff a lot more efficiently. The OOCL Hong Kong, currently the largest, has a capacity of more than 21,000 twenty-foot equivalent units (TEU). Ship sizes have increased dramatically in recent decades — back in 2003, OOCL’s newest and largest ship carried barely 8,000 TEUs, which was then the most in the world.

A freighter plane, by comparison, can only carry about 4 TEUs at once.

In addition to these economies of scale, ocean shipping is significantly better for the environment and a great deal more fuel efficient. Each metric ton shipped by cargo ship produces about 15 grams of CO2 — less than 3 percent of the 545 grams per metric ton created with air travel.

But perhaps most importantly, sea freight costs less: about $195 for what would cost $1,000 to ship by air. For global corporations shipping millions of goods around the world, small differences in marginal shipping cost can make a big difference to the bottom line.

For certain goods like smartphones, where the security of shipping is important and marginal costs are easily passed on to the consumer, air travel is the way to go. This is also true for items that need to move quickly, like perishable food, seasonal clothing, or holiday toys.

But most goods going most places are best shipped one way: on a boat.

Why are states required to have balanced budgets?

With over $20 trillion in amassed debt, the United States federal government is no stranger to running budget deficits. It’s essentially common and expected practice now. For college students my age, the knowledge that there used to be a balanced budget in the US comes as a surprise that almost doesn’t seem real.

But for most state and local governments across the country, balanced budgets aren’t just the norm, but the rule. According to the National Conference of State Legislatures, 43 states require their governor to propose a balanced budget, 39 require the legislature to pass one, and 37 require the budget to continue to be balanced at the end of the fiscal year. In California, the constitution requires the governor to propose a balanced budget and prohibits the passage of a budget in which General Fund expenditures from exceeding General Fund revenues. In cases like California’s, it’s hard for states to even attempt to carry a deficit because their constitutions prevent them from selling bonds to pay for it.

California’s constitution was ratified in 1879. That’s 138 years (ideally) of balanced budgets. So why can’t the federal government do the same?

Spending only as much money as you get is definitely sound fiscal policy to ensure the solvency of the state government, but it does limit what legislatures can do in times of crisis. States and local governments are reliant on taxes on sales, income, and property — revenues that fall in economic recession when people lose their jobs, lose their property, and/or don’t buy as much. At the same time, reliance on safety net welfare programs increases, putting the state in a budget crunch.

Just as in the federal government, a great deal of state spending essentially runs on autopilot and is difficult to control. States take in — and then spend — a lot of money from federal grants or reimbursements, and the way that money is spent is typically determined by the federal government. Other revenues are specifically earmarked by law, such as money from lottery sales or gas taxes. And in other cases, like Proposition 98 in California, the state is required to spend a certain amount of money on specific departments. (Proposition 98 requires California to spend increasing amounts on education based on economic and enrollment growth).

A lack of flexibility can lead to desperate actions when the economy falters. Governments freeze hiring, stop maintaining buildings, cut back services, furlough employees, or renegotiate pension agreements. In 2009, Arizona was so desperate to balance its budget that it sold public buildings as a way to get money fast — including the Capitol, the state fairgrounds, and some prisons. These cuts can have further impacts on what we typically perceive as economic recovery, since state and local government spending makes up about 12 percent of GDP.

Whether this is good or bad depends in many ways on ideology. If state and local governments were allowed to follow the Keynesian model and spend their way out of an economic downturn, that would allow for even more powerful economic recovery efforts. But followers of Friedrich Hayek’s thinking would say that cutting state budgets in times of crisis keeps us rooted in the reality of the services our government gives us — and what they’re worth.

Los Angeles rents soared as wages stagnated

Rent prices in Los Angeles County increased by nearly 15 percent over a recent period as wages remained unchanged, putting pressure on renters to find other ways to make ends meet or face potential homelessness.

The U.S. Census Bureau pegged the median household income in L.A. County at $56,196 in 2015, the most recent year for which data are available. That was virtually the same as in 2011, when that figure was $56,266 in inflation-adjusted 2015 dollars.

But over the same period, rental prices in the area shot up increasingly quickly. Rental website Zillow, which compiles nationwide home and rental data, found that the median monthly rent increased by 14.5 percent from the end of 2011 to the end of 2015.

That increase didn’t happen steadily. Instead, rents increased significantly in a short period of time. After remaining stable for a few years, the median rent in L.A. County increased rapidly in 2014 and 2015, with a peak year-over-year increase of 8.2 percent from June 2014 to June 2015.

Zillow’s rental index is calculated to reflect changes in the monthly median rent and account for fluctuations in the kinds of homes that are available to rent. This makes it suitable for comparisons, but individual data points are not a reliable indicator of median rent at the time.

It’s not obvious what led to soaring rents, but the trend has not slowed down. Zillow found that in July 2017, the median rent was more than 4 percent higher than a year earlier.

Official income data isn’t available after 2015, which makes it impossible to identify whether rent increases continue to outpace changes in income. Both the state of California and the city of Los Angeles have increased the minimum wage since 2015, to $10 and $12, respectively. Those minimums are set to increase to $15 in the coming years.

California’s statewide minimum wage had increased during the survey period before 2015, but those changes didn’t seem to affect the real dollars Angelenos could afford to spend after accounting for inflation. For example, the state minimum wage reached $9 per hour in July 2014, but the real median household income in L.A. County remained essentially unchanged.

The increase in rental costs might have had major impacts on individual lives. According to municipal government data, the number of homeless people in the Los Angeles area increased by 12 percent from 2013 to 2015, as rent prices increased dramatically.

That city and county data, compiled by the Los Angeles Homeless Services Authority, showed an increase in the total homeless count from 35,524 to 44,359 across the survey area, which did not include the cities of Long Beach or Glendale.

Though census income data isn’t available after 2015, continuing increases in rents and the numbers of homeless people suggest that this trend increased. The municipal governments’ 2017 homeless survey found that 55,188 people lived without homes in the L.A. area, an increase of 24.4 percent from 2015 and 55 percent from 2013.

Median rent has also continued to increase by sizable margins — it’s now 8 percent higher than in 2015 and 24 percent higher than in 2011, when the survey period began.