What the Market Telling Us about the Korean Peninsula Conflict

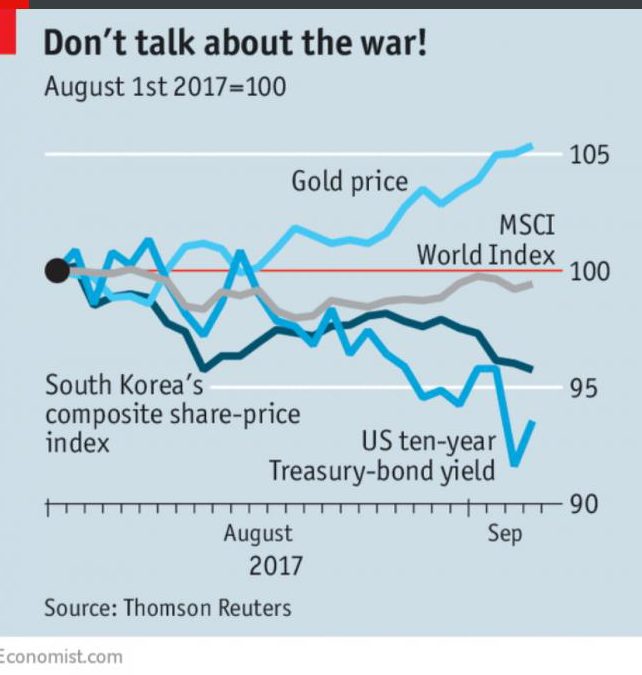
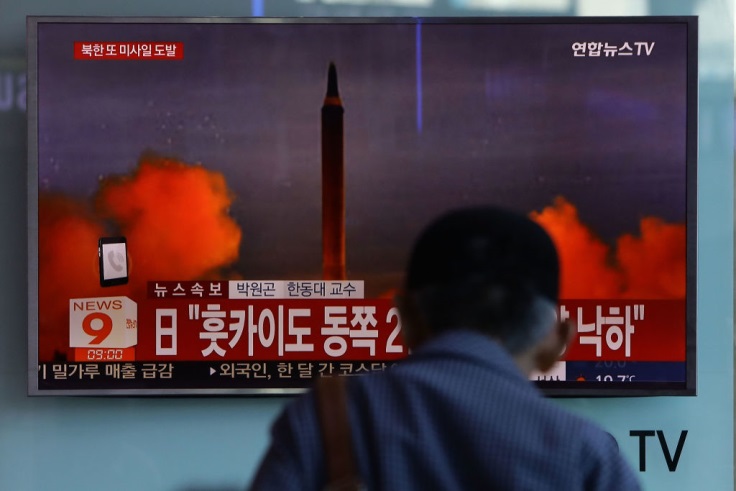
A rogue state testing hydrogen bomb sent a missile over the territory of a neighboring country. The American president promised “fire and fury” if threats continue. Sounds a lot like the plot of a Hollywood thriller, right? Tthe Market, however, doesn’t seem to think the world is heading for to conflict and chaos. International investors are relaxed about the potential crisis on the Korean peninsula, and the market stays undisturbed. According to the recent data collected by the Economist, economic indicators including the yield on Treasury bonds and the MSCI World equity index fell, while the Gold price rose in the recent month. However, these movements are not big. In fact, the South Korean stock market, which should be most sensitive to the risk war, is doing better in comparison to the start of the year.

Let us consider the terrible possibility of a conflict on the Korean Peninsula. In addition to the tragic humanitarian loss, the global economy will also suffer. Capital Economics points out that South Korea produces 40% of the world’s liquid-crystal displays and 17% of its semiconductors. If Japan was the target of missile strikes from North Korea, as it might be, the disruption would be even greater for that Japan is the world’s third largest economy.

So how can we justify the market’s insensitivity to this delicate political situation? Some propose that the market is simply not very good at assessing political risk. A recent example would be when the European market failed to foresee the result of Brexit. The vast majority of polls and markets had “remain” with a solid lead. It was only when the polls shifted towards “leave” in early June 2016 did the market moved in the same direction. Still, never once did “leave” come close to taking the lead.

Another explanation is that investors have learned in recent decades that geopolitical events tend to have only very short-term impacts on the markets. In comparison to political risks (e.g. the result of a presidential election), economic growth and corporate profits are far more important factors to consider for the investors. The reality is, no one can run enough analysis to properly assess and predict the situation with North Korea based on polls or past data.  Nevertheless, the market has made a decision that for now, they do not believe a serious incident will happen on the Korean peninsula. So let us all hope that the “wisdom of crowds” wins this time.


Big companies have Brazil addicted to junk food and its a problem

A recent investigative report by the New York Times highlighted Brazil’s addiction to junk food and the problem it has created. Companies like Nestlé and Coca-Cola among others have seen decreased profits in wealthy countries have since moved to poorer countries spread out in Latin America, Asia, and Africa. More so, these companies have brought their products directly to consumers by hiring local workers to take and deliver orders by foot. In doing so Brazil is now facing an obesity problem and much larger problems in productivity and job security as a result.

Employees of companies such as Nestlé travel across the country taking and delivering over 800 products. Customers have until the end of the month to pay for their purchase and often find themselves overindulging as a result. While the company does highlight its many healthy products the Times article did note that many end up resorting to foods high in fats and processed ingredients while offering little to no health value despite being advertised otherwise.

The report highlighted the drastic change In the health of the Brazilian people. In 1980, 7% of Brazil was considered obese. That number has since doubled to over 18%. This is directly attributed to the availability of packaged foods. From 2011 to 2016, packaged food sales grew by 25 percent worldwide compared to only 10 in the U.S. Even scarier is the sales of soft drinks which in Latin America have doubled and have since overtaken the North American region in sales.

The problem is much larger than just obesity. Companies such as Nestlé have provided thousands of men and women with jobs that pay very well. What the Brazilian government could not do, Nestlé has. The Times article chronicled a woman who with this job was able to purchase a refrigerator, television, and stove with her earnings and has since elected to save money for a new home.

With so many people becoming obese and being diagnosed with concurrent ailments such as diabetes it doesn’t help that the Brazilian healthcare system is ‘broken.’

In a report by Al Jazeera just before the onset of the Rio Olympics it was reported that federal government experienced a budget shortfall. Hospitals in the area were literally turning people away because they could not service any more patients. Some hospitals lacked basic medical supplies such as saline. Public funds were also misappropriated with $12 million USD going to a social organization contracted to support local hospitals.

Not only are hospitals suffering, but so are farmers. Fields once strewn with vegetables and fruit that comprise a healthy diet have since been replaced by soybeans, corn, and sugar. These ingredients make up the bulk of ingredients that make up processed foods.

The website WITS tracks trade statistics for countries. In 2010, soy beans were the third most exported good by Brazil. Raw cane sugar followed suit in fourth place. Both exports had a U.S. value of $11 and $9 million respectively.

Flash forward to 2015 and soy beans in particular have overtaken the top spot as the most exported product in Brazil. In five years time what was once an $11 million dollar industry has since ballooned to nearly $21 million. Cane sugar stayed in the same spot with a loss of around $3 million.

The country of Brazil is in a very tough spot. While such large corporations have certainly hurt the health of its people as well as the productivity of the country, thousands are benefiting in ways they could not previously. It will be interesting to see where Brazil goes from here.

Sources:

http://wits.worldbank.org/CountryProfile/en/Country/BRA/Year/2010/Summarytext

http://wits.worldbank.org/CountrySnapshot/en/BRA/textview

http://www.aljazeera.com/indepth/features/2016/02/brazil-broken-healthcare-system-160204075525812.html

How Big Business Got Brazil Hooked on Junk Food – The New York …


The U.S. household income increased, but there is still much to do.

The data released by the Census Bureau in the income, poverty, and health insurance report on September 12 seem to portray a healthier U.S. economy.

In fact, the annual report shows that the median household income rose by 3.2% from $57,200 in 2015 to $59,039 in 2016, and that the percentage of people living in poverty decreased in 2016 by 0.8% from the rate registered in 2015. Additionally, the data reveal a drop in the percentage of people without health insurance coverage: the value registered in 2016 was 8.8%, 0.3% less than the value registered in 2015 (Reuters).

Overall the quality of life in the United States seems to be improving and this means that the growth that the country has seen since the recession in things like the stock market, is at least to a certain extent also starting to show in households (Marketplace). Yet, skepticism lingers over the data shown in the report.

Considering other measures could help to better understand why the U.S. still has much to do to repair its economy.

The report by the Census Bureau reveals that the income inequality rate is not decreasing: there are still huge divisions in incomes because of people’s gender, race and age. Moreover, inequality between Americans is growing (The New York Times).

In addition to income inequality, there is another measure that we should take into account: supplementary poverty. As pointed out by Forbes, unlike the poverty rate, supplementary poverty considers many of the government programs designed to assist low income families and individuals that are not included in the official poverty measure. Therefore, it shows that there are many families above the official poverty level that are actually receiving government aids.

This is one of the aspects that shows there are still many open questions about how economists should measure the poverty level and what values to take into account. Despite a rise in median household income, there are a lot of people who still feel «economic frustration», because there are different factors that influence people’s wages and economic opportunities, like for example the place where they live (Marketplace).

Beside these measures, also the number of health insurance coverages raises skepticism among the experts.

Even though the percentage of householders having insurance coverage increased, a breakdown of these data could reveal a different story.

If we look at people with income at or below the poverty level, we can see that 16.3% of them lack insurance coverage: «these are people who can least afford to take on medical debt» (Forbes). This percentage is quite remarkable when compared with the 4.6% of householders above the poverty level living without insurance coverage.

Despite these issues, it seems that the U.S. economy is improving overall. This element matters a lot, since President Donald Trump has announced that he wants to reform the current tax system and cut government spending. Democrats, considering the economic improvements shown in the Census Bureau’s report, «now have more ammunition to argue that the changes Mr. Trump seeks would mess with the success » (The New York Times).

The Federal Reserve is also paying close attention to the data released by the Census Bureau and to the current status of the U.S. economy. In fact, Janet L. Yellen, the Federal Reserve chairwoman, is expected to end the Fed’s lenient monetary policy in a meeting scheduled this week; the changes that will be following could affect the current improving U.S. economy.

Yet, whatever effect the new monetary policy will have on the economy, the increase in household income and the drop in the poverty rate is a reflection of the higher number of people back in the work force and of the 2.2 million of jobs added over the past year. The growth in the number of working people is «a vivid illustration of the old maxim that a job is the best antipoverty program » (The New York Times).


Why are states required to have balanced budgets?

With over $20 trillion in amassed debt, the United States federal government is no stranger to running budget deficits. It’s essentially common and expected practice now. For college students my age, the knowledge that there used to be a balanced budget in the US comes as a surprise that almost doesn’t seem real.

But for most state and local governments across the country, balanced budgets aren’t just the norm, but the rule. According to the National Conference of State Legislatures, 43 states require their governor to propose a balanced budget, 39 require the legislature to pass one, and 37 require the budget to continue to be balanced at the end of the fiscal year. In California, the constitution requires the governor to propose a balanced budget and prohibits the passage of a budget in which General Fund expenditures from exceeding General Fund revenues. In cases like California’s, it’s hard for states to even attempt to carry a deficit because their constitutions prevent them from selling bonds to pay for it.

California’s constitution was ratified in 1879. That’s 138 years (ideally) of balanced budgets. So why can’t the federal government do the same?

Spending only as much money as you get is definitely sound fiscal policy to ensure the solvency of the state government, but it does limit what legislatures can do in times of crisis. States and local governments are reliant on taxes on sales, income, and property — revenues that fall in economic recession when people lose their jobs, lose their property, and/or don’t buy as much. At the same time, reliance on safety net welfare programs increases, putting the state in a budget crunch.

Just as in the federal government, a great deal of state spending essentially runs on autopilot and is difficult to control. States take in — and then spend — a lot of money from federal grants or reimbursements, and the way that money is spent is typically determined by the federal government. Other revenues are specifically earmarked by law, such as money from lottery sales or gas taxes. And in other cases, like Proposition 98 in California, the state is required to spend a certain amount of money on specific departments. (Proposition 98 requires California to spend increasing amounts on education based on economic and enrollment growth).

A lack of flexibility can lead to desperate actions when the economy falters. Governments freeze hiring, stop maintaining buildings, cut back services, furlough employees, or renegotiate pension agreements. In 2009, Arizona was so desperate to balance its budget that it sold public buildings as a way to get money fast — including the Capitol, the state fairgrounds, and some prisons. These cuts can have further impacts on what we typically perceive as economic recovery, since state and local government spending makes up about 12 percent of GDP.

Whether this is good or bad depends in many ways on ideology. If state and local governments were allowed to follow the Keynesian model and spend their way out of an economic downturn, that would allow for even more powerful economic recovery efforts. But followers of Friedrich Hayek’s thinking would say that cutting state budgets in times of crisis keeps us rooted in the reality of the services our government gives us — and what they’re worth.

How is the Economy Weathering the Storm?     

It is not surprising that the devastation in the wake of Hurricane Irma and Hurricane Harvey is significant. Not only did the consecutive hurricanes demolish everything in their paths, they could also have a significant impact on the GDP as a whole. Goldman Sachs “sees GDP expanding by 2% during the period, down 0.8 percentage points from its previous forecast” after the destruction took place in Texas, Florida and Louisiana. Hurricane Irma has racked up more expenses and impacted more people than Hurricane Harvey, which hit just a month prior, and Hurricane Katrina back in 2014. Even if the hurricanes weakened before it hit land and resulted in minimal to no damage, the preparation, evacuation and complete halt to a segment of the economy is significant and that does not include the damage in the aftermath. As for direct impacts to the GDP, accrued loss to oil and energy will have an impact on the GDP growth. Not only do the hurricanes ruin working infrastructure, but it displaces the people responsible for consumption and production. Depending on how quickly everything can be reconstructed, that displacement could last a while. Another aspect of the measurement of damage is that the real accumulation of destruction cannot be determined until the water is cleared, a majority of the city is cleaned up and the economy moves forward. It just takes time to measure the breadth of the storms in the aftermath. With that being said, these are all predictions for how the economy will be ultimately impacted at this time. Like we have mentioned in class, confidence is a key factor as a leading indicator for the economy. So, if people think that the damage is a lot worse than it is, the market will reflect that with people pulling out of investments from the areas and businesses affected by the storms.

Not only are the economic environments in the states where the hurricanes hit affected, but the entire country could feel the ripple effect of those record-breaking storms. According to JLT Re, a global reinsurance brokerage and consulting firm, “the estimated U.S. insured losses, excluding any National Flood Insurance Program claims, are $20 billion to $25 billion from Harvey and $40 billion to $60 billion from Irma.” Keep in mind, it is still too early to tell the exact effects of the hurricanes and if it causes a significant impact on Americans who live outside of the areas hit. The government will be responsible for a big chunk of the cost due flood insurance, which is not included in home owner’s insurance and is the government’s responsibility. Both hurricanes have the potential to be two of the most expensive, not only from an economic perspective, but a human one, which does not look promising for the commercial property insurance market.

But, from a Keynesian perspective, there will be financial and personal suffering initially, however, in terms of the greater economy, it will not be too disastrous and probably be better for jobs and the construction business. With reconstruction and relief efforts, a lot of money will be pumped back into the economy of those respective cities which will allow the economy to somewhat bounce back. I know there does not seem to be a light at the end of the tunnel at the moment, but the economy will weather this storm and re-stabilize. It will just take time. It definitely did not ease the blow that two devastating hurricanes hit within a month of one another, there is a potential Hurricane Jose on the horizon and more, but our flexible economy will be alright, even if it is at the cost of short term anguish.

A Speculated Economic Silver Lining Brightens the Shadow of a Natural Disaster: How the U.S. Economy could benefit from Hurricane Harvey

The ruthless storm battering Houston, Texas is said to rank as one of the nation’s costliest disasters, with speculated loss of tens of billions of dollars in economic activity and property damage in an area critical to chemical, energy, and shipping industries.


Despite the widespread devastation and predicted losses of up to $100 billion, economists vocalized optimism that the Texas city is likely to recover quickly and may experience economic growth from rebuilding efforts.


Historically, the U.S. economy has rebounded following natural disasters, most easily associated with the financial resurgence following the $40 billion loss from Hurricane Katrina in 2005 and the $25 billion loss from Hurricane Ike in 2008. Dan Laufenberg, chief economist at Ameriprise Financial, stated, “the U.S. economy rebounded from Katrina, although the region hit by the storm has not, demonstrating once again how amazingly resilient our economy can be.”


The Houston metropolitan area, the U.S.’s fifth largest based on population, accounts for approximately 3 percent of the nation’s gross domestic product (GDP). Texas is often attributed as a center for oil production and refined products like diesel fuel, gasoline, heating oil, and other distillates.


In anticipation of increased demand due to the hurricane, wholesale trading prices for gasoline increased 6 cents to $1.75 per gallon on the benchmark contract set to settle next month. Ellen Zentner, chief United States economist at Morgan Stanley, suggested the lagged effects of rebuilding homes and replacing motor vehicles will outlast the anticipated neutral impact on national gross domestic product in the third quarter, providing a lift to GDP in the fourth quarter and beyond.

Californian Magic Is Real – The GDP Says So

In many aspects, California has been seen as a unique case – at times an anomaly, even – of an American state. During the Rio Olympics there were many mentions of how many medals from the American roster belonged to California, and how that number would compare to other competing countries. When it comes to GDP, one can most definitely expect the similar kind of discussion taking place, especially in the current political atmosphere where the intensely progressive and liberal California stands among an overall right-leaning U.S.A..

The above graph shows California’s annual GDP growth since 2000. As the data suggests, California’s economy has remained largely healthy throughout the way, only taking a reasonable hit upon entering the 2008 Financial Crisis. However, as Bloomberg noted, California has seen a surprisingly speedy recovery compared to the rest of the nation, which the news agency accredited to the state’s liberal cultural-political environment, even going as far as saying that California “is the chief reason America is the only developed economy to achieve record GDP growth since the financial crisis of 2008 and ensuing global recession”.

The article attributed California’s “magic” to its left-leaning policies, such as securing a strong labor force through laws favoring immigrants. At a time where the President has been very outspoken against the topic, California strives to do the exact opposite, by exercising its autonomy on a state level. From raising taxes instead of lowering to encouraging companies to globalize rather than discouraging, California is almost a “rebellious child” in the eyes of the federal government. However, this rebellion has proven successful, as California’s real GDP growth maintained an upward momentum since climbing out of the recession until 2015, where it attained 4.4% while the entire country had only seen 2.6% that year.

There is no reason to believe that California would change course from what it has been doing and what has been working under the Trump administration. In fact, the President’s orders would act as the inverse-compass for the Californian economy. Despite having seen a dip in 2016, California does not seem to concern itself with this little hiccup, and from the looks of its policies, the state is set on remaining being that “problem child” in Mr. Trump’s classroom.

The Quality of Our Dining Foreshadows the Health of Our Economy

There is an idiom expression in China saying that “hunger breeds discontentment.” It is not hard to understand that people are less likely to spend money on fancy meal and dining environment when the economy is bad. With little money in their pocket, people tend to turn to fast-food or eat at home, and the restaurant business goes down. Thus the Performance of the Restaurant Industry is a significant indicator of the health of our economy.

According to the National Restaurant Association(NRA), Restaurant industry sales constitute 4 percent of the U.S. GDP. The president of NRA Dawn Sweeney said restaurant business also stimulates employment and generates tax revenues. He said, “What’s more, for every dollar spent in restaurants, an additional $2 is generated in sales for other industries, generating even more tax dollars and economic activity.”

RPI Index

The Restaurant Performance Index provided by the National Restaurant Association examines a comprehensive health of the U.S. restaurant industry, including sales, traffic, labor and capital expenditures. If the index value is above 100, it means the American restaurant business is growing during this period of time. An index value below 100 means this business is shrinking.

If we compare this chart to the United States GDP, we could see a general trend that the RPI and GDP have a positive relationship. The higher RPI foreshadows a growing GDP, usually about one year ahead. For example, RPI falled below 100 value after 2007, while American confronted a recession in 2008. While RPI started to recover after 2009, the GDP began to increase after 2010.

American GDP Chart

Stifel analyst Paul Westra and his team believe that “US restaurants are showing signs of heading toward a sector-wide recession.” Restaurant spending is a strong indicator of consumer behaving, which is a large part of American economic growth. It also demonstrates people’s confidence about their money. Stifel’s team said “Restaurants have historically led the market lower during the 3-to-6-month periods prior to the start of the prior three US recessions”. The RPI and GDP charts above has backed up Stifel’s statement.

The RPI Index for 2017 is pretty close to the value of 100. Westra said, “restaurant performance this year, particularly in the second quarter, is shaping up to look pretty similar to the second half of 2000 and the first half of 2007 – the periods that immediately preceded the last two U.S. recessions.” If the history repeats itself, it means 2018 might become the beginning of another U.S. recession period.

At Least You’re Always Ready for a Night Out?

The lipstick index, created by chairman of Estée Lauder Leonard Lauder in 2011, is the theory that consumers are ready to indulge in cheaper—yet still satisfying—purchases like lipsticks over expensive items like designer bags in rough economic times such as the recession, according to U.S. News.

Lauder “hypothesized that lipstick purchases are a way to gauge the economy. When it’s shaky, he said, sales increase as women boost their mood with inexpensive lipstick purchases instead of $500 slingbacks” (qtd. in New York Times).

In other words, when the economy is low, people are stressed or depressed and what is one way we reduce or momentarily solve that problem? Shopping—but we can’t splurge and treat ourselves with overpriced items so we resolve to the little things in life like a new set of lipsticks.

Although “[this] theory has been debunked many times,” according to Forbes, personally, it is very simple: our morale may be low but at least we look great.

Not to mention, lipstick are not “inferior goods,” as said by the New York Times. In fact, they’re a luxury item that boosts one’s confidence—I don’t think of it as second choice to, for example, a pair of $300 shoes I would have bought instead, but as a deserving little bonus gift for myself that provides me a different kind of happiness. An example of an inferior good would be choosing Taco Bell over having dinner at my favorite taqueria, Gordos, because I should be saving the money.

Sarah Hill and four other researchers studied Lauder’s theory, which was published in the Journal of Personality and Social Psychology, “[confirming] that the lipstick effect is not only real, but deeply rooted in women’s mating psychology” (Scientific American). Hill explains that in a time of economic instability where unemployment rates are high, women want to look their best to attract the financially stable opposite sex who is scarce during recession.

But lipstick sales have been declining since 2007 while sale polish “are up since the first half of 2008,” according to market research firm Mintel (qtd. in Times). Lauder responds that “[nail] polish] is the new lipstick” in Times, and once again reiterates his lipstick index as an idea on the significance of succumbing to smaller luxury items like beauty products, regardless of what it is, during hard financial times.

In times of economic despair, romance is in the air?

Could having a successful love life also be attributed to economic downturn? The New York Times reported that Match.com reached more dating app first dates are initiated when market sentiments are low.

With the advent of online based dating sites, a swath of analytics are available to derive sociological meaning from. Match.com’s data shows strong correlations of ambitious first dates right around the time the economy tanks.

Despite sky-rocked unemployment rates, foreclosures, and failing businesses in the thick of the 2008 recession, Match.com saw their fall quarter as their busiest period in seven years (since post 9/11 woes). Even with monthly fees of $60, eHarmony.com reported a 20% increase in membership, and OkCupid saw a 50% increase in activity. Misery loves company, and with the increasing distrust in financial institutions, many looked for stability in romantic partnerships. In fact, Match.com and eHarmony.com logged some of their highest traffic volumes on days when the Dow Jones took a nose dive.

Tighter personal budgets prompt less discretionary spending, which includes small luxuries such as going out for drinks, where people typically meet with the goal of finding romantic prospects. Singles no longer need to spend money buying a potential partner drinks when first meeting them. Neurologists also say that good first dates release brain chemicals that can ease worries in other spheres of one’s life (e.g. layoffs, plummeting stocks, etc.)

In the long run, finding a partner and splitting bills is cost effective. In tough times, the idea of sharing bank accounts and receiving tax benefits incentivizes the subconscious desire for marriage.

Should hopeless romantics look forward to a dip in the market for better chances of finding love? While the choice between financial stability and love is certainly not a zero-sum game, the data doesn’t lie in times of economic woes bringing together more singles. Akin to the unemployment rate, perhaps it is worth looking at the spikes and drops in singles actively pursuing relationships.


References:

http://www.businessinsider.com/bizarre-economic-indicators-2012-8#the-first-date-indicator-18

http://www.cnn.com/2009/LIVING/personal/02/25/tf.online.dating.recession/

http://www.chicagotribune.com/sns-onlinedating-doingwell-story.html

http://www.sandiegouniontribune.com/sdut-us-downturn-dating-070409-2009jul04-story.html