Your Economy Is What You Eat

Within the United States’ precarious political environment, many Americans live in fear that the economy will dip into a deep recession like that of the housing crisis, which occurred not even a decade ago. These nerves are rational, as our market economy is cyclical. Periods of growth have always inevitably been met with periods of recession.

Economic indicators can help us to analyze the economy. Studying trends in retail sales, unemployment, etc. can help us make educated guesses as to where the economy is and where it is going. An interesting economic indicator we can use to analyze these trends is restaurant sales.

In an economy with contracting growth, individuals and families may feel their first inklings of strain in terms of food. In an unhealthy economy, the dollar might be devalued and workers may be laid off, which would lead to a decrease in consumption, which accounts for almost two thirds of the U.S.’s GDP. Consumption measures what is spent on goods and services produced in the United States. Even though it is only a portion of a nation’s GDP, consumption can be used to help predict the future of an economy, especially in a country like America because its consumption is relatively high in comparison with other economic variables.

If an economy is shrinking, one of the first areas of decline is restaurant sales. Economically strained Americans first tighten their finances by refraining from eating out. Food as a commodity is a short-lived luxury, since after you eat it, it’s gone for good. Therefore, food, especially going out to eat, is one of the first areas in which people start to cut back when trying to save money. Declining restaurant sales are an indicator that economic growth is slowing.

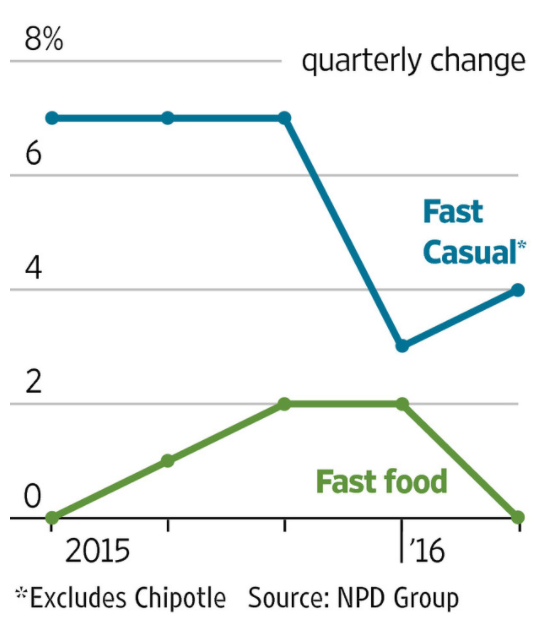
Within slowing or flat restaurant sales reports is a hierarchy. The first types of restaurants to feel decreases in sales are full-service, sit-down restaurants. They’re the first to go for individuals trying to save because they are the most draining of important resources, e.g. time and money. Next comes fast casual restaurants, whose sales’ declines mean that there is much more financial strain amongst a nation’s citizens, leading financial experts to turn decidedly bearish on them. Decisions like these lead to less valuable restaurant stocks.

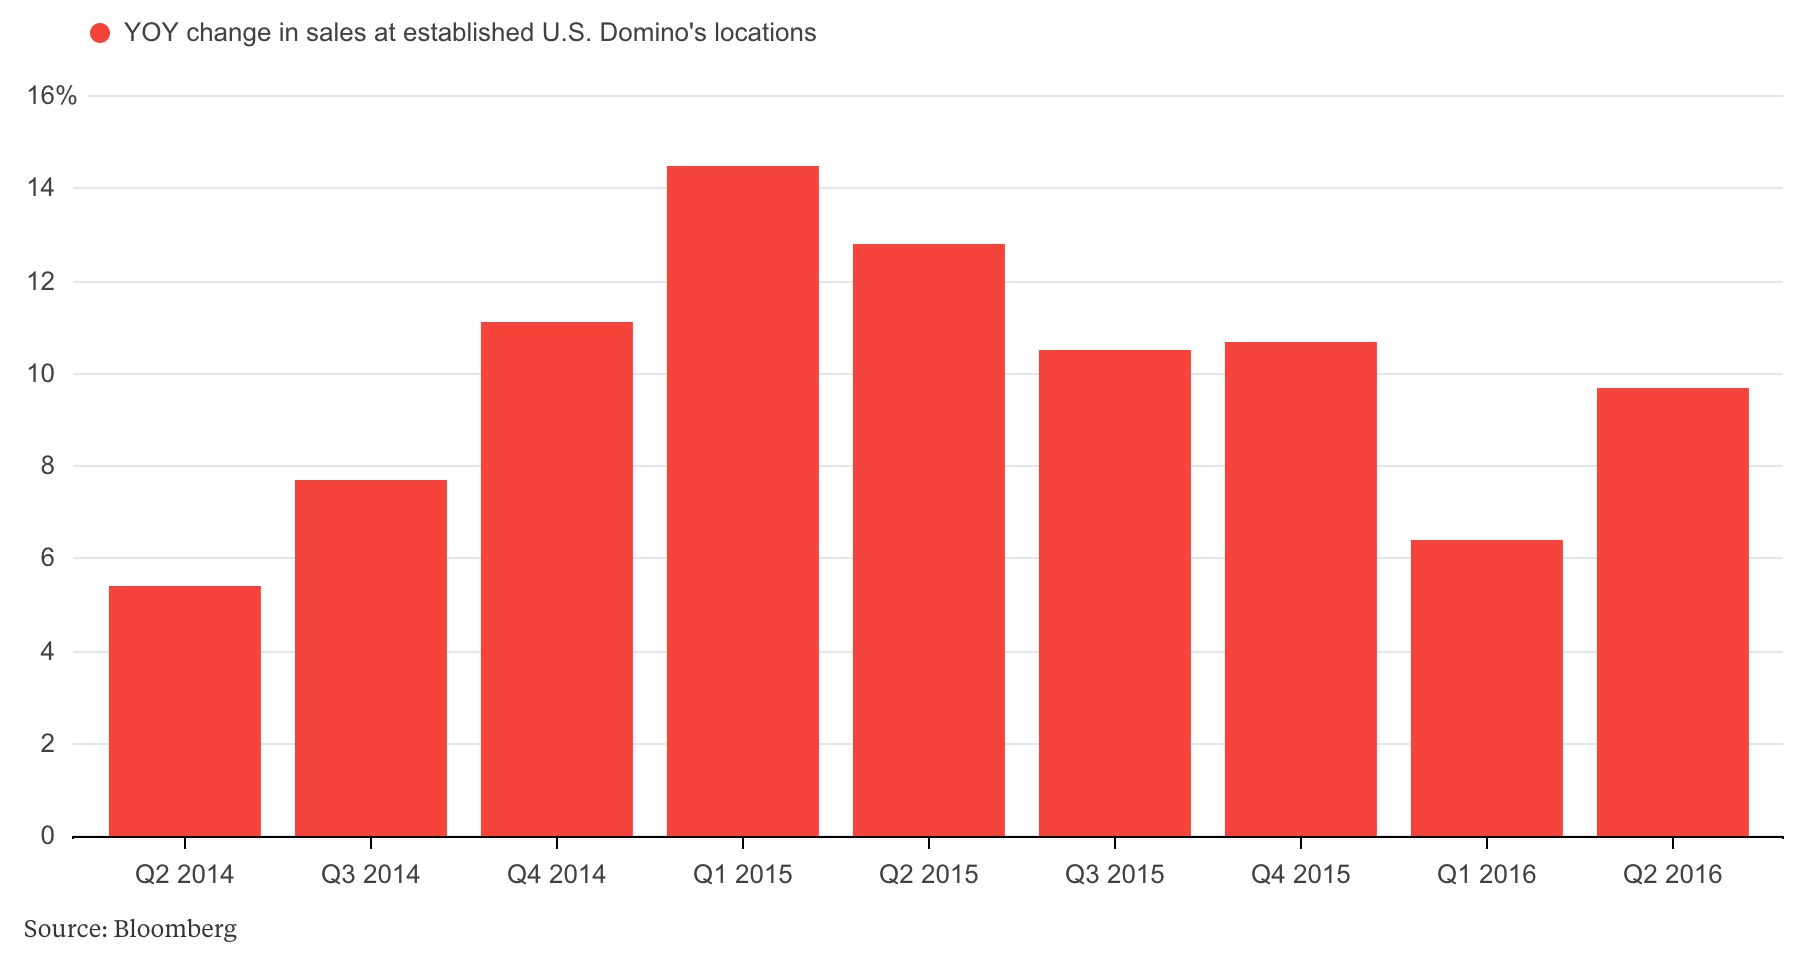
However, not all trends in restaurant sales decline when Americans are nervous about the economy. An example of an outlier is pizza. As Bloomberg reports, in June of 2016, restaurant sales were flat, the lowest growth in sales since 2013. In contrast, Domino’s continued growing, with sales toping 5% for Q2 2014 – Q2 2016. Bloomberg Intelligence Analyst Michael Halen explains that Pizza does well in recessions due to its value proposition–moneymakers feel frugal spending $7.99 on a large pizza to feed their families.

Many other aspects of food can be economic indicators. Increases in grocery store sales indicate that more people are eating in and thus trying to save money. And similar to pizza shops, fast-food chains tend to do well during recession due to consumers’ value propositions. Hugo Lindgren of New York magazine went so far as to publish the “Hot Waitress Economic Index” explaining that during slow, flat, or declining economic growth, restaurant servers are more attractive, assuming that attractive people tend to find higher-paying work during good economic times.

Economic indicators are measurements collected to assist in hypothesizing the future of the economy. They are useful only with supportive data and examined in long-term contexts. Some indicators are estimated by governmental organizations or professional private companies. However, some are more suitable for normal citizens, like pizza.

Other sources: Eater Wall Street Journal Forbes 


Housing Vacancy Rates

The economic indicator of housing vacancies and homeownership delves into the overall status of homeowners and renters, particularly the vacant rates. Rental and homeowner vacancy rates are obtainable for U.S. regions, states and for the 75 largest Metropolitan Statistical Areas (MSAs), and information about geographies are accessible both quarterly and annually, according to census.gov.

The real question is, how do we decipher these rates in the short term (the past few years) and in the long term (a decade or longer)? What does an understanding of these rates tell us about housing issues in the United States?

As of July 27, 2017, the rental vacancy rate was 7.3 percent, and the homeowner vacancy rate was 1.5 percent. These numbers have noticeably improved (decreased) since 2010. In fact, from 1995 to 2017, the rental vacancy rate hit its highest number in 2010, a 10.23 percent average in all four quarters. The homeowner vacancy rate was usually around 1.5 percent over that time span, but it obviously rose when the U.S. economy entered a recession in late 2007 and spiked close to 3 percent.

Since 1995, the rental and homeowner vacancy rates are able to stay more or less intact even though the median asking rent has continuously increased, while the median asking sales price for vacant houses can increase and decrease in somewhat of a cyclical fashion, falling when the prices get too high and outweigh demand. Via information from the United States Census Bureau, the median asking sales prices for vacant units climbed up to around $200,000 but began a steep decline once the 2007 recession arrived.

After leveling out for a few years, the median asking sales price has begun the upward trend again and, measured at $177,200 in the second quarter of 2017, is on pace to eclipse $200,000. Rental and homeowner vacancy rates can continue to stay low, but if the numbers compiled on the graphs of recent years tell us something, it’s that troughs follow peaks, even if skyrocketing prices and lower unemployment rates make the economy seem like it’s booming.

Rental and homeowner vacancy rates help describe important characteristics which define value in a marketplace: supply and demand. If more and more people are buying and renting houses, you’d expect the vacancy rates to be lower. In this case, the supply of housing is getting less and less, and the demand for housing is likely higher. Therefore, rental and home sales prices should increase, making the housing market unkind to a significant portion of regular people.

“The irony of the modern housing market is that the places where we are seeing wage growth are places where people can’t live because they are too un-affordable,” said Nela Richardson, chief economist at real estate brokerage Redfin, per Forbes.

Now, economists must deal with the possibility of housing prices becoming overinflated, as they hope for the market to stay stable over the next decade or two.

Los Angeles rents soared as wages stagnated

Rent prices in Los Angeles County increased by nearly 15 percent over a recent period as wages remained unchanged, putting pressure on renters to find other ways to make ends meet or face potential homelessness.

The U.S. Census Bureau pegged the median household income in L.A. County at $56,196 in 2015, the most recent year for which data are available. That was virtually the same as in 2011, when that figure was $56,266 in inflation-adjusted 2015 dollars.

But over the same period, rental prices in the area shot up increasingly quickly. Rental website Zillow, which compiles nationwide home and rental data, found that the median monthly rent increased by 14.5 percent from the end of 2011 to the end of 2015.

That increase didn’t happen steadily. Instead, rents increased significantly in a short period of time. After remaining stable for a few years, the median rent in L.A. County increased rapidly in 2014 and 2015, with a peak year-over-year increase of 8.2 percent from June 2014 to June 2015.

Zillow’s rental index is calculated to reflect changes in the monthly median rent and account for fluctuations in the kinds of homes that are available to rent. This makes it suitable for comparisons, but individual data points are not a reliable indicator of median rent at the time.

It’s not obvious what led to soaring rents, but the trend has not slowed down. Zillow found that in July 2017, the median rent was more than 4 percent higher than a year earlier.

Official income data isn’t available after 2015, which makes it impossible to identify whether rent increases continue to outpace changes in income. Both the state of California and the city of Los Angeles have increased the minimum wage since 2015, to $10 and $12, respectively. Those minimums are set to increase to $15 in the coming years.

California’s statewide minimum wage had increased during the survey period before 2015, but those changes didn’t seem to affect the real dollars Angelenos could afford to spend after accounting for inflation. For example, the state minimum wage reached $9 per hour in July 2014, but the real median household income in L.A. County remained essentially unchanged.

The increase in rental costs might have had major impacts on individual lives. According to municipal government data, the number of homeless people in the Los Angeles area increased by 12 percent from 2013 to 2015, as rent prices increased dramatically.

That city and county data, compiled by the Los Angeles Homeless Services Authority, showed an increase in the total homeless count from 35,524 to 44,359 across the survey area, which did not include the cities of Long Beach or Glendale.

Though census income data isn’t available after 2015, continuing increases in rents and the numbers of homeless people suggest that this trend increased. The municipal governments’ 2017 homeless survey found that 55,188 people lived without homes in the L.A. area, an increase of 24.4 percent from 2015 and 55 percent from 2013.

Median rent has also continued to increase by sizable margins — it’s now 8 percent higher than in 2015 and 24 percent higher than in 2011, when the survey period began.

California’s housing crisis: What gives?

It’s no new news that California is experiencing a housing crisis. Just how bad the crisis is might surprise you.

The San Jose Mercury News published an in-depth investigation into the current crisis and finally answered the question: “What gives?” and most importantly “What’s next?”

Home ownership in California is at an all-time low since World War II. The average home price is 2.5 times higher than the average price nationally. With a median cost of around $437,000 more and more people are choosing to rent instead of buy.

While renting may seem like the better option it still takes a toll on residents as nearly 70 percent of poor Californians see most of their paychecks go to constantly rising rent. Couple the cost of rent with student loan debt and you have a crisis.

It can be said that while rent is infinitely more expensive in California than other places, residents are still getting paid more. This is indeed true, however, hidden within the truth is the fact that income has not kept pace with rising home costs.

This large income inequality has led many to move out of California, namely those living on the poverty line. From 2000-2015 800,000 residents have moved out of California to other states including Texas. The average income for the thousands that left in 2007 was $50,000.

Those who choose to tough it out and stay in California often become homeless. Between 2015 and 2016, California saw an uptick in homelessness of about 2,400 people. Housing data website, Zillow estimates that a 5% rent increase in Los Angeles would result in an additional 2,000 homeless people. So far rent has increased 4%.

The study found that such a crisis has large repercussions on the economy as a whole. The McKinsey Global Institute found such crisis cost the economy between $143 billion and $233 billion annually.

So how can California fix its problem before the bubble bursts? The state will once again tackle its long-awaited housing package again this month. While help may be on the way it won’t fix the problem entirely. According to the Legislative Analysts Office, helping the 1.7 million poorest residents would cost around $15 billion at the very least. The Los Angeles times estimates that of the three bills being considered only 25% of that estimation would be provided.

One Rate Does Not Make a Summer, But May Indicate a Mild Fall

It is almost the end of August and this summer seems to have brought positive news to both the U.S. and European markets. The latter especially may now breathe a sigh of relief since, as the Wall Street Journal reported on Aug. 24, 2017, even the weakest European economies such as the Greek, the Portuguese, and the Spanish have been showing growth over the last year. Along with them, the Italian economy seems to be enjoying a substantial reversal in its usual downward trend, as shown by the steady decrease of the unemployment rate released by Istat, the Italian National Institute of Statistics, on June 7.

These developments are being reported just as the Federal Reserve’s annual conference is taking place in Jackson Hole, Wyoming, where Mario Draghi, president of the European Central Bank, and Janet L. Yellen, the Federal Reserve chairwoman, will speak about the future of the European and U.S. monetary policies for the year to come. Their speeches will focus on whether the current lenient regulations will be removed.

The decision on this very hot topic—appropriate for the end of summer—might affect the improvements shown by the delicate economies of the Eurozone, such as Italy’s, which has been reinvigorated by the positive unemployment and employment figures released in June 2017.

Why do these rates matter? Even though they are mere numbers, they stand for people; people who have been struggling to find jobs. As reported by the Italian business newspaper Il Sole24ore,  the unemployment rate decreased 0.2 percent from May to June of 2017, and has settled at the level of fall 2012—when Italy reached its lowest unemployment rate. This news has created confidence among markets, entrepreneurs, and investors.

The recovery of Italy’s economy was also reported by Quartz and Bloomberg this month; these two media outlets showed that the Italian GDP increased by 0.4 percent in the last quarter, thanks to added value of manufacturing and services, as Lorenzo Totaro wrote on Aug. 16, 2017, on Bloomberg; this GDP increase reflects the larger number of employed people.

These indicators have also revealed another interesting aspect of the story: the employment rate of the female population has increased by 0.7 percent from June 2016 to June 2017, reaching the threshold of 48.8 percent. Women are more likely to be unemployed in Italy; this upturn signals a great change in the economy of the country.

In this scenario of mild recovery and optimism, the decision of whether to pull back the current stimulating monetary policy is very important for a country such as Italy, whose policies and efforts seem to be heading in the right direction. Certainly, as recently stated by Carlo Calenda, minister for economic development, and Ignazio Visco, governor of the Bank of Italy, the improvements observed through the lenses of economic indicators such as the GDP or the unemployment and employment rates do not mean that Italy has completely recovered from its financial crisis (Corriere della Sera, Aug. 24, 2017); the country still needs reforms to encourage business innovation, and support the work life of employees.

“For the first time in ten years all the major economies of the planet are growing,” (Marketplace, Aug. 24, 2017) and what might happen to Italy after the Federal Reserve’s annual conference concerns European countries as well as the U.S. We have to wait to see if this new wave of economic growth will be fostered and advanced by the new regulations that will be implemented by Mr. Draghi and Ms. Yellen at Jackson Hole. All we know now is that the enthusiasm about Italy’s steady growth is based on solid facts, and it is part of a remarkable turnover regarding the entire Eurozone.

Unemployment Rate Forecast; source: tradingeconomics.com/italy/unemployed-persons/forecast


The Economic Resilience of the Movies

In 2008 when much of the economy was in decline and unemployment was on the rise, the movie industry had a happier story to tell.

In during the great recession in 2007 and 2008, instead of seeing a sharp decline in movie ticket purchases there was instead there was minimal change. Movie ticket sales and the health of our economy are not correlated and therefore box office performance is not a good indicator of the state of our economy.

The box offices’ struggles are not aligned with the rest of the economy. In away they are immune from traditional market down turns.

At first glance, the film industry doing well doing a recession seems counterintuitive. Entertainment is generally seen as an extra budget item that would be cut when money is tighter. However, the movies are like an escape from the real world. When times are tough people can take refuge in the world of the movies. Therefore, the film industry instead of experiencing a slump during the recession it continued to succeed.

The top grossing films of 2007 and 2008 were Spider-Man 3 and The Dark Knight respectively. Both films provide an element of fantasy and heroism. They have the ability to transport the viewer to a different world, one that isn’t their economically dim reality. They gave an escape people craved.

Box office sales did not take a major hit during the great recession, however, they have been hit with a subtle decline in recent history. According to The Numbers, the peak of movie ticket sales was 2002 when approximately 1.5 billion tickets were sold. That is almost 200 million more tickets sold than in 2016.

The decline in box office sales could be a reflection of the changing economy of how we watch movies. There has been a trend towards watching movies at home rather than in theaters. A 2006 Pew Research study found that 75% of Americans would rather watch a movie at home than in a theater up from 67% in 1995. The Pew study is supported by a 2015 CBS News poll which found that a majority of Americans preferred watching movies at home and 84% of Americans watch more movies at home than in theaters

One of the factors in declining movie theater ticket sales is online streaming, with Netflix being the biggest player in the streaming field. In the same time period where movie ticket sales have been declining Netflix has been expanding its subscriber base. Netflix has gone from almost 7.5million subscribers in 2007 to almost 100 million domestic and international subscribers, according to Business Insider and Statista.

The movie industry has been for the most part immune to the ups and downs of the economy. Box office sales are not the key to unlocking the health of the economy, rather they tell us something about the psyche of the nation. Even when times are tough we crave the escapism that the movies provide. Through the ups and downs of the economy, the movies have proved to be resilient.


Sources: 

The Numbers 

Business Insider 

Fortune 

Pew Research

CBS News

Old Banknotes Can’t Be Swept Out Easily in India; Neither Can Old Problems

On Nov. 8, the Narendra Modi government surprised India with a declaration banning 500- and 1,000-rupee notes (Rs500 and Rs1, 000) to tackle black money and corruption. The demonetization policy may be well intentioned, but it has brought up unintended consequences over the domestic economy in India.

Rs500 and Rs1, 000 were India’s two biggest notes that and accounted for 86 percent of the money in circulation by value. According to the announcement, all citizens will have until Dec. 30, 2016 to exchange the old banknotes at bank branches. People seeking to replace more than Rs250,000 (about $3,650) must explain why they hold the cash. Those who fail to do so must pay a penalty.

Due to the large number of notes and the short replacement period, Indian banks and ATMs have long queues as people rush to exchange old notes for new ones. The government can’t print enough new notes to fulfill the demand. Till Dec. 10, the banks have received Rs12.4 trillion as deposits but only released Rs4 trillion back into the system as of 5 December.

People queue as they wait to exchange or deposit their old high denomination banknotes in Jammu, India. Photograph: Mukesh Gupta/Reuters

As a normal economy influence, the lack of cash led to a soft inflation on the market. Food inflation in November softened to 2.11 percent from 3.32 percent a month ago, according to data released by the Central Statistics Office. Retail inflation also decreased from 4.2 percent a month ago to 3.63 percent.

However, the demonetization of high-value currency notes has had a negative impact on the Indian economy. The lack of electronic bank accessibility and wireless payment in India has magnified the effect of insufficient cash on the business activities of investors and consumers. The overall industrial output decreased by 1.9 percent compared to before demonetization, according to the industrial production data.

There are worries about the money liquidity problem. “The Reserve Bank of India is likely to outline measures to manage the systemic liquidity, which would be of interest to the banks, and provide some timeframe by which cash liquidity would increase, that would be of significance to the public,” said Naresh Takkar, managing director at ICRA Ltd., the local unit of Moody’s Investors Service.

The original goal for the government’s demonetization policy is to tackle black money — cash that is not declared to avoid taxation or that is obtained via corrupt practices. But according to the New York Times, the vast majority of black money in India isn’t money at all. It’s held in gold and silver, real estate and overseas bank accounts. The requirement also stimulated a new black market where people can break old notes into smaller ones by illegal couriers.

Demonetization alone can’t tackle the issues of black money and corruption. More actions toward improving policies for administration transparency, tax regulation and the modern online bank tracing system are needed.

Work Cited:

India pulled 86% of its cash out of circulation. It’s not going well.

http://www.vox.com/world/2016/11/29/13763070/india-modi-cash-demonetization-protests

Cash-Crisis India Looks Likely to Cut Rates

https://www.bloomberg.com/news/articles/2016-12-06/india-decision-day-guide-seeking-clarity-on-the-cash-clampdown

In India, Black Money Makes for Bad Policy

http://www.nytimes.com/2016/11/27/opinion/in-india-black-money-makes-for-bad-policy.html

How India’s Cash Chaos Is Shaking Everyone From Families to Banks

https://www.bloomberg.com/news/articles/2016-11-21/india-s-cash-chaos-by-the-numbers-guide-to-banknote-revamp

New note ban rules and regulations as of 14 December

http://www.livemint.com/Politics/p1VV2avZvT2hWIrc07PBfJ/New-note-ban-rules-and-regulations-as-of-14-December.html

Economic Implications of Normalizing Relations Between the U.S. and Cuba

In 1961 the U.S. severed diplomatic ties with Cuba. As of December 2014, the U.S. and Cuba started to restore formal diplomatic relations for the first time in more than half a century. The U.S. moved to relax restrictions on trade, commerce and financial transactions with Cuba, though the comprehensive trade embargo for years is unlikely to be lifted at once.

Since the 1960s, the U.S. administrations have maintained the policy of economic sanctions of Cuba. Cuba depends primarily on three suppliers to meet its import needs. In 2014, Venezuela was the leading supplier of Cuban imports, with 35 percent share. The EU supplied 23 percent of total Cuban imports, while China accounted for 11 percent. Venezuela, the EU, and China together accounted for 69 percent of total Cuban imports in 2014. By contrast, before initiating trade restrictions, the United States alone accounted for 70 percent of Cuba’s total imports in 1958. In 2014, the U.S. share was just 3 percent.

As the political relation normalized in 2014, the trade advancement is still feeble to see. The total amount of Cuba imports from the U.S. in 2015 was $180 million, down 40% ($119 million) from 2014 and down 51% from 2005. The top export categories in 2015 were meat, food waste, grain and chemical products. The agricultural products importing from the U.S. totaled $150 million, which is the leading import category.

Compared to Cuba’s import, there was no goods export to the U.S. in 2015. The EU still remains the leading partner of Cuba’s export destination.

But after the Cuba policy changes announced by the President in December 2014, the U.S. government made some regulatory changes to allow the importation of certain goods and services produced by independent Cuban entrepreneurs. The U.S. Department of Commerce’s Bureau of Industry and Security (BIS) and the U.S. Department of the Treasury’s Office of Foreign Assets Control (OFAC) have made five sets of amendments to their respective Cuba sanctions regulations. OFAC introduced a provision in January 2015 authorizing the importation of certain goods and services produced by independent Cuban entrepreneurs.

Other changes are expected to benefit the economy in both countries. American banks can now do business with Cuban customers without brokering through a third nation. It means Cuban Americans can send money to family members in back in Cuba easier than before. In 2015, Annual funds sent from the U.S. back to Cuba nearly doubled to $1.4 billion.

US citizens are now able to use their credit cards in Cuba. They can also take home up to $100 in alcohol and tobacco from the island. Still, most US travelers to Cuba will continue to be family members, academics, journalists, cultural ambassadors, and medical professionals. But US citizens don’t need to obtain permission from the US government as previous required. About 150 thousand Americans traveled to Cuba in 2015, up from 91 thousand the year before.

Though two countries has made progress toward trade and commerce, the future remains ambiguous. Fidel Castro, Cuba’s communist leader who had been in power for five decades, died on Nov. 25, 2016. Two days later, the U.S. President-elect Donald J. Trump warned that“If Cuba is unwilling to make a better deal for the Cuban people, the Cuban/American people and the U.S. as a whole, I will terminate deal.”

Black Friday 2016 Fall’s Short with Consumer Spending

After smothered in gravy and filled with, Americans across the nation begin to plot their plans of attack for the Black Friday sales. Since 1952 Americans have kicked off their Christmas shopping season at major retailers on the Friday following Thanksgiving.

The fact that Black Friday also takes place on a Friday – duh – every year is perfect for retailers looking to drive long weekend sale deals because Americans traditionally have not had to return to work the Friday after Thanksgiving. The commercial holiday is a long way from becoming outdated.   In 2015, 90% of all Americans reported that they intended to shop on the commercial holiday.  However, with the increasingly popularity and convenience of e-commerce as well as the advent of “Cyber Monday”, which made its debut back in 2005, has possibly had a negative impact on companies’ sales revenues.

Reports from 2016’s Black Friday have rolled in and while more Americans went shopping this year in stores and online than in any other year in the Black Friday weekend’s 64-year-old history, American consumers spent considerably less.

Special offers! 10 percent off! Mega Deals! Are all familiar gimmicks that attempt to grab the attention of unsuspecting bargain-loving buyers. Price discrimination is a tactic frequently used by stores around the holidays. It involves the selling of the exact same product at various prices based on different buyers willingness to pay.

There are three degrees of price discrimination. The first, which is alternatively known as perfect price discrimination, occurs when firms charge different rates for every unit consumed enabling them to capture all available consumer surplus. The second-degree involves charging different prices for different quantities, including quantity discounts for bulk purchases. An example of second-degree is when a movie theater offers discounts or deals on snack bundles as a way of getting moviegoers to spend more at the snack bar. The third-degree means charging a different price to different consumer groups like cheaper bus tickets for children and seniors or negotiated gym memberships.

According to this year’s National Retail Federation survey – released the Sunday after Black Friday – approximately 154 million Americans went shopping over the Thanksgiving weekend. An estimated 108.5 million consumers shopped online alone. The numbers indicate a considerable increase, up from the 151 million shoppers that contributed to sales revenue in 2015. Average spending per person dipped slightly from the previous year’s $299.60 to $289.19. The fall in spending is somewhat surprising when taking into consideration wage gains, continued employment growth and a rise in consumer confidence as 2016 comes to its close.

The Friday deals are not necessarily the best offered throughout the year. The day is not geared towards the benefit of the consumers, but rather a device utilized by retailers to clear end of year inventories with artificial deals and storewide discounts.   Professional shopper and Black Friday Veteran Dan de Grandpre explained it best in an interview with the New York Times: “Black Friday is about cheap stuff at cheap prices, and I mean cheap in every connotation of the word.”


Sources:

http://www.economist.com/blogs/economist-explains/2015/12/economist-explains

http://www.forbes.com/sites/tompopomaronis/2016/12/01/black-friday-and-cyber-monday-2016-lets-just-say-there-were-scary-moments/#a89dfa157517

http://www.theatlantic.com/business/archive/2014/11/11-economic-lessons-to-make-you-a-smarter-shopper-for-black-friday/383236/

http://fortune.com/2016/11/27/black-friday-nrf-shopping/

http://www.economicsonline.co.uk/Business_economics/Price_discrimination.html

Holy Moly Guacamole! Why are Avocados So Expensive?

It’s no secret that American’s love avocados.

Restaurant’s have quickly figured out that their customers crave the juicy fruit. Nowadays you can find avocados on almost any menu across the country whether it is on your toast, burger, or even as ice cream!

According to the Hass Avocado Board, American’s consumption of avocados has been increasing rapidly over the past 15 years. Furthermore, Hass avocado’s account for 95% of all consumed in the United States, reaching nearly 4.25 billion avocados in 2014.

screen-shot-2016-11-28-at-9-14-37-pm

The growth in popularity for avocados over the last two decades is due largely in part to trade restrictions between the US and Mexico that were lowered in the late 1990s. Before this, fruits (avocados) were prohibited from being shipped to the US, which meant that all of the avocados in America had to come from California. However, the state’s climate was not able to support year round production of the fruit and therefore only specific areas of the country were able to receive the product at certain times of the year. This meant that only supermarkets in close proximity to producers could sell avocados due to their short shelf life.

By lowering the restrictions in the 1990s, the avocado market in the US was revolutionized. As seen in the graph below, by 2000, 40% of all avocados sold in the US were produced out of the country and that number has now risen to over 80%.


screen-shot-2016-11-28-at-9-29-39-pm

So what’s happening now?

There are two forces that are contributing to the sharp increase in avocado prices that have been seen and made headlines over the past year: environmental change and US consumers’ increased appetite.

In the wake of California’s dramatic drought in 2015, avocado prices have almost doubled in the past year.

In early October, a Santa Ana-based Ingardia Bros. Produce. Inc. claimed that avocado prices reached $76 a case, which was the highest the company had seen in three decades.

Another contributing factor is the decreased number of avocado’s being shipped to the US from Mexico. The reason for this is unclear, although according to Ingardia produce buyer Cruz Sandoval, he argues that, “Mexican growers are holding out for more money because the California season is running dry, and there’s no other sources.”

For retailers, they are feeling the pressure immensely, as the Hass Avocado Board reports that the average unit price of avocados has gone up nearly 20 cents since December 2015.

It is also important to consider how the increase in prices will affect the fruits two key consumer groups: shoppers and restaurants.

For consumers going into the grocery store, they are more likely to notice the change in price and can make an instinctive decision on whether or not to buy more expensive avocados. For restaurants, however, the decision is more challenging as their customers still expect to have the ingredient on their menus despite the higher costs. Restaurants must then decide whether or not they will take the loss or increase prices for valuable customers.

SOURCES:

http://www.theatlantic.com/business/archive/2016/10/avocado-shortage-price-hike/504383/

https://www.washingtonpost.com/news/wonk/wp/2015/01/22/the-sudden-rise-of-the-avocado-americas-new-favorite-fruit/

http://www.ocregister.com/articles/prices-731700-mexico-avocados.html

http://www.forbes.com/sites/geoffwilliams/2016/10/31/how-the-avocado-shortage-is-affecting-chipotle-grocers-and-you/#7257eeb969f1