California’s market-based response to climate change tries to avoid the problems with markets

A layer of smog rests over the Los Angeles Basin in Sept. 2007. (Flickr user vlasta2, CC BY-NC-ND 2.0)

When California Gov. Jerry Brown signed major climate legislation in June, he returned to the spot where his predecessor, Arnold Schwarzenegger, signed his own climate law more than ten years earlier: Treasure Island.

It was an apt location. The artificial island in the San Francisco Bay was created in the 1930s to showcase California’s grandeur for the World’s Fair. Likewise, these climate bills are intended largely to demonstrate to the world that California is leading on climate change.

Schwarzenegger signed Assembly Bill 32 into law in 2006, setting the stage for the creation of California’s cap-and-trade program. A concept that’s been around for only a few decades, cap-and-trade aims to create financial incentives for polluters to adopt more eco-friendly technologies and reduce their greenhouse gas emissions. Brown extended the program to 2030 on Treasure Island and created more ambitious targets.

The state’s goal is to reach 1990 levels of greenhouse gas emissions by 2020, despite a projected population increase of nearly 37 percent over 1990. In 2017, that goal was toughened to reach 40 percent below 1990 levels by 2030.

But so far, it’s been hard to measure the cap-and-trade program’s success, and market-based approaches to the environment can have many of the same flaws and failures found in other kinds of markets. The state’s efforts to address these flaws led to redundant “complementary” policies, meaning that the centerpiece of California’s climate policy actually only plays a small part in its emissions reductions.

A modern cap-and-trade system is designed to reduce greenhouse gas emissions through a flexible market rather than one-size-fits-all regulation. By putting a price on greenhouse gases and creating a market to trade them, the system creates economic incentives for firms to reduce their emissions in the way that’s most cost-effective. To reach the state’s 2020 goal, emissions will need to be about 15 percent below a “business as usual” scenario.
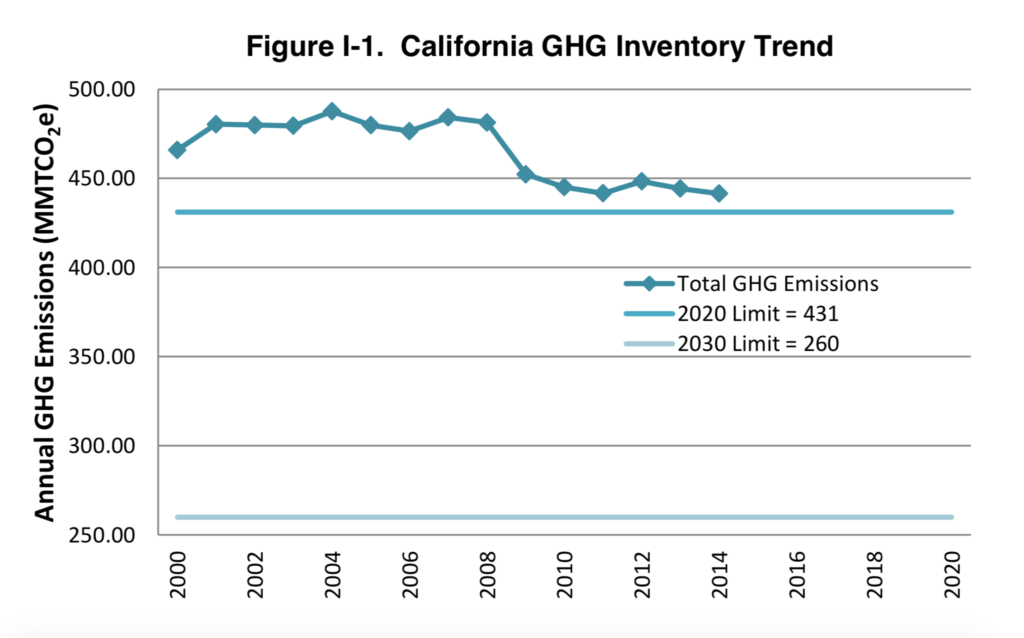
The California Air Resources Board keeps track of the state’s greenhouse gas emissions. This chart from CARB’s 2017 Scoping Plan shows emissions from 2000 to 2014.

To illustrate how this works in practice, let’s imagine you run a natural gas power plant and you produce 100 tons of CO2-equivalent in a year (in reality, this figure would be much higher). Knowing that you emit 100 tons, the California Air Resources Board would issue you 100 carbon credits. You’d get most of them for free, but a few would need to be purchased on the market, either from the state or from other polluters. The idea is that you would save money by taking steps to reduce your emissions rather than purchasing credits, and then if you use fewer than what you’re given for free, you can sell the rest and make a profit. The total number of credits given by the state decreases every year to encourage emissions reductions.

California’s cap-and-trade system began on Jan. 1, 2013, with large power plants and industrial facilities. It was expanded to fuel distributors in 2015, meaning that cap-and-trade now affects about 85 percent of greenhouse gas emissions in the state. Some major companies in the state, like electric utility Pacific Gas and Electric, which serves nearly two-thirds of California’s geographic area, have said they support the program as the best way to address climate change.

In the United States, California has the most extensive cap-and-trade system, which affects all companies emitting more than 25,000 tons of CO2-equivalent in a year. By 2018, its market will be linked to both the Quebec and Ontario emissions markets (more on this later). There’s also a regional cap-and-trade system for electric utilities in New England, and there have been others in the past, such as one created in the 1990s to reduce acid rain-causing emissions. But no nationwide emissions trading system exists today in the U.S. The last big effort to create one, the Waxman–Markey bill in 2009, passed in the House but fell through in the Senate after facing opposition from senators from coal-reliant states.

So far, emissions auctions in California have raised nearly $5 billion for the state, according to the state Legislative Analyst’s Office. State law requires this money to be spent on projects that further reduce greenhouse gas emissions. More than $1.3 billion has been spent on the state’s high-speed rail project, and nearly $700 million each has been spent on low carbon vehicle incentives and affordable housing programs.

Critics of cap-and-trade policy say it’s burdensome for businesses and have pointed to high-profile companies like Toyota moving their operations out of California. But USC environmental economist Kate Svyatets said the state has been successful in balancing competing interests: economic freedom and environmental protection.

“A lot of businesses, instead of being overburdened, they make money,” Svyatets said. “It’s possible to have both a cleaner environment and economic growth, and California shows how to achieve it.”

For most economists, cap-and-trade is the “preferred solution” for regulating greenhouse gas emissions, UCLA researcher Ann E. Carlson wrote in the Harvard Journal on Legislation. Other methods of emissions control, like a carbon tax or mitigation rules, require direct government enforcement and are not as economically efficient as a market system can be — they impose a price on carbon on the state rather than letting one emerge through economic activity.

“It’s hard for the government to decide exactly how many carbon credits to allow,” Svyatets said. “The carbon experts say it’s not expensive enough yet. It’s still better than nothing, but it’s not expensive enough for some companies to switch to clean technology.”

But though California’s cap-and-trade system is designed to create price incentives to reduce emissions, it has not been very instrumental in doing so. The emissions cap each year has been higher than actual emissions in the state, meaning that the emissions trading system does not have the chance to seriously affect how polluters behave. Prices on the emissions market also fell precipitously in 2016 as a court case made the program’s future uncertain. They’ve since rebounded but remain near the state-mandated price floor.

When emission credits don’t cost enough, it becomes cheaper for firms to pollute than to invest in methods that would reduce their emissions in the long term. The European Union is an example of this. It started its cap-and-trade system in 2005, but the European Commission allowed too many credits in the market. Prices fell to ineffective levels by 2008, and companies were profiting off the EU’s mistake by selling the extra credits.

As in California, the prices have since stabilized. At the time of writing, the allowance to emit a ton of greenhouse gases costs roughly $7 in the EU, compared to $13 on California’s market. The 2017 price floor in California is $13.57.
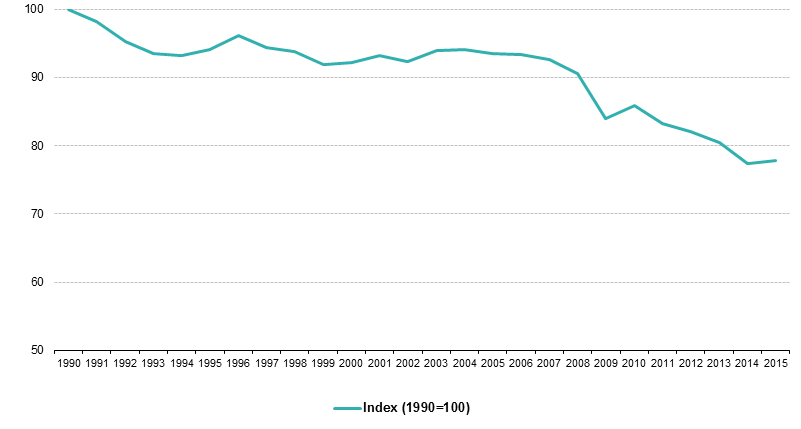
This chart from the European Commission of the European Union shows how the EU’s greenhouse gas emissions have changed since 1990. The data are shown as an index, with 100 being the 1990 level.

Carlson said that when emissions trading systems don’t work, “policymakers may need to enact complementary policies to address those market failures.” California has supplemental requirements like the Renewable Portfolio Standard, which requires an increasing portion of electricity sold in the state to come from renewable and emissions-free sources, and the Low Carbon Fuel Standard, which requires gasoline and diesel fuels to be less “carbon-intensive.”

These policies are perhaps the greatest limit to cap-and-trade’s effectiveness. The complementary policies are responsible for about 80 percent of emissions reductions, with cap-and-trade in place to “sweep up remaining cuts,” according to MIT researchers’ interviews with California officials.

All three policies were created together in what the researchers have called an “insurance” policy to “create a mechanism that could make up emission reduction efforts that were lost if any of the major complementary policies were to fail.” In a way, this means that cap-and-trade in California is intended to be largely a backup plan in case the state’s other policies are not enough. This limits the role that the market has and therefore the incentive for polluters to reduce emissions in the most cost-effective way.

One common issue in many markets is a lack of competition or the monopolization of resources, but despite some speculative activities in emissions trading, anti-competitive behavior hasn’t been a problem in large markets like the European Union or California. German researchers found that those kinds of issues only arise in small trading pools, such as the RECLAIM market for nitrous oxide and sulfur oxide emissions in Southern California.

“Firms within the same industry do not want to sell allowances to buyers with whom they [otherwise] compete,” the researchers wrote. But in large cap-and-trade systems with diverse stakeholders, this has not been a problem.

To make emissions trading systems even more competitive, governments have sought to link their markets with others, allowing credits to be sold across them. More buyers and sellers of emissions means more competition and less room for market abuse.

“If you have a very small market, what if nobody wants to buy your allowances? Just imagine you want to sell a used car or your cell phone or something,” Svyatets said. “If it’s just you and I in this market and nobody else, what if I don’t want your cell phone? What if I don’t want your car?”

But linkages introduce a problem seen in other cases of cross-jurisdictional common markets, like the European Union. When the Greek debt crisis struck that country in 2008, leaders at the European Central Bank found their hands tied when it came to monetary policy to relieve the nation’s ensuing recession. According to UCLA researcher Juliet Howland, linked emissions trading systems could face a similar problem in which one government “may not be able to regulate the price of carbon credits in order to prevent serious damage to [its] economy.” The MIT researchers found through their interviews that California’s system was intended to be flexible for linkages with other western states (which later abandoned their cap-and-trade ambitions), but were concerned that it could be hurt by linkages to weaker cap-and-trade markets.

Linked emissions systems don’t even have to be geographically close — California’s market is linked to the province of Quebec and soon to Ontario, while the European Union has started the process of linking its system to Australia’s. The thought is that in tackling a global problem, it doesn’t matter where greenhouse gas emission reductions happen as long as they happen somewhere.

But California has taken steps to ensure local benefits for its cap-and-trade program. Twenty-five percent of funds are automatically earmarked for high-speed rail, plus 20 percent go to affordable housing and 10 percent to transit systems. All revenues from the sales of emission credits on auction go toward programs that the state says promote public health, and by law, one-quarter of revenues must benefit “the state’s most disadvantaged and burdened communities.”

Those communities, it turns out, are some of the most affected by climate change.

California’s cap-and-trade system aims to reverse course on greenhouse gas emissions to help protect all communities from the harmful effects of global climate change. But despite its large potential impact, the program in practice is only secondary to the state’s more heavy-handed regulations.
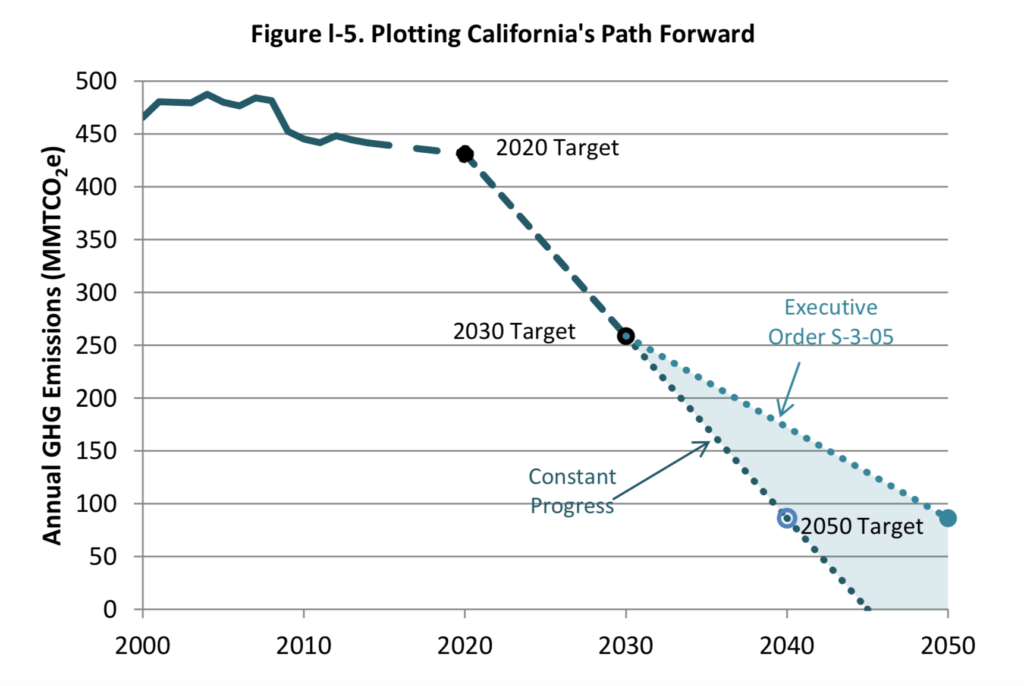
This chart from the California Air Resources Board’s 2017 Scoping Plan shows that potential statewide greenhouse gas emissions reductions under the continuation of planned policies would exceed those required under the governor’s executive orders.

That could change. The California Legislative Analyst’s Office found in 2017 that the state was on track to meet its 2020 emissions goal, but the 2030 target is much more ambitious and will require much more severe greenhouse gas reductions.

The cap-and-trade program will likely become more essential over time as the cap becomes increasingly tighter, but this will increase the burden on polluters too and potentially increase costs for consumers. The analysts estimated that some policies needed to reach the 2030 target could cost $300 per ton of carbon dioxide equivalent — or more than 20 times the current price for one allowance on the cap-and-trade market.

Who will be hit hardest by the cost of these reductions remains to be seen, and the impact on the economy is unclear. The analysts said long-term carbon prices depend on factors that are “highly uncertain,” and the state Department of Finance does not provide economic growth projections past 2020.

For now, the California Air Resources Board is working on a plan to reach its 2030 emissions goals. What comes out of those meetings will determine the future of California’s climate policy.

Is The U.S. Avocado Industry In The Pits?

The newest administration has drawn significant attention to cons of Mexican-American trade, claiming that Mexico is overall hurting rather than helping America’s economy. One drastic impact that our southern neighbor definitely has is on the U.S.’s avocado industry.

The fruit itself has its roots in Mexico, so it comes as no surprise that this country has always been the world’s top producer. Although avocados are endemic to Mexico, the Fuerte variety found new popularity in America in the late 1800s. After the Hass variety, developed by Rudolph Hass at his farm in La Habra, CA in the 1920s, eventually became more favored for its taste and texture, subsequently gaining more notoriety after a marketing push in the 1950s. This was the beginning of the business’s widespread success and marked the start of its major growth.

As this new industry began to grow in the U.S., growers were protected from competition due to a quarantine set in place by the USDA in 1914 to prevent the introduction of seed weevils, stem borers, and other malicious pests that threaten the health of this crop. However, in 1997, this was amended to allow for 19 states to accept Mexican avocado imports from pest-free zones in order to comply with new trade regulations enacted by the North American Free Trade Agreement. Furthermore, in 2001, the Mexican Government won its plea to expand this number to 31 states as well as lengthen the shipping season, and in 2007, all states were allowed to import this produce.

These events significantly increased the amount of direct competition the American avocado industry faces. Though the growing seasons align, Mexico has the advantage of cheaper labor and water costs and is therefore able to offer a better price to consumers. As such, these imported fruits have dominated the American market; currently, 93% of Hass avocados in the U.S. come from Mexico, according to the Hass Avocado Board.

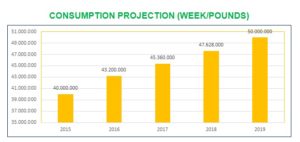
However, the past few years have provided hope for U.S. growers. First, the demand for avocados has risen exponentially. In 1985, Americans only consumed an average of 4 million pounds of avocados per week, but as of 2014, that number rose to a record-breaking 37+ million. The Fresh Fruit Portal projects this to rise to over 50 million by 2019.

Moreover, trade sanctions proposed by President Trump severely threaten the Mexican produce industry at large, as these tariffs, allegedly 20% or higher, will make it nearly impossible for trade to keep up in this $1.62 billion industry.

Sad news for avo toast and guacamole lovers, though: prices of the fruit will likely skyrocket if this trade restriction goes into effect. The high tax combined with the current and projected demand for avocados ultimately means a loss for consumers.

Other sources: California Grown; University of California Cooperative Extension Subtropical Fruit Crops Research & Education; Civil Eats; Statista

Rash Economic Indication

According to Advertising Age, the sales of diaper-rash cream may indicate the state of the economy. The logic behind the claim is that when the economy is down and parents are trying to spend less money, their budgets decrease and therefore they aim to spend less money on even basic supplies for their families. This mentality causes them to change their children less often in order to conserve diapers and spend less on this costly necessity, increasing the likelihood of babies’ sensitive skin becoming irritated by the wet material. 

As of 2011, diaper cream sales had been on the rise for several years, showing about 2.8% growth, despite the population of infants ages 2 and under in the U.S. falling about 3% in the same time period. Further, data SymphonyIRI data from Deutsche Bank suggests that since 2009, diaper rash cream sales have gone up despite a definitive decline in the sales of diapers themselves.

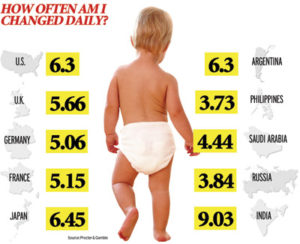
But does the cost of such a basic item really have an impact on families’ overall expenditures? Actually, yes, as the average American parent is expected to clean up their babies’ bums an average of 6.3 times daily, which adds up to an estimated $1500 per year.

[Source]

So, during a time of economic recession and high unemployment, it’s easy to imagine that parents may wait just a few hours longer to change their children in an effort to conserve their supply and spend less. Therefore, as obscure as it may seem, sales of diaper cream can be viewed as an economic indicator.

Other sources: CNN

Grameen Bank: Empowering Women through Microfinance in Bangladesh

Microfinance was born in the early 1980s when an economist named Muhammad Yunus came across women in poverty from the villages of Bangladesh. In face of the widespread famine and poverty, some of these women and their families were controlled by the loan sharks, and had no other resource to turn to because traditional banks considered them not creditworthy. Muhammad Yunus repaid the women’s debt and helped them get loans from the bank as a guarantor. Soon, working with the poor made him realize that lending money to the disadvantaged is a great business opportunity for that they were trustworthy, hardworking people. He then created Grameen Bank, what we consider a pioneering model of social enterprise, to help the poor break the cycle of poverty.

Why has the Grameen Bank succeeded in reaching the poor, while traditional banks have not? The most prominent reason is that borrowers do not need collateral to get a loan. This policy allows access for the disadvantaged to get loans more easily to support their small businesses and livelihood. These loans are typically made in very small amounts, averaging at $200 with an interest rate below 20%, hence the “micro” in Microfinance. Grameen Bank is also different from traditional banks in that it has a financially self-reliant model. Yunus explained his bank’s business model in an article published in The Round Table: Grameen has funded 90 percent of its loans with interest income and deposits collected, aligning the interests of its new borrowers and depositor-shareholders since 1995. Essentially, the bank encourages all borrowers to become savers, so that their local capital can be converted into new loans to others.

The most fascinating fact about Grameen Bank’s operation, however, is that 97% of the borrowers are women. It is a brilliant business strategy because women statistically have a much higher loan repayment rate than male. Yunus have recognized this, and made women his target client partially for this reason. In an interview with The Guardian, Yunus said that he expanded the program into the US and established 19 branches in 11 cities, including eight in New York. “We have nearly 100,000 borrowers there now and 100% women. Not a single man.” However, giving microloans to women isn’t just good for business, it accomplishes so much more.

In rural Bangladesh, most women are essentially confined to their husband’s family compound, and are in a rather powerless position both socially and economically. Girls are usually married by 16, sometimes as young as 11. Most of the times, there are no medical professionals in attendance when women give birth to children in these areas. Women are expected to keep their eyes down and their voice soft, even at home. It is not considered proper for women to go to the market, or to be seen by men outside their family.


Microfinance serves these women, who are often overlooked in society, and empowers them one small loan at a time. This access to a small amount of capital made it possible for women to buy seeds, chickens or a cow and start and grow their small businesses. Often this allows them to earn enough to provide three meals a day instead of two for their family and their children, of whom 40% are malnourished. It also gave them a bit of cash to pay for medicines if a family member got sick.

Here’s the story of Manjira who, years before, was living in extreme poverty in Bangladesh. She had lost a young son to a sudden illness. She told the reporter at New York Times that her most painful memory was the day before her son died. He asked her for an ice cream that cost one taka (about 2 cents), but she didn’t have the money to give him that. A few years later, she managed to get a small loan through Grameen, and had become a successful seamstress. Now, she is one of the board members of Grameen Bank, along with 3 government representatives and 8 other village women elected by the bank’s more than 8 million members.

Like Manjira, many women in Bangladesh have found means to provide for themselves and their family with the help of microloans. The impact of Microfinance, however, goes far beyond providing women with business opportunities. More importantly, it help increase access to education for the next generation.

Statistically, children living in poverty have a higher chance of missing, dropping out, or not enrolled in schools. This is because the majority of families who live in poverty work in agriculture. The families need the children to be working and productive so their financial needs can be met. Microloans can help ease the financial pressure of these families, which means more opportunities for children to stay in school. This is especially important for families with girls. When girls receive just 8 years of a formal education, they are four times less likely to become married young. This makes these girls more likely to achieve higher level of education and then become a more productive member of the society.

Yunus claimed that part of the reason why he focused on serving female customers is that he wanted to protest the traditional banks that refused to lend money to women. As more and more of these women succeed in building their businesses, Bangladesh and many other developing countries reached by Microfinance firms are now forced to a new look at women’s role in the society. A recent study done by RMIT University has shown that Microfinance has effectively reduced gender inequality in developing countries. The study measured gender inequality using Gender Development-related Index and Gender Inequality Index. These are UN indicators that calculate gender inequality based on measures of differences in factors like health, education, and economic status, as well as living condition and empowerment. The researchers found that in the average developing nation, an increase in Microfinance by around 15% is associated with a decline in gender inequality by about 50%.

Some critics of Microfinance claim that many become overwhelmed by their debt. However, it is important to distinguish the different types of Microfinance organizations. Some institutions in Bangladesh like BRAC have models similar to Grameen and provide services with the goal to combat poverty. Unfortunately, there are also some profit-oriented organizations that use predatory lending and collection practices. Some of these institutions charge up to 200% for interest, and their harsh collection methods had driven some borrowers to commit suicide. This type of Microfinance lenders does their business on the client’s doorstep, meaning that representatives are encouraged to travel to rural villages to make the loans and then come back weekly to collect the payments. Yunus himself is outraged by this kind of Microfinance companies that make profits of the backs of the very poor. Sadly, the Bengali government offer few regulations in this type of predatory business.

Some academics, including Dean Karlan, insist that the success stories of women who received help from Grameen Bank is overrated, and paint an unrealistic picture of the effectiveness of Microfinance. Karlan conducted randomized controlled trials of Microfinance programs in different developing countries, and in each case they compared a randomly selected group of people who had been offered the loans to an otherwise identical group that had not. Their research suggests that Microfinance does not have much effect on improving the level of income of the loan recipients. However, it is worth noting that in some cases the overall income stay unchanged because borrower decrease their work at a wage-paying job as they start to gain more income from their own business, and the assets they own are not counted toward their income.

Aneel Karnani, a professor of strategy in University of Michigan published an article in Stanford Social Innovation Review, in which he agrees with Karlan and argues that despite its noneconomic benefits, Microfinance does not significantly alleviate poverty. He claims that instead of Microfinance, best way to eradicate poverty is to create jobs and to increase worker productivity. Karnani points out that most Microfinance clients are not “micro-entrepreneurs” by choice, and that these borrowers would “gladly take a factory job at reasonable wages if it were available”. On a macroeconomic scale, most people agree that employment is the fundamental link to poverty reduction. However, the problem that the clients face in these rural areas of Bangladesh is precisely the limited opportunities for steady employment at reasonable wages. Within the status quo, Microfinance is still the best opportunity for people who seek temporary financial relive and are hoping to kick start their small business.

Granted, Yunus’ hopes for Microfinance had always been rather grandiose. Poverty is a complex issue, and Microfinance isn’t a “silver bullet” that can magically solve it. With that said, well-intended Microfinance institutions remain one of the best tools available to developing countries to alleviate poverty. A 2015 report from advocacy organization Microcredit Summit Campaign claims that between 1990 and 2008, Microfinance has lifted 10 million people out of poverty in Bangladesh alone. However, there’s no denying that Microfinance has now become a worldwide movement. By 2013, some 3,098 microfinance institutions had reached over 211 million clients worldwide, just under half of whom were living in extreme poverty.

Clearly, more Microfinance in developing nations is good news for women. There is an immeasurable effect that occurs when women are empowered to do something in their society that they weren’t normally allowed to. As women build up their business, overall consumption increases and its benefits also extend outward to the entire community benefits, including those who are participating in the program. However, it is important to keep in mind that Microfinance does not automatically empower women. Governments and international organizations in developing nations should tighten regulation over Microfinance institutions and be sensitive to the country-specific and cultural factors that play a key role in determining how Microfinance interacts with the local community.


Can Natural Disaster Ever be Good to Economy?

Hurricane, earthquake, and wildfire… America and the world have been entangled by natural disasters recently. The natural disasters indeed never could be a positive thing because of its destruction and death tolls; however, the disasters also tend to make reconstruction the primary task for the government, which would face little obstacle to pour money into the affected regions. Thus, setting humanity aside, natural disasters in some situations could be a boost to the regional economics.

Sichuan in China, where a magnitude 8 earthquake stoke in 2008, is an example that the local economy benefits during the post-disaster reconstruction. The poor infrastructure led the Sichuan earthquake in China to end with 87,150 people death toll and 4,800,000 people homeless, according to the BBC News. With $191 billion economic loss, the Sichuan Earthquake was the second highest in terms of economic losses. The fortunate part was that the center counties in 2008 Sichuan earthquake, Wenchuan and Ya’an, were neither a raw material production base nor manufacturing zone; actually, these counties were poor. Thus, the earthquake did not hurt much the Chinese exports and GDP.

(from BBC)

The rebuilding efforts costs the Chinese government almost $150 billion,equivalent to a fifth of its entire tax revenues for a single year, according to the Guardian.The rebuilding plan will “envisages building 169 hospitals and 4,432 primary and middle schools to replace collapsed structures.” “Another 2,600 schools that remained standing will be strengthened.Under the plan, more than 3 million homeless rural families will get new houses and 860,000 apartments in the city will be built.”

It is brutal but true to say this immense earthquake served as a stimulus to Sichuan’s local economy. “When something is destroyed you don’t necessarily rebuild the same thing that you had,” said Mark Skidmore, an economics professor at Michigan State University. “You might use updated technology, you might do things more efficiently.”

As poor and small counties in China, WenChuan and Ya’an have minimal chance to receive this much of national investments and resources.

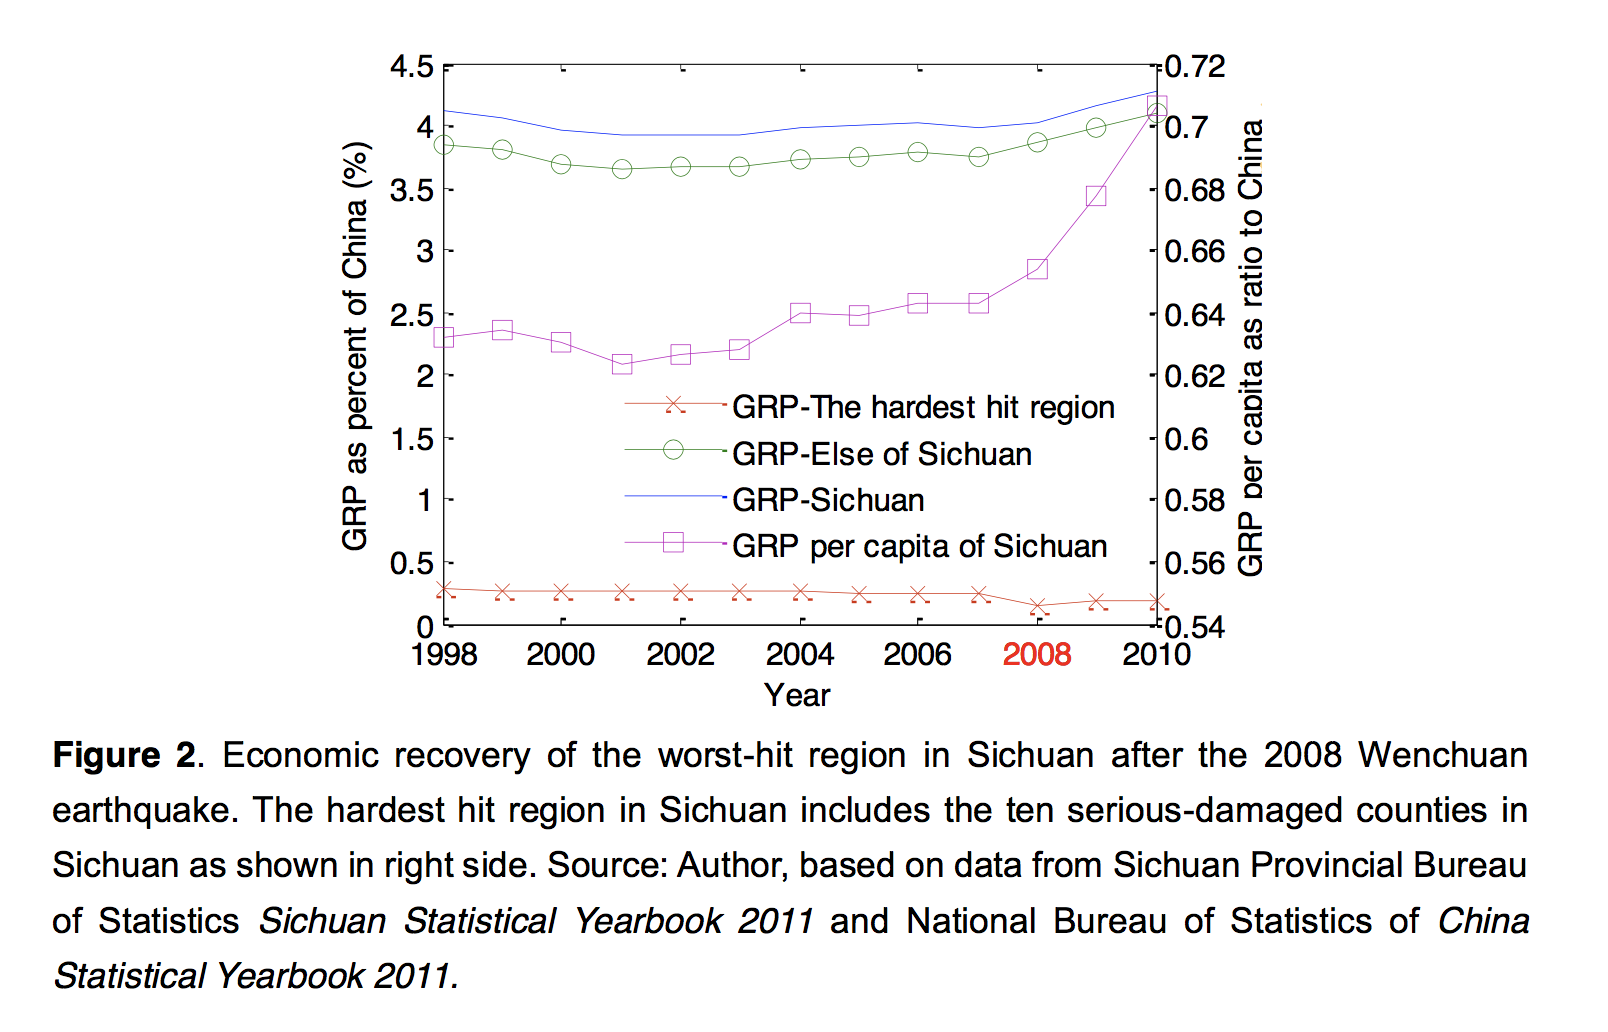
“The GRP level (as a percentage of Chinese GDP) of the worst-hit area of Sichuan decreased by 35.4% in 2008 compared to the 2007 level. After three years of reconstruction, the region had still not returned to its pre-earthquake GRP level, but the GRP level of the rest of Sichuan experienced a boom in those three years because of the reconstruction demand stimulus,” According to a studies conducted by MOE Key Laboratory of Environmental Change and Natural Disaster of the Beijing Normal University.


It is understandable for the chart above that depicts the economic recovery of the worst-hit region in Sichuan and else of Sichuan. The hardest hit region suffered the destruction and the labor shortage the most. Even with such tremendous amount of resources and capital, the quake center regions hardly could reach effective capacity and productivity. The else of Sichuan are in a much better situation that these recovery investment creates job opportunity and industrial production.

More practical reflection of the benefits from 2008 earthquake to Sichuan region comes from the 7.0 magnitude Sichuan earthquake in Ya’an. According to the BBC report, “none of the buildings built since the Sichuan earthquakes collapsed.” The quality of housing for sure has improved.

The claim that natural disaster would boost regional economy is not new, but it has remained a small field of study because critics charge “disaster economists with oversimplifying enormously complex economic systems and seeing illusory effects that stem only from the crudeness of the available economic measuring tools.”

In 1969, Douglas Dacy and Howard Kunreuther, two young analysts at the Institute for Defense Analyses, published a book called “The Economics of Natural Disasters.”  It was probably one of the first attempts to measure the economic influence of catastrophe. The book argues that the dreadful Alaska earthquake of 1964 helped Alaska economy by garnering government loans and grants for rebuilding.

“We got a lot of hate mail for that finding,” said Kunreuther, now a professor of business and public policy at the Wharton School of the University of Pennsylvania.

Gus Faucher’s study also supported the Dacy’s and Kunreuther’s claim. Fauncher is the director of macroeconomics at Moody’s Economy.com. He found sharp increases in construction employment after Hurricane Andrew attacked Florida in 1992 and after the Northridge earthquake of 1994.

The Bernard L. Schwartz Chair in Economic Policy Development Martin Neil Baily said whether the economy of affected regions can be benefited depends on “the way the country or region responds to the crisis”. The time factor is the most important here. He gave an example that Haiti, where is too poor to manage the immediate recover after hurricane, has to wait international aid to get basic rebuilding, leaving alone economic growth.

The Hurricane Katrina was a debatable case. Faucher accuses government aid was slow to arrive and with insurance payouts so low, there were so many residents left New Orlean. The economic recovery and boost both did not come.

However, there are also many critics to the theory of disaster economic growth. It is important to remember that the wealth to the affected regions is not generated by the hurricane or earthquake, “the money and labor that go into postdisaster rebuilding are simply being redirected from other productive uses.”The natural disaster could be an economic boost to a region, but it always is an economic downturn for the whole nation. Moreover, some jobs are benefited at the cost of other industries.

“If you’re a carpenter, a trash remover, a physician, you may be made better off,” said Donald Boudreaux, an economics professor at George Mason University. “But the things that those producers would have otherwise produced are not going to be produced.”

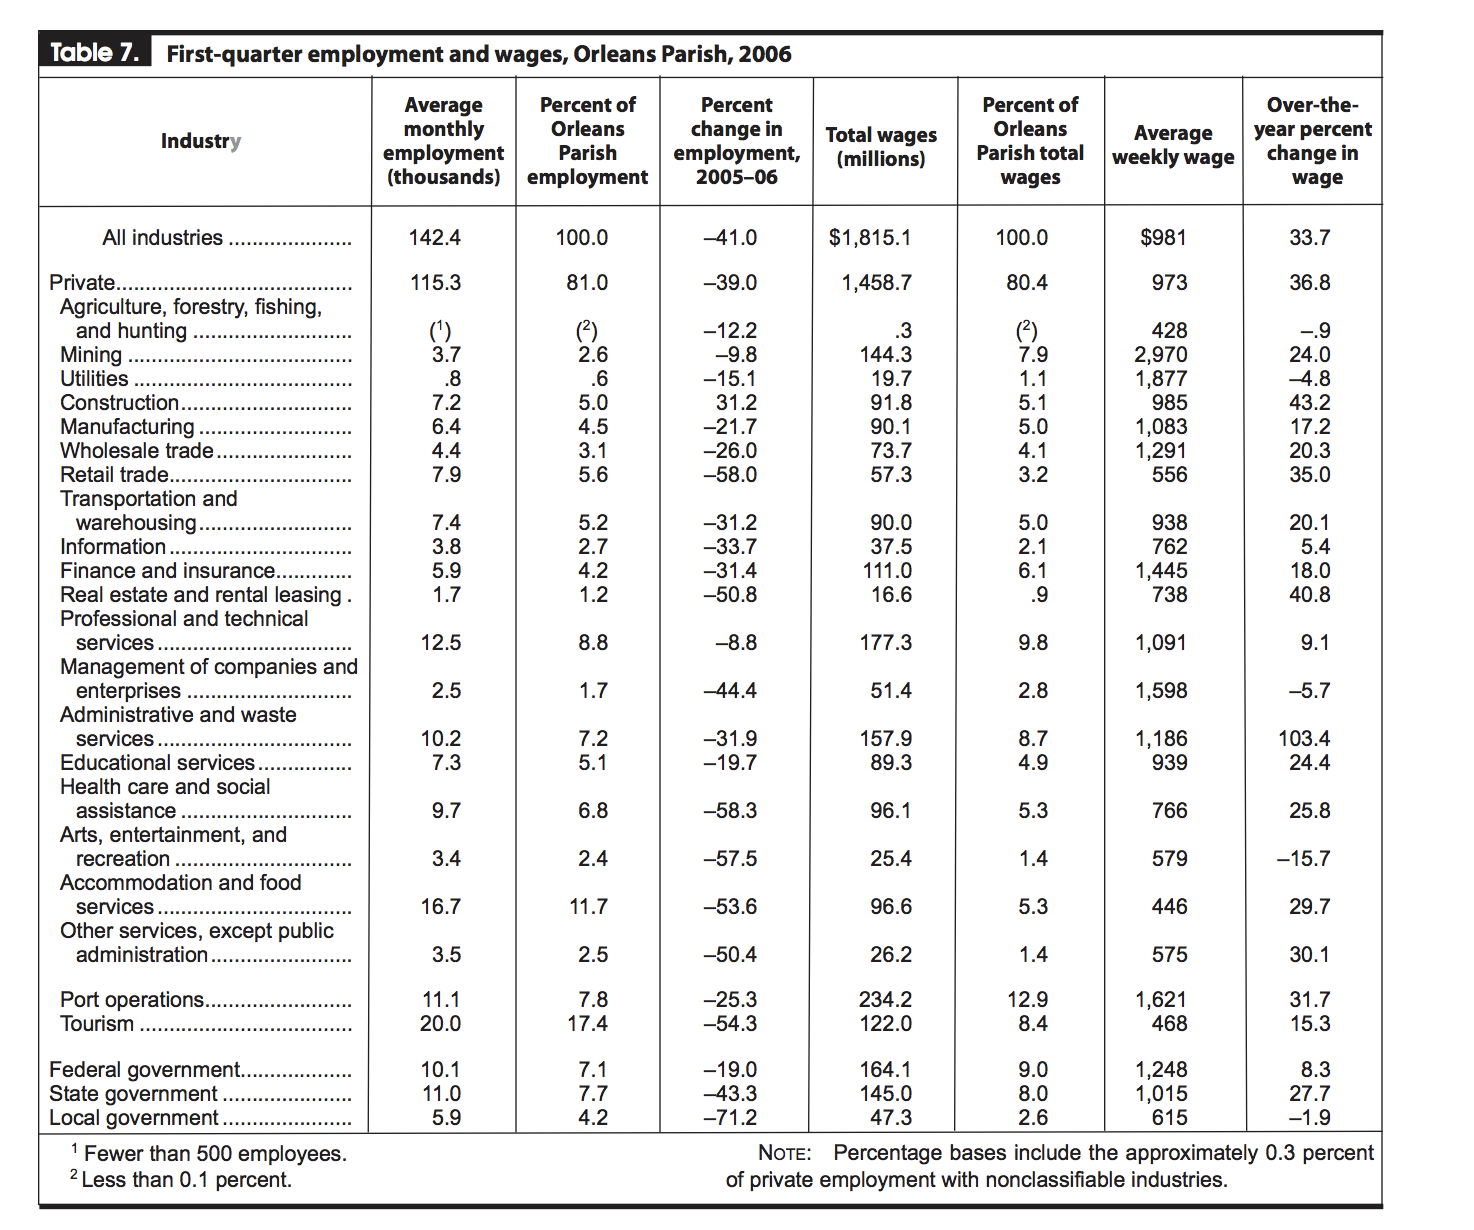
Here is the chart of the wage and employment growth for New Orleans during the immediate recovery time after the Hurricane Katrina.

It is clear that construction, waster service, and real estate enjoyed a huge economic boost, while entertainment and food service suffered.

“Over any reasonably relevant period of time, society is not made wealthier by destroying resources,” Boudreaux said. If it were, “Beirut should be one of the wealthiest places in the world.”

The theory model of disastrous benefits for economy should be viewed as that the areas that would not receive national resources or investment during the normal time becomes privileged after suffering catastrophe. It also gives these areas more opportunity and capital to develop during the reconstruction. The catastrophe wiped out the outdated facilities and infrastructure and replace them with more efficient and modern ones. “It might be seen as Mother Nature’s contribution to what the Austrian-born U.S. economist Joseph Schumpeter famously called capitalism’s ‘creative destruction.'”

As long as the government responds to the disaster quickly with reconstruction capitals, it is general to see a quick recovery for the affected area and a bullish future for the local economy.

Once again, it is inhuman and cruel to say the natural disaster is a good thing, and it is significant to remember it hurts national economy as a whole. However, it could be an opportunity for the specifically affected regions to develop and reform its economy.

How Oil Prices Impact Different Sectors

There are few things that have a bigger influence in global markets than swings in oil prices. However, the ripple effects these swings have are hardly ever clear cut. In order to understand how swings in oil prices can influence global markets, we must first understand how these prices can increase or decrease.

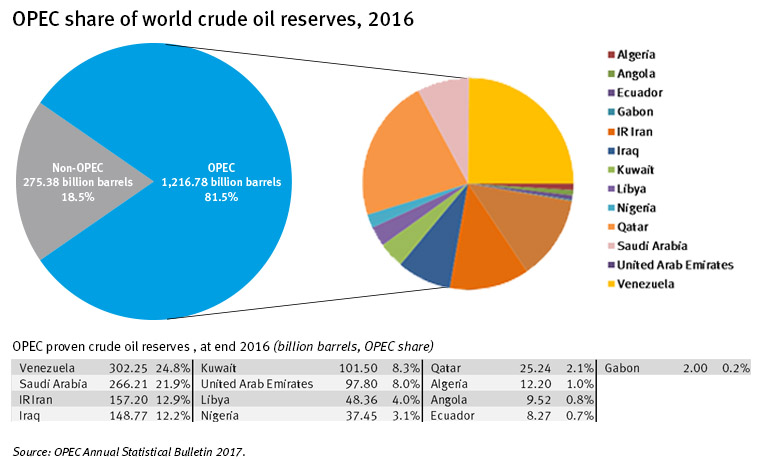
Oil is a commodity that tends to fluctuate throughout time. One of the largest influencers of these fluctuations is the Organization of Petroleum Exporting (OPEC). The OPEC is an organization that includes 13 countries; Algeria, Angola, Ecuador, Indonesia, Iran, Iraq, Kuwait, Libya, Nigeria, Qatar, Saudi Arabia, the United Arab Emirates and Venezuela. According to their website, as of 2016, “81.5% of the world’s proven crude oil reserves are located in OPEC Member Countries, with the bulk of OPEC oil reserves in the Middle East, amounting to 65.5% of the OPEC total” (http://www.opec.org/opec_web/en/data_graphs/330.htm). They have production levels that meet global demand, and are able to control prices by increasing or decreasing production.

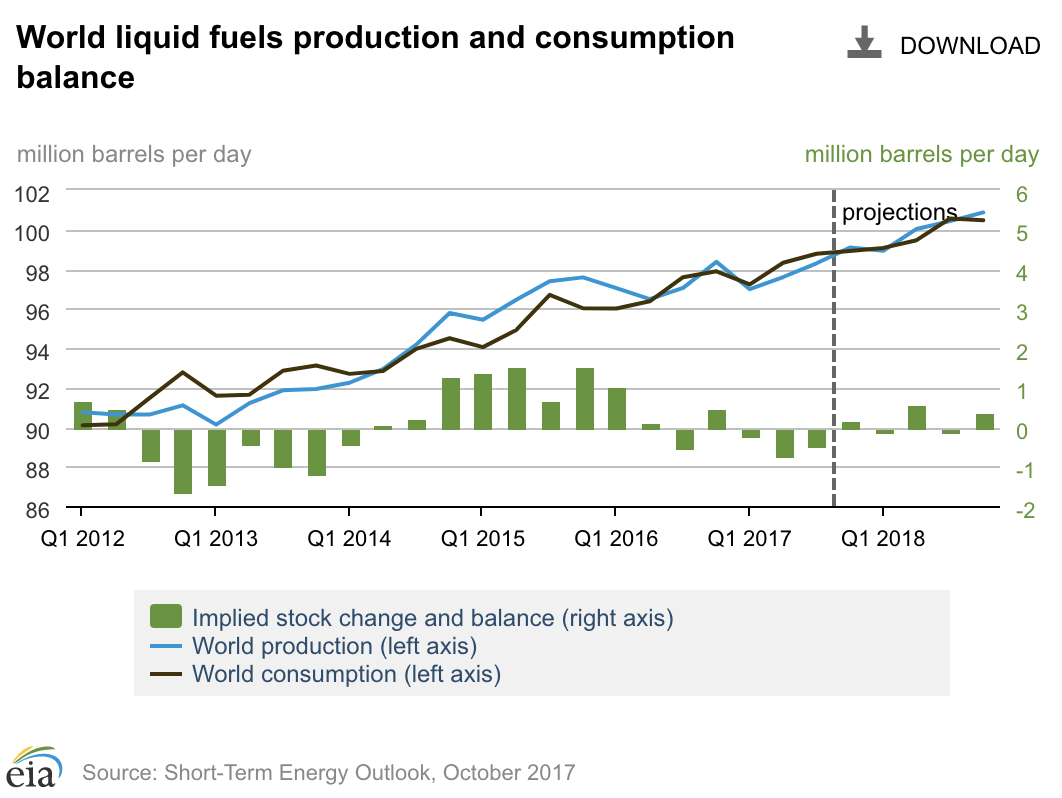
Just like the stock market, the laws of supply and demand play a crucial role for commodities as well. If supply of oil were to pass demand, the price of the oil must decrease, and if demand were to pass supply, prices will increase. For example, if there is lower demand for oil in Europe and China, but there is continuous supply of oil from the OPEC, the price of oil will fall due to the surplus of oil supply. Although supply and demand do affect oil prices, the future of oil and reserves are what actually sets the price. Future contracts allow purchasers of oil to buy at a fixed price in the future on a specific date. Other influencers of oil prices include natural disasters, such as hurricanes or earthquakes, production costs, and political instability.

Although weaker demand is what can drive prices lower, the growth rate in China, which is the world’s largest net importer of oil, has caused significant changes to the price of oil. This is due to the slowdown of growth in China. Also, the OPEC has promised to reduce its production of oil, which can drive up the demand. However, with competitors entering the market, the OPEC has kept its production levels up to compete in the market and hold market share.

For many industries in the market, oil prices are really important to pay attention to. Fluctuations in prices can have a large influence on different sectors of the economy. One of the main sectors that is highly influenced by oil prices is the airline industry.

Every traveler can agree that the cost to fly from one place to another has become a crucial factor in making the decision to travel. Like most industries, the airline industry is constantly itching to find new streams of revenue. Airfare fees used to cut it, but now surcharges have been placed on almost every bit of customer service offered by the airline company. This includes seat selection, checked bags, meals, and sometimes carry-on bags, and they are not cheap. These surcharges first began as something to depend on when fuel prices increased, as well as increasing ticket costs.

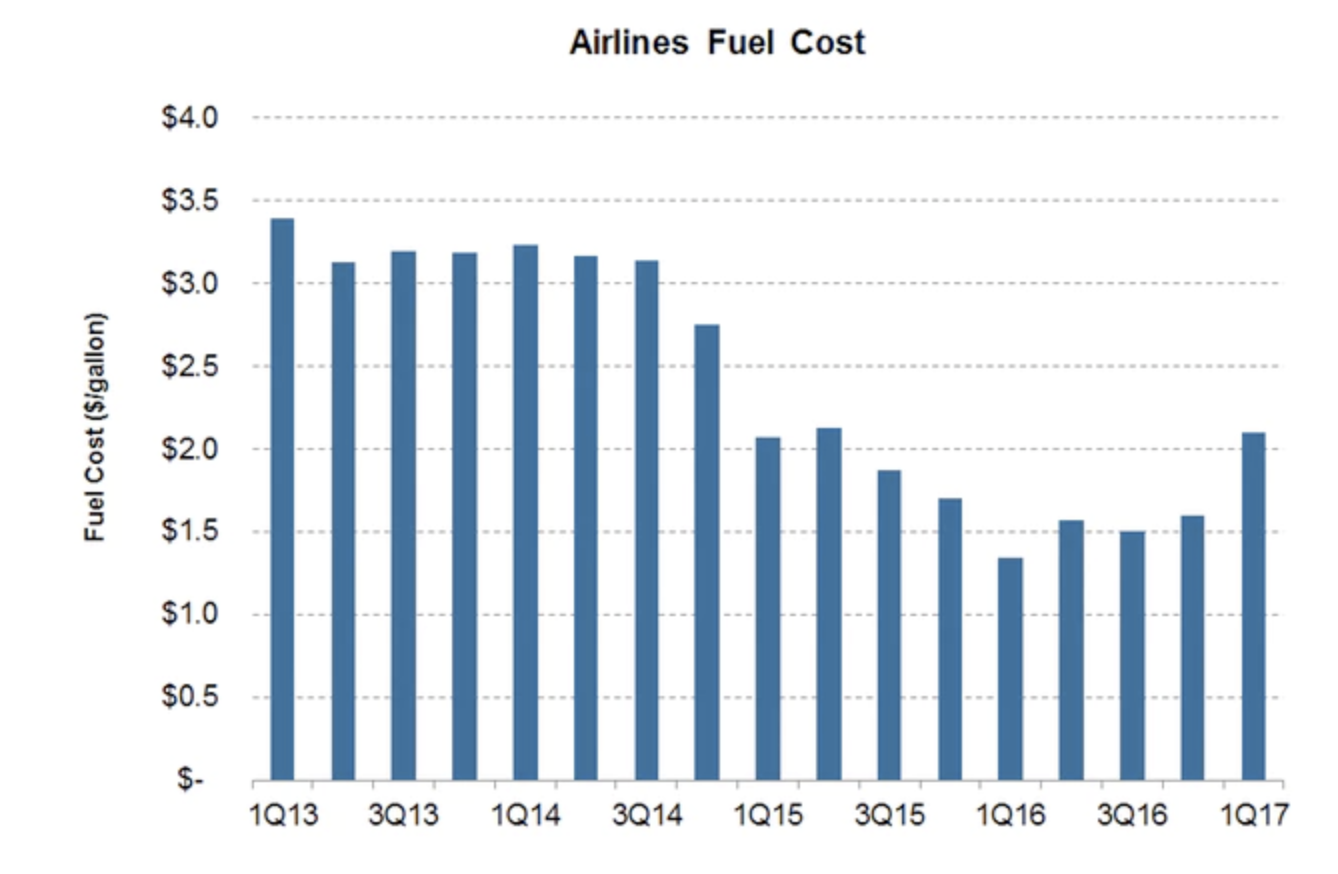
Overall, crude oil prices have significantly dropped as a result of a surplus of supply. For the airline industry, a decrease of oil prices is great news. This means that they will have lower costs on fuel, which is one of their major costs, and will potentially lead to an increase in profits. The decrease in oil prices have caused airline companies to restructure their fleets, buy back stocks to show better earnings, and also look into expanding their routes in areas that seemed less feasible. This has also benefited travelers, due to the decrease in airfare costs.

Crude prices had recovered in the first quarter of 2017. This resulted in most airline fuel costs to rise. According to Ally Schmidt, “Delta Air Lines’ fuel costs rose 26.4% YoY to $1.6 billion. American Airlines’ fuel cost rose 37.8% YoY to $1.7 billion, and United Continental’s fuel costs rose 28.1% YoY to $1.6 billion. Alaska Air’s fuel cost rose 103% YoY to $339 million, including the impact of its Virgin America merger. Southwest’s fuel cost rose 13.6% to $959 million. JetBlue’s fuel cost rose 50% to $323 million. Spirit Airlines’ fuel expense rose 62.2% YoY to $139 million” (http://marketrealist.com/2017/08/analyzing-crude-oils-impact-on-airlines-fuel-costs/).

With the news of the OPEC and a few other non-OPEC nations slowing oil production rates until March of 2018, the oil prices rose to about $51.50 per barrel (http://marketrealist.com/2017/06/how-crude-oil-prices-impact-airlines-fuel-costs/). However, the impact of Hurricane Harvey had caused oil prices to fall to $47 per barrel. The capacity Texas has of oil is about 5.6 million barrels per day, and Louisiana has about 3.3 million barrels per day. The loss faced by both of these states resulted in a decrease in crude prices.

We know an increase in crude oil prices negatively impacts the industry’s largest cost. However, a decrease in crude oil prices can also cause problems to the airline industry. Lowering the oil costs can enhance profits, but also lowers airfares. This increases demand for traveling, which forces airline companies to find ways to increase capacity. Adding too many routes or dramatically increasing their fleet can cause airline companies to hurt their potential profits when oil prices bounce back. Therefore, it is very important for them to make every move a smart one. Major airline companies have recently done a good job of finding the right balance between adding capacity and still keeping demand steady.

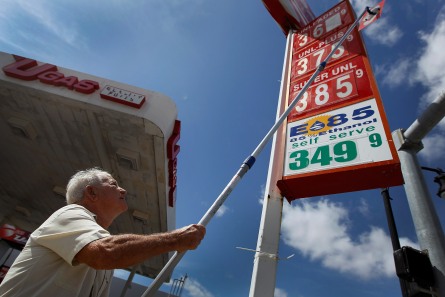
Another industry that is impacted by the fluctuations of oil prices is the auto industry. Automobiles and petroleum are considered to be complimentary goods, which are goods that are associated with one another. Gasoline is a petroleum-based product; therefore, price fluctuations in crude oil can directly impact the price. A fall in oil prices is great for automotive companies. This means that vehicle sales will rise, as gas prices are cheaper, and more people have leftover income to spend. The extra income that people have could be used to lease or purchase a new car. As the cost to drive becomes cheaper overall, car ownership becomes more attractive to the population.

However, the impact oil prices have on the auto industry does depend on the market and the nation. For example, people who live in high fuel-tax areas may experience an overall lower percent change in the price. Therefore, it will not appear as significant as it will to someone who lives in a lower fuel-tax area. This can change the perspective one has towards purchasing a vehicle during a time where oil prices have decreased.

Some argue that the constant volatility of oil prices causes uncertainty about if and when the oil prices will increase again in the future. Therefore, this can impact the decision-making process of an individual wanting to finance or purchase a car. This perspective suggests that the future expectations of oil prices are what reflect car sales, rather than the actual price. However, most industry experts are directly correlating an increase in sales with the recent low gas prices.

The increase of automobile sales due to lower gas prices has had a larger impact on the gas-guzzling vehicles than the fuel-efficient ones. These vehicles tend to be more expensive in general, allowing automobile companies to generate more revenue. Also, profit margins on smaller vehicles are usually less than the larger vehicles, and gas-guzzling vehicles are generally on the larger side, including trucks and SUVs.

Fluctuations in oil prices can affect many companies in different sectors. Low prices can benefit industries that rely on oil as a key input, but other industries may hurt. Upstream oil producers are the ones that take the largest hit when their costs to produce the oil passes the market price, and they have to operate at a loss. However, downstream companies can hurt as well. These include industrial producers and other companies that build drilling operations, as they support the energy sector. Also, investors that hold bonds from oil producing firms also take a hit. As mentioned, this is also true for the exact opposite; an increase in oil prices. High oil prices can significantly hurt industries, such as the airline and auto industry. However, upstream oil producers and industrial companies that support the energy sector can benefit from an increase in oil prices.

It is difficult to accurately predict what the future holds for oil prices. The U.S. Energy Information Administration predicts that crude oil prices will average $52 per barrel in 2018. The reports show that volatility will not be as bad as it was in 2016. Commodity traders are able to predict the price of oil due to their future contracts. Their predictions state that price could be anywhere from $39 per barrel to $63 per barrel by December of 2017 (https://www.eia.gov/outlooks/steo/report/global_oil.cfm). It is important to remember that any perceived shortages, such as a hurricane, can cause these traders to panic and prices to increase. However, prices tend to moderate in the long run, while heavily impacting industries in the short run.


Sources:

https://www.eia.gov/outlooks/steo/report/global_oil.cfm

http://www.opec.org/opec_web/en/data_graphs/330.htm

http://marketrealist.com/2017/08/analyzing-crude-oils-impact-on-airlines-fuel-costs/

http://marketrealist.com/2017/06/how-crude-oil-prices-impact-airlines-fuel-costs/

“Struck Oil!” Oil Prices Are on the Rise, But How Long will the Sunup Last?

Oil markets are positioned for yet another wild ride; with academic and Wall Street analysts predicting price increases of anywhere ranging from $40 to $70 per barrel by the end of the year, oil is looking far more handsome to investors. Over the last two and a half years, the industry experienced its deepest downturn since the 1990s. As the old saying goes, “history always repeats itself.” When using the past as a guide, after every oil bust comes a significant recovery, if not a market boom. With external factors like increased electronic car production and the Organization of the Petroleum Exporting Countries, known as OPEC, fast at work, one question remains: just how long will this upswing last?

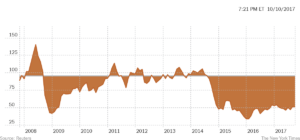
According to macrotrends, as of October 10th, the price of West Texas Intermediate (WTI) crude oil was $49.17 per barrel. “It looks as though the market started to get convinced that the rebalancing is actually happening,” Tamas Varga, an analyst at PVM Oil Associates Ltd. Said in a note during late September of this year.

Even after oil prices recovered from below $30 per barrel in early 2016 to $50 per barrel by the end of that year, The New York Times reported that Executives believe it will be many years before oil returns to a comfortable and prosperous $90 or $100 per barrel, which was essentially the norm for the industry until the price greatly collapsed in late 2014. However, analysts still remain hopeful that oil prices will sit above $60 per barrel by the end of this year.

Following a drumbeat of bullish data in September, which included the International Energy Agency’s upward revision to its demand outlook, crude oil prices were lifted, returning the U.S. to bull-market territory. The Wall Street Journal reported that this serves as the sixth bull market for the crude industry in four years and the first since February of this year.

Investors have gained new confidence that OPEC will continue to cut production and its efforts will help to bring oil’s supply and demand into balance, thus increasing prices. Other factors, like Iraqi Kurdistan’s independence referendum, have played an influential role in boosting prices. After Turkish President, Recep Tayyip Erogan, made a camouflaged threat to close the pipeline which allows for Kurdish oil to reach the global market, crude prices perked up in response.  Political and economic upheaval in major oil-producing countries like Venezuela could cause a major price spike as well.

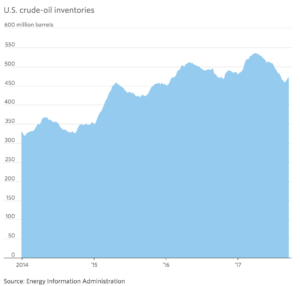
In the wake of Hurricane Harvey, U.S. oil rebounded as U.S. refineries came back online. Due to the storm’s immense power and widespread devastation, U.S. oil supply became more limited, causing an increase in the prices per barrel.

Global demand for oil has also been strong in recent months. In early September of this year, the International Energy Agency (IEA) raised its prediction for demand growth throughout 2017 and expects an increase of at least 1.6 million barrels each day. Additionally, Forbes reported that the “Energy Information Administration showed that motor gasoline product supplies rose 0.6 percent on a year on year basis.” With the IEA confirming rising growth outside the U.S. and the EIA confirming the rise in U.S. demand for petroleum product, “oil markets will move back into contango, and there is really nothing stopping a move in U.S. crude to $60/barrel.”

Despite outspoken investor confidence in a continued upswing in crude oil prices, some more speculative investors and hedge funds remain bearish when placing bets on U.S. crude oil. Donald Morton, a Senior Vice President on the energy trading desk at the Connecticut-based Investment Bank Herbert J. Sims & Co., told the Wall Street Journal, “The short sellers haven’t capitulated yet. Those bears who are entrenched remain entrenched – they’re not convinced this is over.”

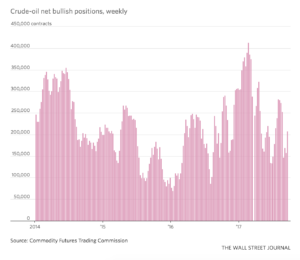
In early 2017, data from the Commodity Futures Trading Commission showed the bullish bets outnumber bearish ones by more than 11 to one, but according to more recent data, that number has shifted to less than three to one.

So, who benefits from this resurgence in oil prices? Oil companies, their employees and shareholders all walk away as winners when oil and gasoline prices rise. U.S. producers are likely to lock in higher prices for future outputs to maximize their profit. Michael Tran, the director of energy strategy at RBC Capital Markets, regarded this producer mentality as something that has previously capped rallies and worked against OPEC’s pricing efforts.

Producing states, including Alaska, Louisiana, North Dakota, Oklahoma and Texas benefit from residual employment and tax revenue increases. The higher crude prices equate to increased activity in the oil fields, which aids local businesses including construction firms that build housing, truck dealerships, and mom-and-pop services companies.

Nigeria, Russia, Saudi Arabia and Venezuela are all major crude oil producing countries that have been pressed financially in recent years.  For the Saudis, higher oil prices hold an additional benefit as its state oil company, Saudi Aramco, becomes more valuable for the initial public offering (IPO) planned to roll out later this year.

Lastly, there is a potential benefit for the environment. With increasing oil and gasoline prices, consumers are encouraged to buy smaller, more fuel-efficient vehicles and limit driving. While this is a good sign for mother nature, consumers of gasoline, heating oil and diesel fuel walk away from the oil pricing increase as losers. Additionally, retail outlets, hotels, and restaurants can take a hit when consumers have less disposable income in response to increased pricing.

With OPEC members producing nearly 40 percent of the global oil supply, the group, when united, serves as a tremendous force in dictating oil prices. In response to their recent efforts, current oil and gasoline prices are more or less in balance, which The New York Times suggests positive economic news for all parties affected by the industry.

As excitement continues to circulate around the direction of oil prices, it seems as though no one has bothered to consider impending potential threats to the crude oil industry.

“It’s going to be huge,” overjoyed oil industry experts exclaimed as Donald J. Trump was elected as the U.S.’ 45th President. Trump is outspoken about his support of industry efforts to build more pipelines, including the Keystone XL, a pipeline that would open up more federal lands and Deepwater prospects for drilling, and successfully deliver Canadian heavy oil to refineries located near the Gulf of Mexico. He has also stated he would like to lower regulatory burdens on the industry, which was made apparent through his lack of sympathy for the international Paris climate accord, which set out to lower global dependence on fossil fuels.

If enacted, all the aforementioned policies would increase natural gas and oil supplies on domestic and international markets, which in theory sounds great, right? Well, this would actually lower gas prices, which would hush the joyous industry expert’s tune.

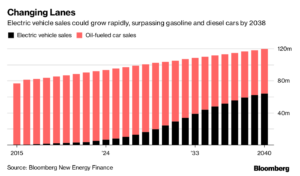
Trump’s presidency isn’t the only threat facing the oil industry. Automakers have been pushing to produce more electronic cars.

10 years ago, Apple Inc. released a surge of innovation (does the name iPhone ring a bell?) that completely capsized the mobile phone industry. With some assistance from ride-hailing services like Uber and Lyft, and new self-driving technology, Bloomberg Technology stated that Electric cars could be on the cusp of pulling the same fast one on “Big Oil.”

David Eyton, the head of technology at the London-based oil giant BP Plc, stated in an interview, “Electric cars on their own may not add up to much, but when you add in car sharing (and) ride pooling, the numbers can get significantly greater.” Fewer people driving cars indicates less demand for oil. If the already diminishing vehicle numbers on the road are replaced by electronic vehicles, the demand for oil will greatly reduce, causing a huge drop in price and supply will likely continue to increase or stay the same.

Tim Harford, the economist behind a BBC radio series and book on historic innovations that disrupted the economy pointed out that instead of electric motors gradually replacing the current norm of internal combustion engines within the model, there’s likely going to be “some degree of systemic change,” adding, “(improvements in technology) are a lot more complicated (than perceived).”

Moral of the story? Yes, crude oil prices are rising at a promising rate; however, one must always remember that all good things do come to an end.


Works Cited

Collins, Jim. “Rising Demand Will Continue To Drive The Rally In Crude Oil Prices.” Forbes, Forbes Magazine, 27 Sept. 2017, www.forbes.com/sites/jimcollins/2017/09/27/rising-demand-will-continue-to-drive-the-rally-in-crude-oil-prices/#2f2a309c2749.

“Commodities: Latest Crude Oil Price & Chart.” NASDAQ.com, www.nasdaq.com/markets/crude-oil.aspx.

Krauss, Clifford. “Oil Prices: What to Make of the Volatility.” The New York Times, The New York Times, 15 May 2017, www.nytimes.com/interactive/2017/business/energy-environment/oil-prices.html?_r=0.

Saefong, Myra P., and Mark DeCambre. “Oil Prices Settle at a More than 1-Week High.” MarketWatch, MarketWatch, 10 Oct. 2017, www.marketwatch.com/story/oil-aims-for-first-2-session-gain-since-late-september-as-saudis-cut-crude-exports-2017-10-10.

Salvaterra, Neanda, and Alison Sider. “Oil Prices Mixed Ahead of Crude Market Data.” The Wall Street Journal, Dow Jones & Company, 9 Oct. 2017, www.wsj.com/articles/oil-prices-yo-yo-ahead-of-crude-market-data-1507546791.

Shankleman, Jess, and Hayley Warren. “How Electric Cars Can Create the Biggest Disruption Since the IPhone.” Bloomberg.com, Bloomberg, 21 Sept. 2017, www.bloomberg.com/news/articles/2017-09-21/how-electric-cars-can-create-the-biggest-disruption-since-iphone?utm_medium=email&utm_source=newsletter&utm_term=170925&utm_campaign=ritholtz.


Germany –– The Land of Productivity.

Germany. Deutschland. The leading country of the Eurozone.

Germany continues to maintain a strong economy. In fact, German workers have paved the way for economic success while utilizing fewer working hours with more productivity.

Seizing Opportunities

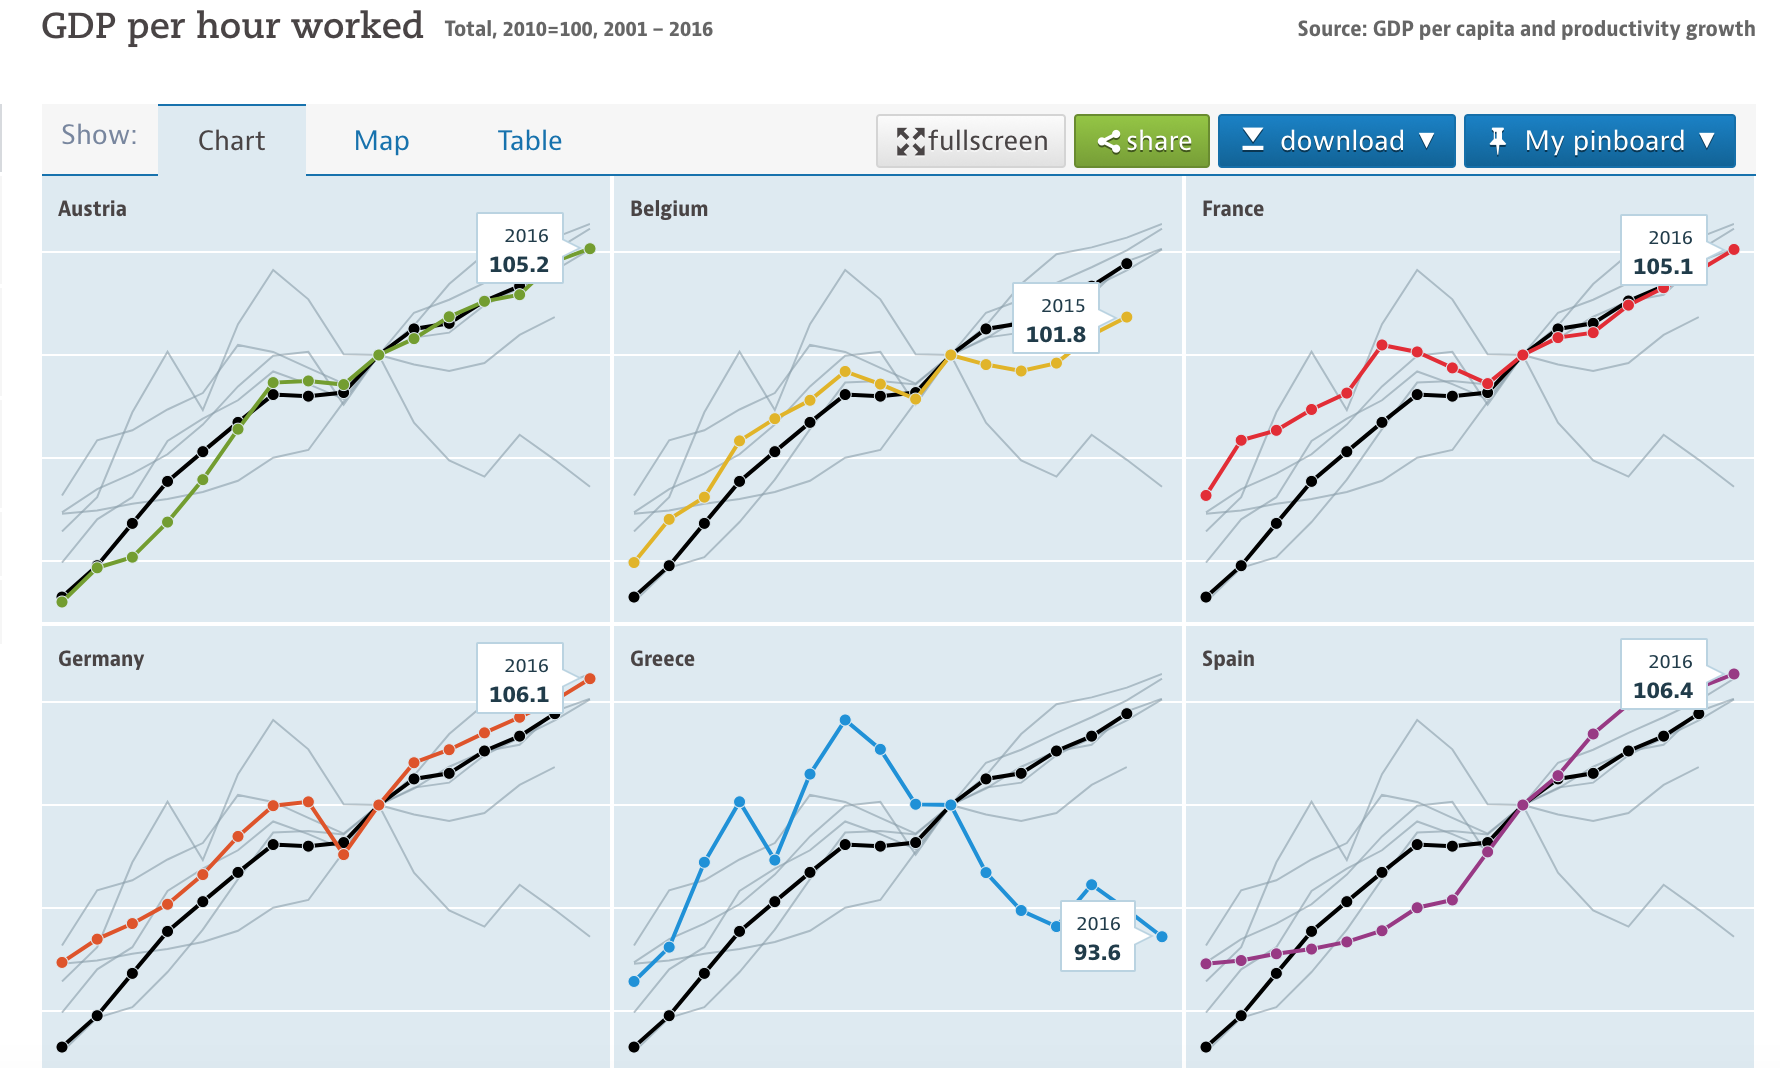
Ironically, the hours worked by Germans are significantly lower than other countries in the EU. Some of the strongest economies have an average of 32-hour work-weeks, whereas Germany, the leading economy of the EU, only has a short 26-hour work-week. The trick to Germany’s success? Productivity. By definition labor productivity is “the amount of goods and services produced by one hour of labor; specifically, labor productivity measures the amount of real gross domestic product (GDP) produced by an hour of labor” (Investopedia). German workers see success in productivity because they are investing in advanced technologies and machineries in order to “seize the opportunities of digitization, remain internationally competitive and drive innovation” (Nienaber, 2017). The graph below highlights the GDP per hour worked for various countries in the EU, ranking Germany with nearly the highest GDP per hour worked.

As seen in the data above, Germany produces more goods per hour than its competing countries and works fewer hours. In order to see growth in that productivity, an economy needs physical capital, new technology, and human capital, which Germany has (Investopedia).

A Strong Work Environment

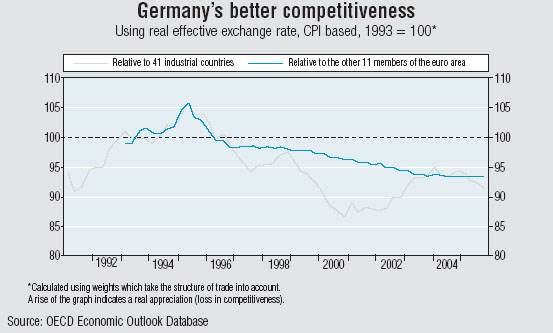
Many different aspects factor into Germany’s economic and productive success. Whether it is that German work culture is very by-the-book –– when you are at work all you do is work — or they have been trained as a population to maintain efficiency, they have found success in business. Essentially, they move quickly but also remain focused. Starting at age 15, German students leave their education to go into apprenticeships. Rather than staying in school and learning, they experience the working world and learn from there. At a young age they are automatically conditioned to be more efficient and productive in the work place. Adding light to Germany’s productivity makers, The World Economic Forum’s 2012-2013 Global Competitiveness Report ranks Germany 5th in higher education and training and 3rd in infrastructure and business sophistication. In fact, as the world’s 2nd largest exporter and one of the most highly advanced manufacturers, Germans would be expected to work off the clock, non-stop. But, that is not the case. Again, this goes to the point of their ability to seize opportunities because of their investment in advanced technologies and choice to constantly innovate. The ‘—‘ mark below indicates Germany’s competitive success relative to 41 other countries and 11 other members of the European Union. This demonstrates that they have remained a strong and leading export country since the fall of the Berlin Wall. So, what made the fall of the Berlin Wall such a strengthening factor in Germany’s economy? Let’s look at a brief history.

A Brief History

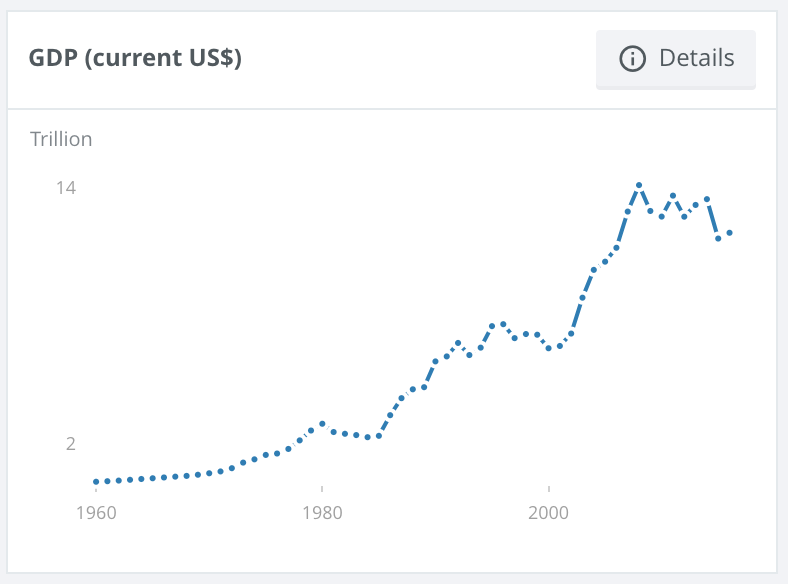
Looking back to the Industrial Revolution of the 1830s, Germans had an innovative and entrepreneurial mindset which led them to be early adopters of coal production and rail transportation (Brenner, 2014). That’s just a mere example of the beginning of their strong economic trajectory. In order to properly look at their success, let’s fast forward to 1989 with the fall of the Berlin Wall. This historical moment finally ended the divide between East Germany and West Germany and brought forth a whole new labor force and marketplace of ideas. Germany acted fast and placed an emphasis on the complex manufacturing of products by which other countries simply could not compete. For example, they have created a thriving auto industry producing the world’s most innovative, luxurious and strongest car brands. Through advanced manufacturing and trade exports, they quickly became a top net exporter to other countries. Not only did this pave the way towards a healthy economic future for Germany, it also made them a key country in the expansion of the EU –– mending the European financial crisis with one currency: the euro. For reference, the graph below represents the significant raise in GDP of the Eurozone after enacting the euro.


Source: data world bank

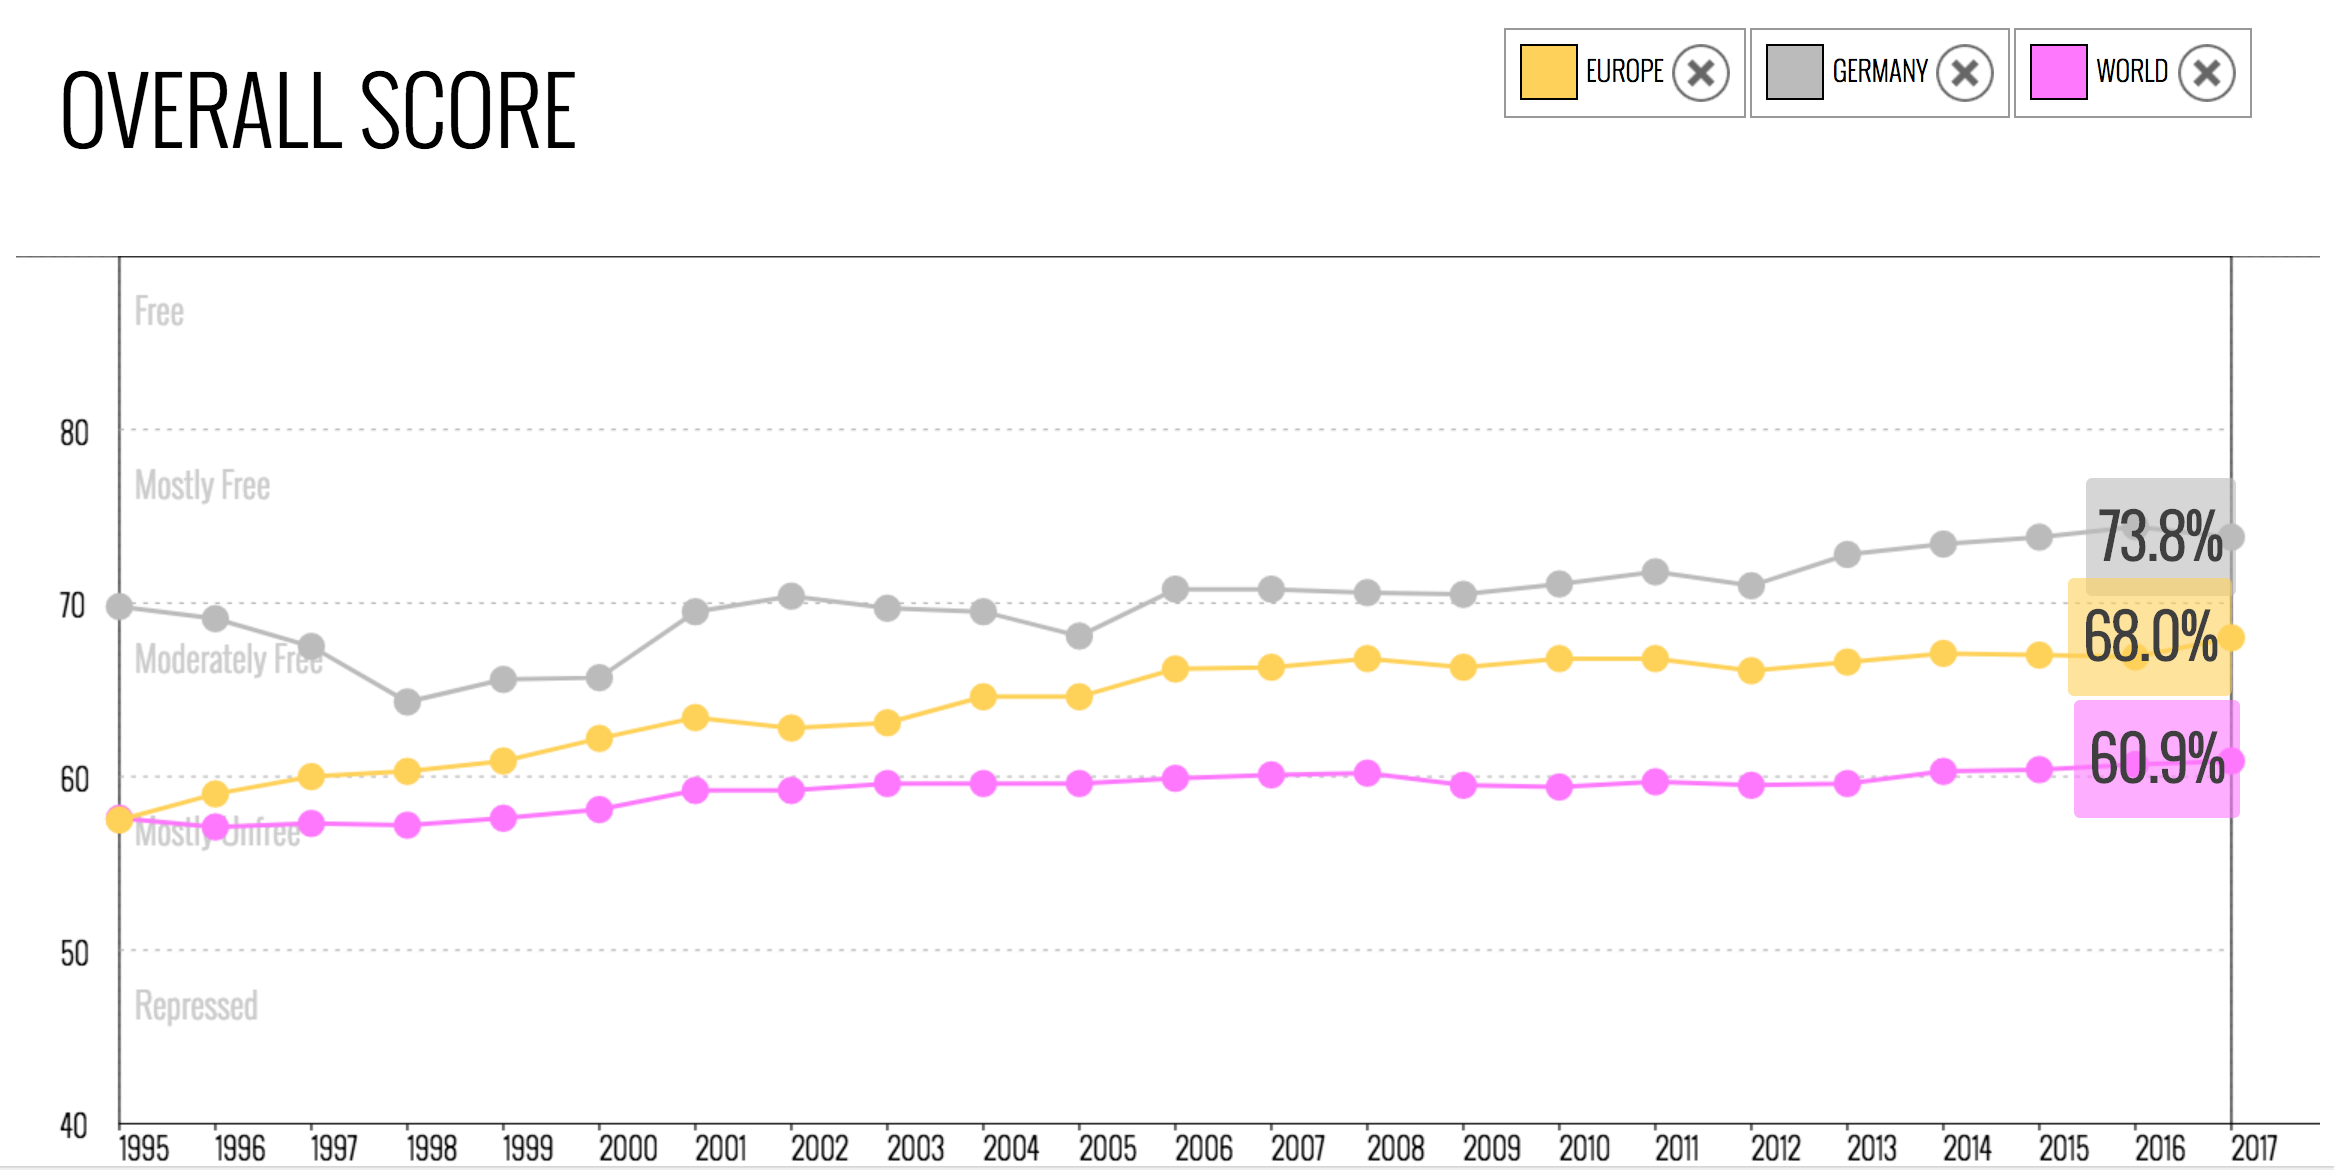
According to current (2017) data from The Heritage Foundation, Germany’s overall economic score is a 73.8 out of 100. A country’s economic score “focuses on four key aspects of the economic environment over which governments typically exercise political control – rule of law, government size, regulatory efficiency, market openness” (Heritage). Within these four measures, there are 12 sub-components that are measured on a scale of 0 to 100 which “are equally weighted and averaged to produce an overall economic freedom score for each economy” (Heritage). Where Germany’s numbers show strength is under fiscal health (government size), business freedom (regulatory efficiency), monetary freedom (regulatory efficiency), trade freedom (open markets), investment freedom (open markets), and property rights (rule of law), as identified in the graphic below. What is so great about Germany is that they continue to show success in business freedom — both on the business side and the investment side. To that end, Germans are willing to start their own businesses, invest in businesses, and overall innovate a business because they have the capital for it.

If you wish to view this further and get directed to the site, click here.

Now that the economic score of Germany is clear, below is a graph of Germany’s score in comparison to both Europe and the world, with Germany ranking higher against each.

If you want to compare other countries and view the graph in real time, click here.

Unparalleled Unemployment Rates

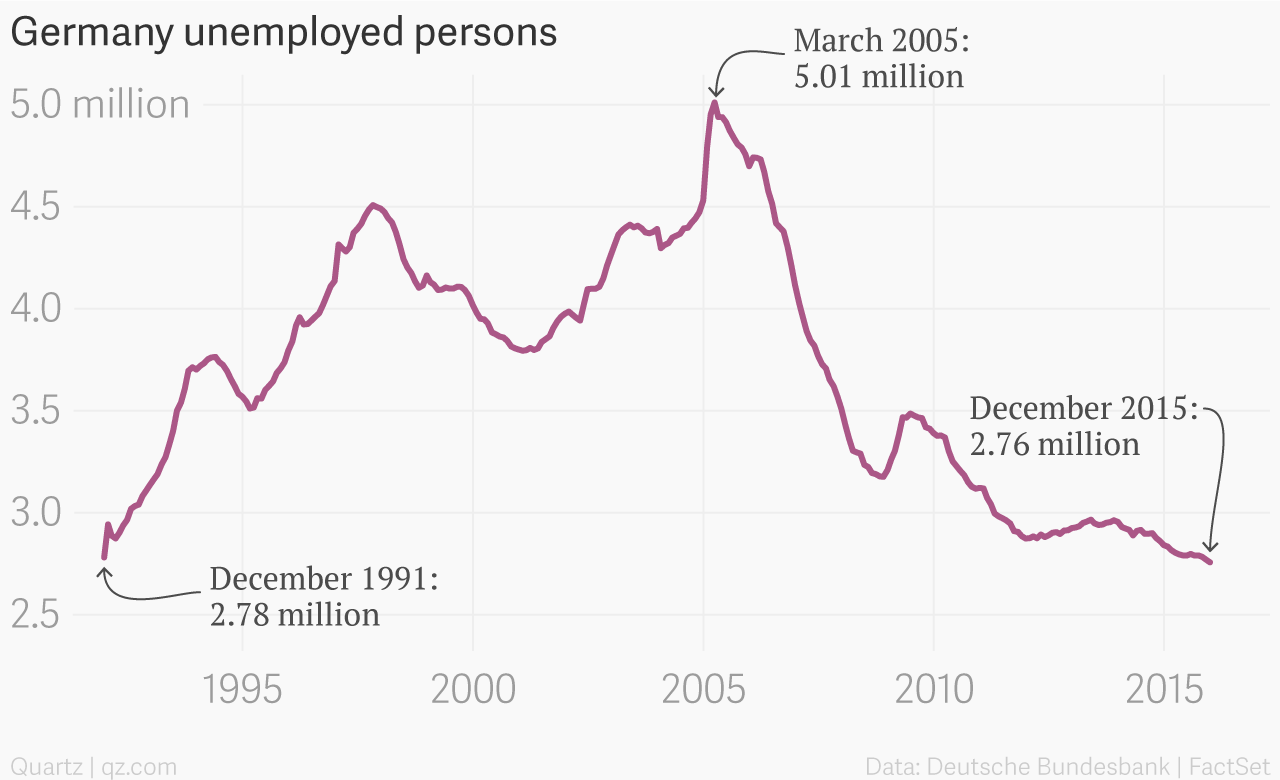
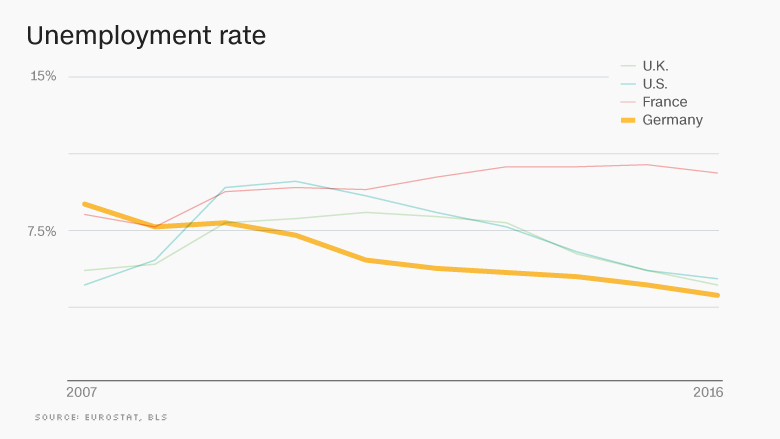
Without high employment rates, productivity would remain low because typically it means there is not as much work to be done. In the simplest terms, Germany has more money to invest in business, therefore they have more money to invest in workers, which leads them to more employees getting the job done. Germany went from a steep 5 million unemployed workers in 2005 to a low 2.7 million unemployed, as shown in graph A titled “Germany unemployed persons.” Graph B, titled “Unemployment rate,” demonstrates Germany’s unemployment rate in regards to the U.S., U.K., and France.

A)

B)c

According to The Guardian, “a strong economic backdrop has helped Germany post a record budget surplus of €23.7bn in 2017, fueled by higher tax revenues, rising employment and low debt costs. It was the highest budget surplus since reunification in 1990 and the third successive year the government has had a budget surplus” (Monaghan and Wearden, 2017). Clearly, the Germans productivity is paying off in more ways than just being a leading exporter. They are truly a financially sound country.

The German Way

Germany finds its way as a leading economy due to the productivity it has retained from its workers, the strength in their manufacturing technology, their education systems, and their overall ability to constantly innovate. German workers are unafraid to pave the way for business freedom. With an abundance of capital to invest toward business success, a strong workforce, and overall economic strength, Germany continues to be a force to be reckoned with. Fewer hours doesn’t always mean less work! Use Germany as that example.

http://money.cnn.com/2017/09/06/news/economy/germany-election-merkel-economy-inequality/index.html

https://www.reuters.com/article/us-germany-economy-gdp/german-economic-growth-picks-up-speed-good-news-for-merkel-idUSKBN1880S6

https://www.expertmarket.co.uk/focus/worlds-most-productive-countries-2017

https://www.theguardian.com/world/blog/2017/feb/23/germanys-gdp-shows-19-rise-over-last-year

https://qz.com/586547/germany-is-the-worlds-strongest-economy/

http://www.cnn.com/2014/10/16/world/europe/germany-25-years-of-success/index.html

http://www.investopedia.com/terms/l/labor-productivity.asp

http://www.investopedia.com/financial-edge/1212/why-germany-is-the-economic-powerhouse-of-the-eurozone.aspx

http://stats.oecd.org/Index.aspx?DatasetCode=ANHRS#

http://www.heritage.org/index/heatmap

http://www.heritage.org/index/country/germany

https://data.worldbank.org/region/euro-area?view=chart


The Economic Side Effects of the Affordable Care Act on the Health of the Nation’s Economy

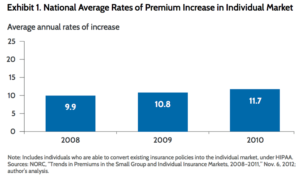
Disrupting America’s existing healthcare system was not going to be easy, but President Obama centered his legacy legislation around the effort. According to the Commonwealth Fund, “The Affordable Care Act (ACA) represents the most fundamental change to the structure of U.S. insurance markets in decades.” The disruption was a long time coming and the need for charge originally stemmed from many problems, but most notably, rising healthcare premiums. Please see the data below from The Commonwealth Fund which exhibits the rise in premiums over just 3 years:

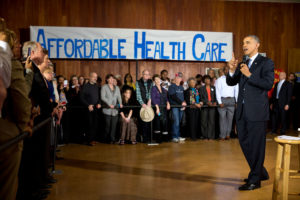
Something needed to change and President Obama saw this market failure as an opportunity for intervention. When introducing the bill, President Obama articulated the reasons why the change was necessary at a speech in Maryland. He stated, “I knew that if we didn’t do something about our unfair and inefficient health care system, it would keep driving up our deficits, it would keep burdening our businesses, it would keep hurting our families, and it would keep holding back economic growth.” Fast forward to 2017. Looking at the healthcare system before the implementation of the Affordable Care Act, and now 7 years later in 2017, there have been notable market effects that are worth looking into.

First, the Affordable Care Act introduced more patients into the healthcare market by expanding insurance to more people. Health Affairs summarized the way The Affordable Care Act expanded health insurance in three ways: “the expansion of Medicaid to cover the poorest segment of the population (those with annual incomes below 138 percent of the federal poverty level), health insurance subsidies on the new exchanges for low- and medium-income people (those with annual incomes of 100–400 percent of poverty) who lack access to employer coverage or Medicaid, and a mandate for the uninsured to buy coverage.” When there are more people in the market, subsequently there is more business for the market. According to an article The New York Times published just one year after the Affordable Care Act became law, it reported that the stock market actually performed quite well for hospitals, drug companies and for-profit health insurers and that “the S&P 500 Health Care Index rose by 24 percent over the last year, outperforming the overall stock market.”

However, with a growing pool of healthcare recipients, greater risk is inevitable. Before the Affordable Care Act, people with pre-existing conditions who did not have access to insurance from the government or their employers, did not have many options for gaining healthcare coverage. Now, those high-risk patients are qualified for insurance coverage under the law and put on an equal playing field with healthy patients. Although more people are getting coverage, the new people being introduced into the pool are mostly poorer, sicker people. The Kaiser Family Foundation looked deeper into how the addition of higher-risk people would fluctuate the existing premiums. “Prohibiting discrimination against people with pre-existing health conditions will tend to raise premiums as higher cost individuals who have previously been excluded from the market buy coverage,” Kaiser concluded but eased worry with the fact that “this may be offset by an influx of younger and healthier people, due to the ACA’s individual mandate and premium subsidies for low- and middle-income people buying insurance in new health insurance marketplaces (also known as exchanges).”

Secondly, not only has more risk entered the market, but new economic restrictions have been placed on the insurance industry. With more people and more insurance companies, competition within the market is heightened. The Supreme Court ruled in 2012 that states had the opportunity to opt of the Affordable Care Act’s Medicaid expansion. As a result, some state governments now have differing policies and rules for the insurance market. According to Kaiser, insurers are being more closely monitored by not only the federal government, but some individual state governments, including a cap on how much those insurers can make from coverage of individuals. Not only are insurers being restricted, but hospitals are as well. The New York Times reports that “hospitals are being hurt by a provision of the law that cuts their Medicare payments by $260 billion over 10 years, but they have benefited from having more insured customers who can pay their bills.”

So it seems the healthcare market has a way of naturally balancing what seem to be significant effects on its existing market, but of course with change, there are always winners and losers. So who is suffering the most for the greater good of all Americans? The answer:  Middle class, healthy Americans who already had health insurance before the Affordable Care Act became law. Yahoo Finance reported people who have already purchased insurance plans, because they could afford it or qualified for the existing coverage, had their coverage cancelled because it did not meet the new requirements by law of the Affordable Care Act. The market once again balanced out according to a study done by Health Affairs, concluding that most of the Americans who had to exchange their plans were probably going to switch anyway and were mostly likely getting a better a deal on their new plan than if they were to purchase it before the Affordable Care Act came into play.

Naturally, there are outliers in this situation. Brenda Laster, a 49-year-old self-employed, single mom of two living in Rogersville, Tennessee is one of the losers in this situation. She claims, “Blue Cross Blue Shield of Tennessee provided me with good coverage and access to good doctors and I didn’t want to switch. Now I am paying more for coverage and I don’t see a difference.” People like Brenda get the short end of the stick with the Affordable Care Act, but it seems as if it is a necessary evil to improve healthcare for all Americans in the future.

Kentucky has some similar cases as well. A spokesperson from the Majority Leader’s Office states that “middle class Kentuckians are hurt the most by the ACA because of the increasing costs. Because the costs keep rising, many of the healthy middle class individuals are leaving the market and paying the penalty instead.” This is bad for the middle class, but so many poor and sick Kentuckians, especially in the Appalachian region, are now getting access to insurance, which as mentioned before, is offset by the inclusion of younger, healthier people into the market. The healthy people are subsidizing the sick and those with pre-existing conditions, which is helping ease more people into the market, providing a way for the government to get involved and address some of the inherent problems President Obama mentioned earlier, without breaking their own bank.

On the opposite side of the spectrum, the sacrifice of some will pay off for our economy as a whole. The New York Times reported “the Department of Health and Human Services estimates that hospitals will save $5.7 billion in so-called uncompensated care costs this year because more people have insurance. And nearly three-quarters of those savings, $4.2 billion, has gone to the 25 states and the District of Columbia that expanded Medicaid at the beginning of 2014.” The temporary pain will be worth the long term gain for the healthcare market as a whole, because improvements have already been made. The New York Times also reported progress back in 2014 stating “the last few years have seen a significant slowdown in the growth of health spending. Across nearly every measure — medical price growthemployer insurance premiumsper capita Medicare spending — the amounts the country spends on health care have increased by much smaller margins than the nation is used to.” However, we have to take the decrease in health spending with a grain of salt. Kaiser conducted a study that found that “because GDP and inflation influence health spending with a significant lag, the effects of economic cycles on the health system are not always apparent from looking at such simple relationships.This study is essentially saying it is possible the Affordable Care Act could not be the only reason for the decrease in health spending and that GDP, inflation and even global economic trends can also play a role in that decrease.

For most middle class Kentuckians and Brenda Lasters of the population, it seems unfair but the pros will outweigh the temporary cons in terms of the Affordable Care Act having a positive economic effect on the healthcare market. The implementation of the Affordable Care Act was always going to attract political controversy because change usually does, but from an economic perspective, the data supports a mostly positive impact on the economy as a whole. After 7 years of the Affordable Care Act being embedded in the economy, alterations to the law would have a significant impact on all Americans. CNN gathered research from the Congressional Budget Office estimating that “repealing Obamacare would increase Medicare spending by $802 billion over 10 years.” President Obama’s legacy legislation had the intent of disrupting the current economic market and disrupt it has. Current debate of removing the law and replacing it will have just as much of an economic impact as introducing the Affordable Care Act in the first place.


Future of Vehicles Looks Electric

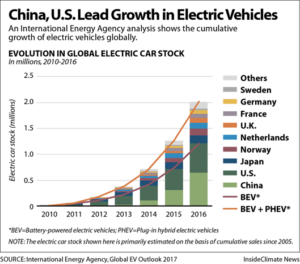
It’s an idea that makes sense for many reasons, mostly notably because it doesn’t toy with our environment quite like gas does. But, as with most change that occurs in this world, the full-on switch to electric vehicles (EVs) continues to take some time.

Many believe that electric vehicles will overtake gas-powered ones in a matter of years. When will this be the case? In order to answer this question, you need to have a basic understanding of what owning and selling an EV requires right now. And this knowledge will give you a solid perspective of the pros and cons of the EV’s existence.

According to PBS.org, Robert Anderson, a Scottish inventor, was the first person recorded to make headway into creating an electric-powered vehicle from 1832-1839. In 1891, a chemist from Iowa named William Morrison built the first electrical automobile in the United States. So the notion of electric vehicles was born far before the emergence of modern technology we’ve come to know.

Early electric car (Source: Inside EVs)

Still, a column from Business Insider noted that about 34 million vehicles were sold over the past two years in the United States, and mostly all of them were fueled by gas. One of the biggest reasons why people see no need to shift from gas-powered to electric cars is due to the time length of charging a battery.

It takes a short matter of minutes to refuel a gas-powered engine, while most electric vehicles need to be powered overnight or take roughly an hour at a commercial station, via The New York Times. This reality contributes to an anxiety that if the car’s battery runs out, and you don’t have a charging station nearby, you can no longer travel.

The way to get rid of that fear is to think of EVs like ChargePoint chief executive Pasquale Romano.

“Electric vehicles are more like horses than gasoline cars,” Romano said, also via that NY Times piece. “You refuel them when you’re doing something else.”

The charging options for your electric vehicle are broken down into two levels. Level 1 charging means that it plugs into a typical house outlet. Using the Nissan Leaf as our primary example, it would take 22 hours for a full charge. But driving 40 miles per day, which is typical of the average American, would allow for around nine hours to completely recharge your battery for the next day, per PlugInAmerican.org.

The fact that electric cars are very functional within shorter distances enables them to be used by modern car-sharing technologies like Uber and Zipcar.

“Electric cars on their own may not add up to much,” David Eyton, head of technology at London-based oil giant BP Plc, said in an interview. “But when you add in car sharing, ride pooling, the numbers can get significantly greater.”

Since for many people time is money, you may want to explore other charging methods if a trip were longer, perhaps around 200 miles. The DC Fast Charger costs up about $100,000 and adds 40 miles per every 10 minutes — a dramatically reduced time from Level 1 charging. CleanTechnica.com notes the the cost of a Level 2 charging station ranges from $500-$1,000 — a manageable price— but is less powerful than the DC Fast Charger.

DC Fast Charger (Source: FleetCarma)

As one could gage, based on the lack of quick chargeable modes, current electric vehicles don’t have the capacity to make long road trips possible. Driving from Los Angeles to the lower edge of Colorado is about an 800-mile journey, and an electric vehicle would make that voyage difficult. This excursion is hard due to, not only the time it takes for charging the battery, but also the amount of charging stations available.

Charging stations aren’t readily available to everyone in the United States, as building this infrastructure is one of the challenges electric vehicle producers face. The U.S. Department of Energy recorded that there are 16,838 electric stations with 44,753 charging outlets in the country.  Looking at the map they provide as to where these stations are located, it’s clear and understandable that the east coast and west coasts of the United States are more densely populated than areas like Montana, the Dakotas, Nebraska, Nevada and Mexico. When these regions are rife with charging centers, you’d expect the demand for EVs would also be higher.

When one looks at how the demand of a good or product can increase, price/cost and quality become key factors in predicting demand. Quality seems to be directly correlated to overall cost. Typically, someone will pay less for a good or service they deem of lesser quality. The same applies for the reverse logic: someone will pay more for a good or service they deem of higher quality.

This idea brings into play the possibility that electric cars will, at some point in time, be considered more logical to buy than gas-driven cars, since EVs will be of similar or better quality than their counterparts and also cost less. A report from the Rocky Mountain Institute specified that there are 15 EV models under $30,000 with multiple models that have batteries lasting up to 200 miles. Cars with internal combustion engines can seem a bit more logical with these current numbers, especially if you’re traveling long distances.

But it’s worthy to say electric cars are on their way to becoming cheaper. A new report from Cowen & Co. details that electric cars will be cheaper than their gas partners by the early- to mid-2020s, due to falling battery prices and costs that traditional car makers will deal with to ensure their vehicles abide by fuel-efficiency standards. President Barack Obama enacted these standards in 2012 to strengthen the pull toward the cleaner energy of electric cars, and at the time, dissenters existed.

“The president tells voters that his regulations will save them thousands of dollars at the pump,” Republican presidential candidate Mitt Romney said in 2012, “but always forgets to mention that the savings will be wiped out by having to pay thousands of dollars more upfront for unproven technology that they may not even want.”

When the cheapness and functionality is clearly accelerating past gas-fueled cars, it will then be up to producers of EVs to make sure supply is on the right level to meet increased demand.

Right now, even though electric vehicles make up for 1 percent of total car sales, the sales of EVs have been growing. Forbes stated that EV sales increased by 36 percent in 2016 from 2015, and have went up at a yearly growth rate of 32 percent over the recent five years.

This rate is primed to grow more and more, as the world becomes more comfortable with phasing out vehicles with internal combustion engines. CNN listed the countries that were planning to completely rid their economies of gas-powered vehicles. France and Britain announced that they would ban sales of gasoline and diesel cars by 2040. India is aiming to get rid of them by 2030. And Norway wants new passenger cars and vans sold in 2025 to all be electric.

China is one of the leading pioneers in the development of vehicles using clean energy. By 2025, states The New York Times, Beijing hopes for one out of every five cars sold to utilize alternative fuel.

The issue facing EV manufacturers in the U.S. now, according to auto sales and information site Edmunds, is that once government subsidies for buyers run out, the market for EVs could crash. This line of thinking is partially based off how Georgia accounted for 17 percent of U.S. EV sales before it dropped to 2 percent after its $5,000 tax credit was eliminated. But states like California, spending $449 million over seven years on doling out these payments, are thinking of spending even more money, $3 billion according to the Los Angeles Times. This move could raise state deductions for EVs from around $2,500 to about $10,000, making a Chevrolet Bolt EV around the same price as a gas-fueled Honda Civic.

The incentives don’t end there, though, as energy company Ovo has devised a way to offset some of the electric cost applied when charging your vehicle at home.

“It provides an economic benefit for electric vehicle owners,” Ovo CEO Stephen Fitzpatrick said. “So they get more use of out of the vehicle that they’ve got parked in the driveway.

When rates for electricity are low during hours of overall less electricity use, the charger by Ovo will fill up the car’s battery. When the rates are higher, the battery would start charging someone’s home or sell the energy back to the grid. One could sell energy back to the grid for up to 25 cents at peak time, while electricity costs about 5 cents a kilowatt-hour during “off-peak” hours.

“In other words, the value of the electricity that’s stored in the battery goes up by a factor of five,” Fitzpatrick said.