Wage Stagnation May Tell Us Why We Sense an Impending Recession

How we feel about the value of our money plays a huge role in the growth of the economy and the wellbeing of our monetary future. Entire sections of the government, like the Federal Reserve, are dedicated to managing that public perception through a two-pronged approach of managing interest rates and informing the press of their opinions to placate public anxiety. People turn to experts like the federal reserve along with metrics such as GDP growth rates and stock values to determine the value of their money both now and in the future. These projections then inform how people will decide to spend their money now or attempt to save, which will lead to a contraction or expansion of the economy. 

While these metrics may seem like a holistic picture, their current numbers fail to rationalize the growing anxiety of an impending recession in the United States. While the economy has steadily been growing since the Great Recession, a Deloitte Global Millennial Survey states that 45% of millennials in the workforce believe that they will never achieve the financial status of their parents.

Where could this anxiety come from? 

Well, let’s look at wages.

Up to 80% of Americans live from paycheck to paycheck.  Because of that, wages are one of the more direct indicators of economic growth and wealth for a majority of the U.S. population. Wages themselves tend to grow with inflation and GDP. This stems from the concept that if more money is put into the economy, that money has the capacity to circulate through exchange. That has not been the case recently, however. 

Since the Great Recession in 2008, average wages have dropped significantly due to unemployment and an increasingly competitive job market for most sectors. In 2008, the sentiment was simply that everyone just wanted job, and so most people were willing to take jobs at lower pay. As the economy began to improve in the subsequent decade, average wages remained virtually the same. If we account for inflation, this means that the average worker was actually being paid less over the course of ten years. This is because the same amount of money must pay for the constantly growing costs of commodities such as housing, food, education, and medicine. This lack of growth is attributed to businesses holding off on increasing wages. Instead, they are apportioning more of its increasing revenues to shareholders.

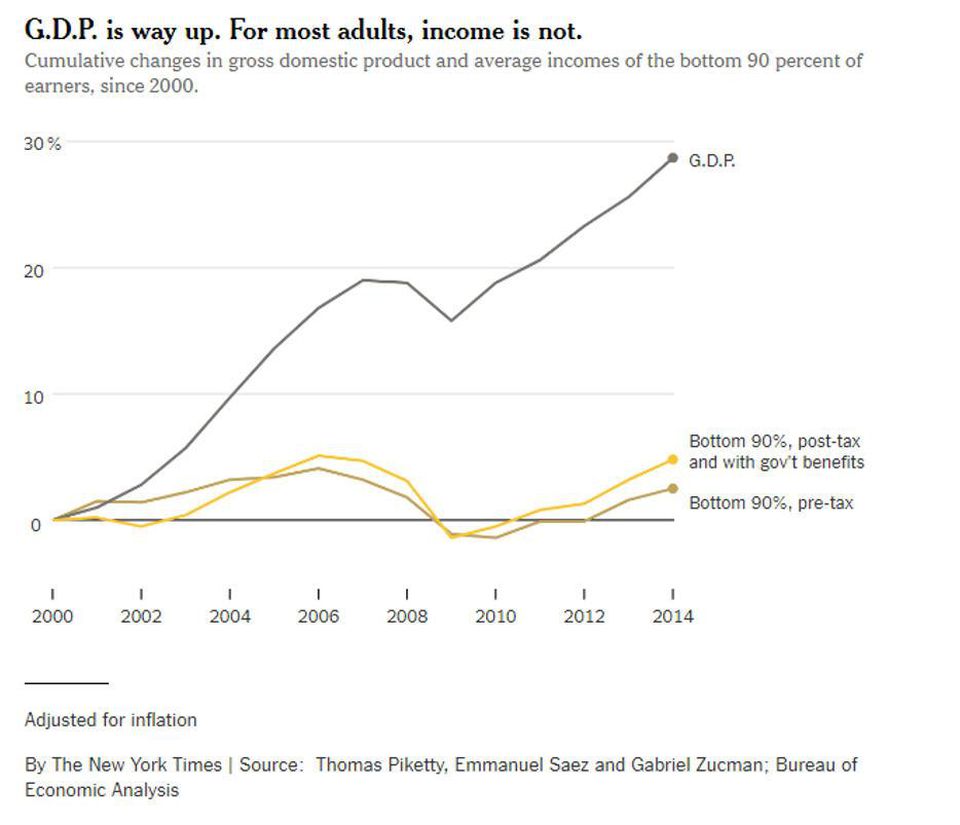
While it may seem like a bad move on the companies, this actually is a common business practice due to the sticky wage theory: wages may be easy to rise, but are increasingly difficult to drop during a recession. However, this theory is becoming impractical for the era. As companies continue to keep wages low, when a recession ultimately does hit, they have no choice but to layoff workers rather than cut costs . These policies instead increase wealth inequality and leave working Americans vulnerable to financial struggle or even disaster.

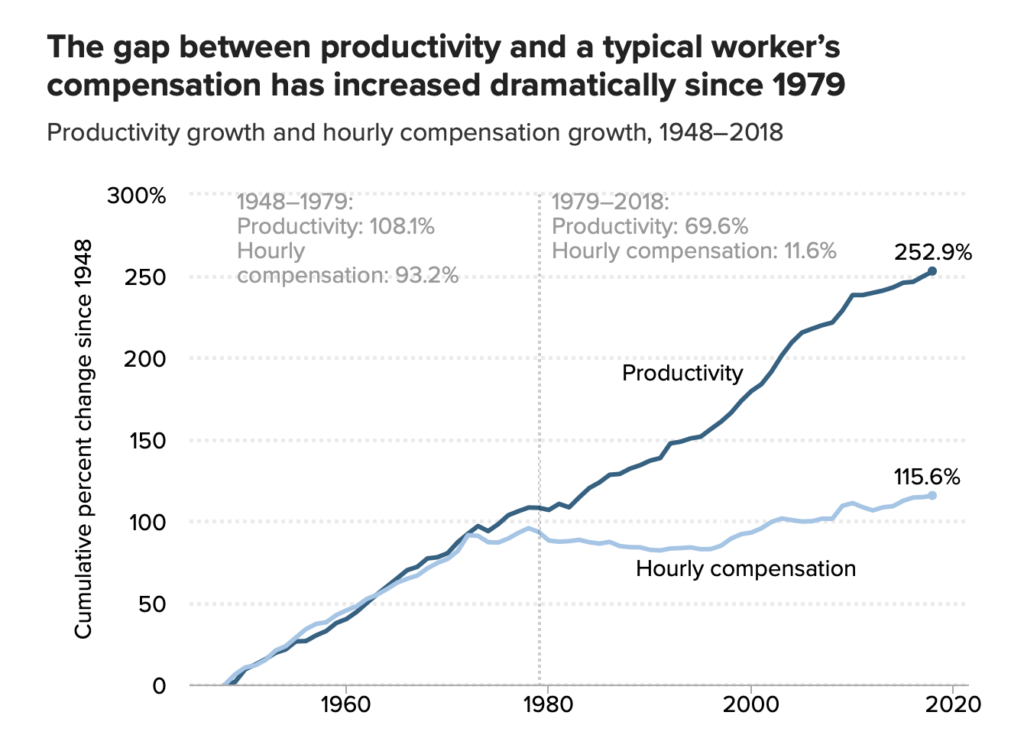
The good news is that wages are beginning to rise. Some economists attribute this to a tightening job market as unemployment rates drop . Others say government policies such as increasing the minimum wage have forced companies to address this stagnation. Still, there is a lot work to be done as productivity continues to increase while wages fail to grow at the same rate . Policies such as the most recent tax cuts to companies have also failed to increase the spread of wealth (Forbes). Thus, many Americans are seeing increasing inflation due to a rising GDP yet consistent or underperforming wage growth, leading them to believe that their lives are getting more expensive but that they will ultimately be unable to afford it.

TikTok: The Beginning of China’s Digital Influence

Source: Wired

Although China has found major success in global hardware markets, they have yet left any major footprints in the digital space. Many anticipated that Chinese digital giants, such as Alibaba, Tencent, Baidu, and JD, would take over the tech world. Yet, their efforts have been disappointing and their results left many believing that China’s ability to crossover into the digital market would not occur. That is, until now.

In 2018, the most downloaded apps in the U.S. included Facebook, Instagram, YouTube, Snapchat, and unknowingly for many, TikTok. TikTok became one of the most downloaded apps in the App Store for Apple users, and the Google Play Store for Android users.

Source: TechCruch

What is TikTok?

TikTok is a video sharing platform that started with short music videos but has now expanded to include content that relates to cooking, travel, fashion, and so on. Videos on TikTok can be no longer than 15 seconds, but in those 15 seconds, content creators can add music and special effects through the use of the app’s simple tools. Because of TikTok’s easy-to-use functions, virtually anyone can become a content creator on TikTok. However, the most popular TikTok videos that have crossed over into Instagram and YouTube are high on entertainment value and set trends that many other creators on TikTok follow.

Although TikTok comes from China, it is not owned by one of the Chinese tech giants. Despite massive investments in video platforms, Chinese tech giants, such as Alibaba, Tencent, and Baidu, were never able to dominate this area of the digital realm. TikTok, known in China as Douyin, was launched in 2016 by ByteDance, a Beijing-based tech company traditionally focused on news. Its news app, Toutiao, uses advanced AI algorithms that learn user preferences, then provides customized news feeds. ByteDance uses the same algorithms to provide relevant video feeds to TikTok users.

By the start of 2017, Douyin had become China’s most popular mobile video app. In November of the same year, ByteDance spent $1 billion to acquire a competing video sharing site called Musical.ly. While Musical.ly was also founded in China, most of its users were based in the U.S. The combined global reach of TikTok and Musical.ly created a powerful combination that has generated China’s footprint in the digital market and a hopeful outlook on China’s digital future.

Source: Facebook

Competition Looms

By the end of 2018, TikTok had more than half a billion active users, around 40% of them outside of China. Therefore, it is no surprise that Chinese tech giants have been closely studying TikTok’s successful approach of simple design, active promotion, and its utilization of trends in order to succeed in global markets.

Tencent is already trying to enter the short-video streaming industry by investing in Kuaishou, TikTok’s main local competitor, and reportedly giving out subsidies to promote its own platform Weishi. Those in the U.S. are also taking note, with Facebook quietly launching a TikTok competitor app called Lasso in November 2018. 

Source: Android Police

Lasso has been downloaded by an estimated 70,000 U.S. users since launching in November 2018. This pales in comparison to TikTok’s 39.6 million U.S. users that downloaded the app in the same time frame. Although U.S. users make up a large portion of TikTok’s downloads, there is an undeniable presence TikTok has among the teens of the world with 500 million active users worldwide.

Source: Oberlo

The Trajectory of TikTok

It is clear that TikTok’s growth is unheard of in the Chinese digital market and in the global space. However, ByteDance, the company behind TikTok, cannot become complacent with TikTok’s current place in the market, especially if it wants TikTok to build its position as the first globally successful “made in China” app.

The implications of TikTok’s success spans beyond materialistic accomplishments. It shows the global market that China has the ability to become major players in the digital realm, even without the backing of one of its tech giants. Therefore, combining large investments with TikTok’s successful strategic approach may lead to a “made in China” app market that competes with its global hardware markets.

Sources

U.S. Electric​ cars are becoming cheaper – but with new threats and challenges

Considering buying an electric car? Now might be a good time. The sales of electric vehicles (EV) are increasing both globally and nationwide – and the prices are going down year by year. 

Globally, the market for electric vehicles has grown rapidly over the years. In California, even while sales of cars have fallen in the state through the first half of 2019, sales of electric cars have soared from 3.3 percent of the market in 2018 to 5.6 percent in 2019.

There are a steady increase and a spike in the import price of electric motors, which are essential for plug-in hybrid electric vehicles. According to the observatory of economic complexity, the top exporters of Electric Motors are China ($12.9B), and the top importers are the United States ($9.6B). With the ongoing trade war between China and the United States, the import price of electric motors would likely go up for a while, adding to the producer price index (PPI) of electric cars made in the U.S. 

Import Price Index (Harmonized System): Electric motors and generators (excludes generating sets)

However, the median electric car in the U.S. is getting cheaper. Monopolizing the U.S. electric car industry, Tesla could release cheaper median EV models due to the maturity of the technology and the shrinking of EV battery prices. 

The decreasing battery price in the U.S. reflects a larger picture in the global battery market. The leading factors? Cobalt and lithium, two major components of the electric car battery – are becoming cheaper and cheaper.

Lithium experienced dramatic price movements, rapid demand growth, and supply deficit for refined products in recent years. However, prices are expected to fall in 2019 and after.

Lithium’s price is expected to fall in 2019 and after.

The cobalt industry also experienced a huge price surge in 2017 due to the growing sales of electric cars. It hit a 10-year peak of more than $40 a pound in April 2018 and fell back to $13 a pound in March in 2019. And its price is expected to continue to drop.

Cobalt’s price is expected to continue to drop.

According to Henry Sanderson from Financial Times, the dramatic rise in prices in 2017 was driven in part by stockpiling in China. This year, much of that inventory has come on to the market, pushing down prices. 

With the continuous slide of prices for these raw materials, it is possible that the suppliers may cut their supply until the prices go up to their expected level. But in the short-term, the shrinking cost battery will further push down the electric car price tags. 

However, considering China’s grip on the lithium needed for batteries – a single Chinese company has “effective control over nearly half the current global production of lithium” –  the trade war could greatly hurt American batteries and the electric car industry. Same for the cobalt. China was the world’s leading producer of refined cobalt and a leading supplier of cobalt imports to the United States. Unless Tesla comes up with new technology to reduce cobalt usage in its car battery, the U.S.-China tension will not help the U.S. electric car industry. 

Meanwhile, China seems to be benefiting more from the price drop of cobalt and lithium. Because China, not Tesla, is driving the electric-car revolution globally.

Since the beginning of the EV project in the early 21st century, the Chinese government has been backing up the industry by spending billions of dollars to subsidize manufacturing of electric vehicles and batteries and encouraging consumption. By 2015, electric vehicle sales in China had surpassed U.S. levels. In 2018, Chinese sales topped 1.1 million cars, more than 55% of all electric vehicles sold in the world.

Moreover, China has been aiming at the American market and challenging Tesla by introducing Chinese electric cars to the U.S. So far they have been largely successful until yesterday when Nio, a Shanghai-based Tesla-challenger, faced consecutive huge losses under the government-backed bursting bubble

To help the industry stand on its own and avoid a bubble, China has gradually scaled back subsidies since 2017 and is phasing out the subsidy program by the end of 2020. While it seems to lead to a hard time for Nio, it is unknown how much impact this decision will have on the overall Chinese EV industry.

Another potential backfire resides in resource and sustainability. The huge market for electric cars fuels the expanding demand for these raw materials – and the market (so does the demand) seems to be expanding exponentially. However, there is a limited amount of minerals on earth. Especially for cobalt, most of which came from Congo, exhaustion is predictable under such avaricious exploitation. Additionally, the illegal use of child labor, the contaminated environment, and the threatened human rights for Congolese add to the complexity of the issue. If the unlimited desire exceeds the limited amount of resources someday, we will likely face another mineral resource crisis.


Reference:

“After US$5 Billion in Losses, China’s Tesla Fights to Survive.” South China Morning Post, 23 Sept. 2019, https://www.scmp.com/tech/big-tech/article/3029968/after-us5-billion-losses-chinas-tesla-challenger-nio-fights-survive.

Clemente, Jude. “Trade War With China Exposes U.S. Mineral Import Problem.” Forbes, Forbes Magazine, 11 July 2018, https://www.forbes.com/sites/judeclemente/2018/07/11/trade-war-with-china-exposes-u-s-mineral-import-problem/#be6c9cb21044.

“Cobalt.” OEC, https://oec.world/en/profile/hs92/8105/.

“Cobalt.” Cobalt | 2019 | Data | Chart | Calendar | Forecast | News, https://tradingeconomics.com/commodity/cobalt.

Coren, Michael J. “The Median Electric Car in the US Is Getting Cheaper.” Quartz, Quartz, 6 Sept. 2019, https://qz.com/1695602/the-average-electric-vehicle-is-getting-cheaper-in-the-us/#targetText=The median electric car in the US is getting cheaper&targetText=Data analyzed by research house,price of $38,990 before incentives.

Evarts, Eric C. “Electric Car Sales Boom in California, as Plug-in Hybrids and Small Cars Sputter.” Green Car Reports, 4 Sept. 2019, https://www.greencarreports.com/news/1124891_electric-car-sales-boom-in-california-as-plug-in-hybrids-and-small-cars-sputter.

“Expanding Electric-Vehicle Adoption despite Early Growing Pains.” McKinsey & Company, https://www.mckinsey.com/industries/automotive-and-assembly/our-insights/expanding-electric-vehicle-adoption-despite-early-growing-pains#targetText=What is the Electric Vehicle,plug-in hybrid EVs).

“Import Price Index (Harmonized System): Electric Motors and Generators (Excludes Generating Sets).” FRED, 13 Sept. 2019, https://fred.stlouisfed.org/series/IP8501.

“Lithium.” Lithium | 2019 | Data | Chart | Calendar | Forecast | News, https://tradingeconomics.com/commodity/lithium.

“US EV Sales Surpass 2% In 2018 – 9 EV Sales Charts.” CleanTechnica, 13 Jan. 2019, https://cleantechnica.com/2019/01/12/us-ev-sales-surpass-2-for-2018-8-more-sales-charts/.

Unpacking the Consumer Price Index

According to my notes, the Consumer Price Index is “how expensive things are.” In accordance with this definition, I picture the CPI as an endless itemized price list of every item ever sold. Clearly, this is not an accurate picture of the CPI, which indicates that my definition needs some work. The Bureau of Labor Statistics defines the Consumer Price Index as “a measure of the average change over time in the prices paid by urban consumers for a market basket of consumer goods and services.” In other words, the CPI is a measure that tells us both the magnitude and direction of price changes. 

How does it do this? Well, instead of keeping an index of the exact dollar value of every item in the market, it measures the change from its old price to its current price. The CPI is a culmination of price comparisons; it looks at what goods used to cost and tells us whether that same good costs more, less, or the same amount.

The CPI also can tell us just how much prices are changing. Below is one version of the U.S. Bureau of Labor Statics’ CPI chart.

The larger the bars on the chart, the greater the change in price. As we can see, the energy bar is far larger than the other categories and also grows in the opposite direction. This tells us that while the prices of other goods are increasing, the price of energy has dropped dramatically. 

This type of market shift can tell us a lot about the economy. Is energy getting cheaper because there is an abundance of supply? Is energy getting cheaper because advances in technology? Is energy getting cheaper because the cost of production of energy is getting cheaper? Well, to put it bluntly, the CPI doesn’t know and doesn’t care. However, these important questions, all of which carry massive implications about the health and trends of the economy, wouldn’t be getting asked if it weren’t for the data presented by the CPI. By measuring changes in prices, the CPI becomes a valuable trailing economic indicator and allows economists to predict future market changes.  

 The CPI is a crucial tool for economists to both hypothesize about the future of the economy and recognize important trends that have already begun (inflation is the best example of this). Without the CPI, economists would have no streamlined way of knowing how much or in what way prices change. So yes, at its core, the CPI is a measure of “how expensive things are.” But at the end of the day, it is a hell of a lot more helpful than just a running list of numbers. 

Googling for the Next Recession

One of the many ways that scholars and economists try and predict the state of the economy is through what is known as an economic indicator. Recently it has been discovered that popular search engines such as Google have been able to predict economic trends in times of a nearing recession. But if America’s searches on Google are close to any sign of the state of the economy, then a recession is not as near as we may believe.

The future trends of the economy can be measured through a type of economic indicator known as a leading indicator. A research company by the name of DataTrek followed American Google searches for words such as “coupon” and “unemployment” leading up to the Great Recession. Google searches for the word “coupon” began to increase by more than 5% starting in 2005. Then there began to see a spike in the search from the term in which it rose to 45% in 2008 which was the start of the Recession. The peak of “coupon” being searched was 2011 when searches were 200% above where they were in 2005.

(Source: Google)

Searches for the term “coupon” is a result of consumers looking to spend less on items or to not even spent at all. DataTrek has found that as of June 2019 searches for this word were 7% lower since the previous summer. Other phrases tend to have an insight into the concern and curiosity of the American consumer.

According to the Washington Post, August of 2019 marked the first time that the numbers for people searching “Recession” + {current year} exceeded the numbers that were seen during the Great Recession. The likely cause for this immediate spike in searches could be linked to the Dow Jones falling more than 800 points in August and with an inverted yield curve showing troubling signs.

While this can be rather helpful in trying to find new ways to predict the direction of the American economy, there are many flaws with using this as a measure to accurately depict what is going on because each time someone is searching any of these words.

One may simply be inclined to study what a recession is for a class, looking for a coupon before making the weekly trip to the supermarket or even finding themselves being autocorrected while misspelling the tv show “Succession” There are numerous possibilities as to why one would be inclined to search for “coupon” or “Recession” and not all are directly related to the actions of the economy.

In the same study from DataTrek, keywords related to television and entertainment were linked to signs of unemployment given that people had more free time and also limited money on spending for entertainment outside of their home.Economists across the country including JPMorgan Chase’s chief economist Bruce Kasman told Bloomberg, that he believes that chances are low for a nearing Recession. Within some time it will unravel if there is a Recession nearing and if the Google data can indicate the foreseeable future of the United States economy.

Additional Sources:https://www.bloomberg.com/news/articles/2019-01-24/google-searches-signal-u-s-consumption-intact-economist-says

Democratizing Wellness

Health is the new wealth, but the two are far from mutually exclusive. From clothing to food to hobby trends–wellness is something to aspire to and is correlated to status. Whether it is sporting the newest athleisure brand, the new diet fad that is organic, vegan, free of toxins, and packed with micro and macronutrients, or paying upwards of $30 per workout class–being healthy is elite. According to the Global Wellness Institute, wellness expenditures ($4.2 trillion) are now more than half as large as total global health expenditures ($7.3 trillion), and businesses are catching on. They have capitalized off of early trends, and the wellness industry has grown about 13% in a short two years from 2015-2017 (GWI).  

If you are familiar with basic economic principles and the rules of supply and demand, the increased popularity surrounding healthy foods sent prices flying high for everyone involved, thus making them more exclusive. Access to healthy food should be a basic right–instead, it is cheaper to get a full meal from a fast food stop than to have fresh vegetables at dinner. There is no shortage of food in the United States. 50% of produce in the United States is thrown away each year–some 60 million tons (or $160 billion) (The Atlantic). Yet 13% of the country’s population lives in a food-insecure household, meaning that they do not have full access or ability to purchase healthy foods (Medium.com). This leads to a large population experiencing malnutrition–whether that means hunger or obesity, it impacts more than just those directly involved. 

Although the obesity epidemic in the United States falls across all socioeconomic status’, there is a concentration of food insecurity in lower socioeconomic status. The high demand and limited access to healthy foods is a huge reason to blame for obesity and its correlation to lower socio-economic status. “More than 23 million Americans, including 6.5 million children, live in low-income urban and rural neighborhoods that are more than a mile from a supermarket. These communities are known as “food deserts” since they lack access to affordable, nutritious food. Lack of access is one reason why many children are not eating recommended levels of fruits, vegetables, and whole grains.”(Letsmove.gov). Low-income neighborhoods offered greater access to food sources that promote unhealthy eating. The distribution of fast-food outlets and convenience stores differ by the racial/ethnic characteristics of the neighborhood (NCBI). Rather than presenting these communities with nutritious and energizing food, they are presented with options that have an adverse effect. 

Food fuels you with energy to perform at one’s potential, but fast food does the opposite. It causes health issues–primarily obesity. Obesity is related to some of the leading causes of death, including heart disease, some cancers, stroke, and type 2 diabetes (PRB.org). Obesity is a grave public health threat, and accounts for 18 percent of deaths among Americans (Commonwealthfund.org). These health issues naturally lead to higher health care costs and create a cyclical trap where people are stuck in a cycle of poor eating because of the food they can access. 

Introducing poor eating habits from a young age teaches children and instills the pattern for the rest of their life. The cycle of poor eating habits and bad health negatively impacts them as well as communities at large. Without the ability to perform at one’s full potential, it can lead to reduced economic productivity. According to a study, obesity “costs the nation over $8 billion per year in lost productivity” (Yale.edu).
Despite the thriving U.S. weight-loss market (worth $66 billion in 2017), (Webwire.com) we need a long term sustainable option. The diet industry commodifies and glamorizes health and wellness when in reality it should simply be accessible to all. Health is not something that should be a fleeting trend, but the exclusivity factor in conjunction with our farming techniques, our country is headed into a serious health crisis. To have a prosperous next generation, it is important to invest in the health of all communities for a better future together.

Perception Becoming a Reality

Just a couple days ago, on September 18, the Federal Reserve dropped interest rates by a quarter point. This is the second time the Fed cut rates in 2019 as an effort to encourage businesses to take out loans to hire more people leading to expansion and to boost economic activity by encouraging people to take out loans and use that money to spend and invest. This boosted economy means all is well and a recession can be avoided as long as people keep spending. With low rates, it is easier to borrow money and encourages more spending and investing. So, why aren’t people spending more? The perception of a soon-to-come recession.  

            “The Federal Reserve should get our interest rates to down to ZERO, or less, and we should then start to refinance our debt… A once in a lifetime opportunity that we are missing because of boneheads,” tweets the President of the United States. When the current sitting president calls the head of the Federal Reserve, who he appointed, a “bonehead,” it does not instill any sort of confidence in American people that our economy is stable and growing. Unsurprisingly, it has the very opposite effect. People are fearful of a potential recession. It has been over 10 years since our economy’s last big recession and people seem to believe that we are due for another. As a result of this fear, people are ultra-conscious of their spending habits and make even more of an effort to save money. Saving money might be great for people’s pockets, but it does not contribute to boosting economic growth. Less spending can lead to a slowdown in the economy and as a result, the recession.

Some economic indicators reveal the reality of the U.S. consumer. What retail spending, worker pay, and household spending show is that a consumer in the United States is still financially healthy. The supposed coming recession is not supported by these economic indicators but is instead backed by the public perception that our economy is due for downturn.

Had the Federal Reserve listened to President Trump’s suggestions, the public would likely have been even more fearful of oncoming doom. To conform would show weakness in our central banking system. If the Federal Reserve did cut interest rates to zero, like suggested, there would likely be even more of a panic that the recession is imminent. The Federal Reserve made a decision independent of the president which is critical in maintaining the mysterious reputation and its ability to create money and to withdraw money from the economy. If they acted as the president suggested they should, the public perception would shift to distrust in the central bank, and ultimately an even more problematic idea of the potential recession.

To avoid the recession people strongly believe is overdue, people must borrow money to spend which will contribute to economic growth. The health of our economy is now reliant on whether people respond to the lowered interest rates and to the encouragement to spend and invest. The recession is not a guarantee, and people should take individual action to make sure they add value to a growing economy.

California AB5: Gig Economy Off The Rails

On September 18th, California Assembly Bill 5 (AB5) was signed into law. Its effects will be felt most strongly in the gig economy, where many don’t feel great about it. The basic premise of California AB5 is to define the law what constitutes independent contracting and what circumstances make workers full employees with benefits (such as minimum hourly wage and compensation plans).  

Lyft, Uber, Postmates, and DoorDash are the companies where the most workers will be affected.  Hundreds of thousands of drivers (alongside thousands at other companies in this gig economy space) will now be considered employees. Full time drivers are in for a somewhat good change, as they will receive positive benefits but are also now committing themselves to businesses that were designed to profit off of independent contractors. According to a Lyft driver interviewed in a recent report in the Wall Street Journal, ride rates have decreased by about 50% in the past four years. The cost of being a full-time driver is now higher and higher because they make near (and sometimes sub) minimum wage and have to pay the costs of keeping their vehicles in top shape at all times. In the chart below you can see how much California makes up of these companies profit streams. 

The people that AB5 affects most negatively are the part time drivers, as they now lose the flexibility of choosing when and how long they work in the face of being required and pushed to work more and more hours to make being a driver actually profitable. Expenses like gas, car repair, and giving up time at other part-time/independent professional endeavors will take a toll and force these drivers to either seek full time employment or move on to other pursuits. Other states will most likely follow the path California AB5 has set up, as gig economy corporations have grown sacel-wise at such a rate in usage and in contractors that labor laws must be passed to ensure the safety of full time workers. Adding the misfortune of drivers negatively affected by this bill is that they still have no control over what the pricing on rides is. Uber and Lyft can cut back pricing on rides as much as they want to accommodate the decrease in drivers on the street

Uber alone accounts for over 65% of the ride share market according to the Business of Apps journal. Even as their IPO this year did not go very well, they still stand as the juggernaut in the ride service arena, as seen in the Statista chart below. 

On the opposite consumer side of things, this bill will lower the amount of uber drivers on the street while demand keeps increasing, and according to the Wall Street Journal will make ride prices unstable. It will be interesting to see how this change affects the free shared rides agreement Lyft has with USC for a two mile radius around campus. Many students use it to get home safely each night, as this benefit activates after 7pm. It would not be unreasonable for the company to cease programs like this for the time being while their employee number will likely go through a shifting period. 

Sources: 

https://qz.com/1706754/california-senate-passes-ab5-to-turn-independent-contractors-into-employees/

https://www.latimes.com/california/story/2019-09-22/skelton-ab5-employment-law-independent-contractors-gig-economy

https://www.theatlas.com/charts/OffkCowSV

https://www.statista.com/chart/17261/lyft-vs-uber/

Nailed it: Can nail polish be the new lipstick index?

What has a) a million colors, b) a oft-ridiculous punny name, c) the capacity to survive a nuclear apocalypse on your toes but chips off in two days on your hands, and d) the ability to serve as an economic indicator? 

Nail polish.

OPI Planks A Lot Nail Polish
OPI “Planks A Lot” nail polish / Courtesy of The Fingernail Files

In the first ten months of 2011, less than five years after the Great Recession started, nail polish and product sales were 59% higher than in the same period a year ago, according to NPD Group, a market research firm. 

Adam Davidson, an economic journalist and co-founder of NPR’s Planet Money, wrote in a 2011 New York Times column that a “rise in nail polish sales indicates that we’re searching for bargain luxuries as the economy craters – and sales of nail polish are way up right now.” High nail polish sales = good times are a’coming. A 2017 study of the global nail polish market showed that the industry is projected to reach $15.5 billion in 2024. One factor in the projected growth is the popularity of nail designs in youth populations, as well as the popularity of nail polish products in international fashion capitals, such as Paris, London and Milan. 

A key finding in the 2017 report is the increase of projected increase of gel polish. More expensive than the traditional “liquid” nail polish, gel is advertised to offer up to three weeks without cracking or chipping and faster drying time with the use of L.E.D. light. The high popularity of gel polish could be due to a variety of reasons, including a demand for longer lasting nail products. Consumers might be willing to pay more for what can read like a bionic manicure, but because of the durability of gel nails, may be spending less time at salons

Economics is part psychology, as the recession-proofness of nail polish shows. A small pleasure, nail polish can be affordable (sometimes less than a dollar). Coming in a variety of colors from deep burgundies and plums to neon yellow, as well as a variety of textures (hello 2012’s “crackle” nail polish trend), nail polish is visually appealing, and for people that choose to forgo the luxury of a nail salon, painting your nails can be a relaxing, almost therapeutic activity. 

The Great Recession seems to have catapulted nail polish to the recession-proof big leagues – in 2011, TIME named it one of the “12 things we buy in a bad economy,” a list that also featured romance novels, donuts, chocolate and condoms. Good company? 

Nail polish appears to have pushed out lipstick as the recession-proof cosmetic. Termed the “lipstick index” by Leonard Lauder, chairman emeritus of Esteé Lauder, lipstick sales used to soar during not-so-great economic terms. Like nail polish, lipstick is a quick, colorful pick-me-up – (sometimes) affordable glamor in a tube. However, lipstick sales fell in 2010

After the lipstick index’s accuracy was called into question during the Great Recession, Lauder expanded on his original definition, claiming it was never about just lipstick.

“We have long observed the concept of small luxuries, things that can get you through the hard times and the good ones. And they become more important during harder times. The biggest surge in movie attendance came during the 1930s during the Depression.”

Leonard Lauder, chairman emeritus of Esteé Lauder.

Although nail polish may not be as important an economic indicator, per se, as the GDP or unemployment, OPI’s puke-green “Uh-Oh Roll the Windows Down” demonstrates that even in times of frugality, people are still willing to spend on little luxuries.

SOURCES

The Interest Rate in Ukraine Pays Close Attention to Economic Indicators

In 2014, Ukraine underwent a revolution ousting a Russian puppet-president which sent the country into complete chaos both economically and politically. Following the revolution Russia annexed Crimea and full-on warfare broke out on the eastern border of Ukraine killing thousands of people. The economy shrank dramatically, prices went up, and given the unstable state of the economy, investments stopped flowing into the country. The interest rates set by the National Bank of Ukraine skyrocketed immediately. This interest rate is what’s called the federal funds rate in the United States. It is the interest rate set by the central bank that tells commercial banks how much interest they should charge when making loans to each other. What can the interest rate tell us about the economy and why should you as a citizen of Ukraine or foreign investor care about it? The answer is simple: what banks charge each other sets the interest rate at which they pay or charge you! The central bank’s interest rate is one of the most important factors that sheds light on the economic indicators reflecting the current and expected economic health of a country.

Take a look at this chart:

Image from tradingeconomics.com

This chart shows the interest rate set by the National Bank of Ukraine in a 10-year period. There are a couple of conclusions we can make from observing the chart. The most noticeable one is that Ukraine’s economy is incredibly unstable. That is true and, in fact, the prime reason for a spike in interest rate starting in 2014 is high inflation.

Now, take a look at the following inflation chart:

At its highest peak, inflation reached more than 60%. In order to offset the increasing inflation, the National Bank of Ukraine set its interest rate at 30% during the same time period. Since then the rate has gradually subsided to 16.5% and inflation went down to 8.8% as of this writing. As soon as the economic indicators started showing signs of recovery: inflation decreased, and GDP increased from $91 billion in 2015 to $130 billion in 2019 it made sense to lower the interest rate. However, the interest rates are still high, especially compared to those of the U.S. which recently lowered its federal funds rate to a target rate of 1.75% – 2%. The underlining explanation might not be obvious but part of the reason for keeping interest rates high is to lure foreign investments to finance the government’s debt and to rebuild Ukraine’s economy amidst the war and political pressure. Here’s what Ukraine’s short-term government bond yield looks like:

Image from www.worldgovernmentbonds.com
Data as of September 23rd, 2019

These percentages are unbelievably high. According to CNBC, the investors’: “holdings of domestic bonds have jumped nearly 10-fold since the start of the year, to 61.6 billion hryvnias ($2.4 billion).” If you are an investor searching for a high yield investment this is the time and place to invest.

Unfortunately, the Ukrainian side of the interest rate story isn’t nearly covered as extensively as the story of the Fed’s rate cut. Nonetheless, it is still worth examining the economic indicators and search for possible connections to the interest rates.

Sources:

https://tradingeconomics.com/ukraine/interest-rate

https://tradingeconomics.com/ukraine/gdp

https://tradingeconomics.com/ukraine/inflation-cpi

https://www.cnbc.com/2019/07/08/reuters-america-poll-analysts-split-on-ukraine-interest-rate-decision-in-july.html

http://www.worldgovernmentbonds.com/country/ukraine/