https://prezi.com/view/TmIjcJecrQKM88hOfZWI/
For my final project, I did a deep dive into the recent fires in the Amazon and broke down the economic incentives behind the crisis. The link to the Prezi is above. Enjoy!
genesis domain was triggered too early. This is usually an indicator for some code in the plugin or theme running too early. Translations should be loaded at the init action or later. Please see Debugging in WordPress for more information. (This message was added in version 6.7.0.) in /home3/ascjclas/public_html/wp-includes/functions.php on line 6170news domain was triggered too early. This is usually an indicator for some code in the plugin or theme running too early. Translations should be loaded at the init action or later. Please see Debugging in WordPress for more information. (This message was added in version 6.7.0.) in /home3/ascjclas/public_html/wp-includes/functions.php on line 6170https://prezi.com/view/TmIjcJecrQKM88hOfZWI/
For my final project, I did a deep dive into the recent fires in the Amazon and broke down the economic incentives behind the crisis. The link to the Prezi is above. Enjoy!
But first, a quick laugh. A few years ago, a story about one Ohio State student’s honestly went viral. After going through an unexpected break-up halted her productivity, she sent her professor this email.
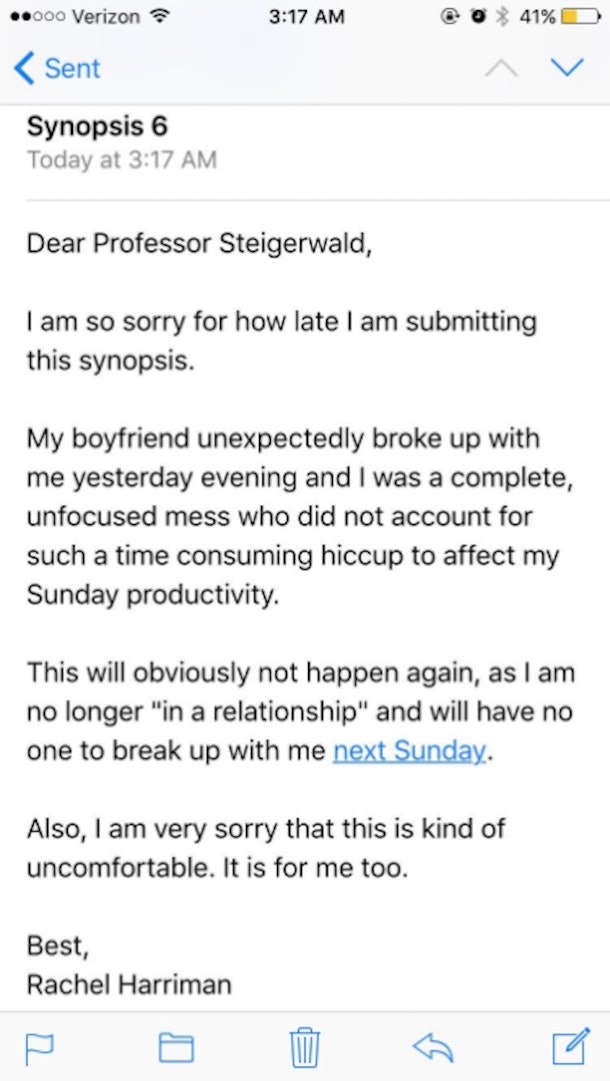
When she posted a screenshot of the email on Twitter, it immediately got the attention of the public and received over 2,000 retweets and 15,000 likes. While the humor is endearing, the attention this post received attests to something else: we’ve all been there.
Sometimes, life just gets in the way of our responsibilities and unexpected emotional distress makes it feel impossible to focus on school or work. That debilitating feeling, however, is even more intense for those of us with mental health issues.
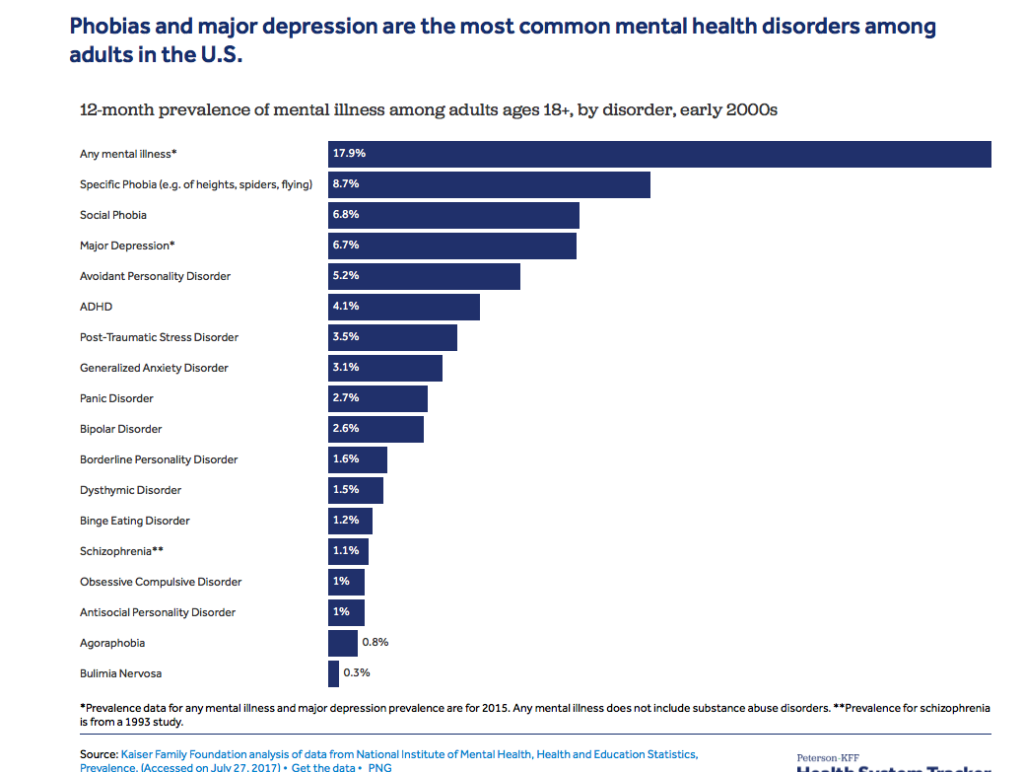
To put this issue into context, a recent study by the American College Health Association found that nearly 1 in 4 U.S. college students reported being diagnosed with a mental illness. Additionally, almost 9 out of 10 undergraduate students reported feeling overwhelmed by all they had to do and nearly half of all college students have felt so depressed that it was difficult to function.
Okay Gigi, college students are stressed. What else is new. While these statistics may seem like a non-starter, it is crucial to realize that a degree is not a cure-all for mental health issues. In fact, almost half of U.S. adults will experience a mental illness over the course of their lifetime and depression is the leading cause of disability for adults around the world. These numbers make it clear that we are in the midst of a mental health epidemic and that same sentiment is echoed by the economic impact of these mental health issues.
As it turns out, mental health is one of the costliest forms of sickness for the U.S. economy. One analysis of data from 2008 to 2014 found that “a single extra poor mental health day in a month was associated with a 1.84 percent drop in the per capita real income growth rate, resulting in $53 billion less total income each year” (ScienceDaily.com). To reiterate, that’s $53 billion lost from adding a single poor mental health day to workers’ normal schedules. And these numbers are only expected to grow. Researchers also noted that “the global economic cost of mental illness is expected to be more than $16 trillion over the next 20 years, which is more than the cost of any other non-communicable disease” (ScienceDaily.com).
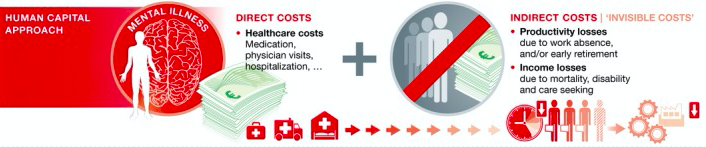
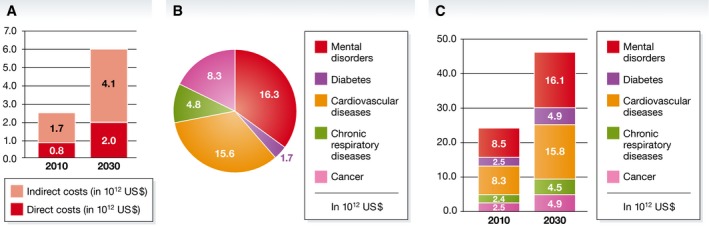
A study published in Science & Society breaks down these economic figures further, outlining the different approaches in which the economic impact of mental health issues can be evaluated. The approach I will zero in on is the Human Capital approach, which combines the direct, “visible” costs of mental illness and the indirect, “invisible” costs. “Visible costs” are what comes to mind when we think about financing illness; this includes things like medication, therapist visits, and hospitalization costs. The indirect or “invisible” costs account for “income losses due to mortality, disability, and care seeking, including lost production due to work absence or early retirement” (National Center for Biotechnology Information). This study found that the direct and indirect costs of mental disorders were estimated to amount to $2.5 trillion, where “the indirect costs (US$1.7 trillion) are much higher than the direct costs (US$0.8 trillion)” unlike other leading diseases such as heart diseases and cancer, which the graphs below illustrate (National Center for Biotechnology Information). Additionally, both of these numbers are expected to double by 2030.
The Human Capital approach is just one way of quantifying the economic impact of mental illness, but the message is clear: mental health issues are costing the economy billions and will only continue to do so if nothing is done. This should be motivation for workplaces to implement mental health protocols and resources. If companies discussed mental health issues freely and provided their employees with adequate mental health resources, employees would presumably be happier, more productive, and more engaged with their work. Investing in mental health is key to solving the current epidemic facing the world’s adult population, and as someone who wants to be a therapist in the coming years, I can only hope that others are as serious about making this investment as I am.
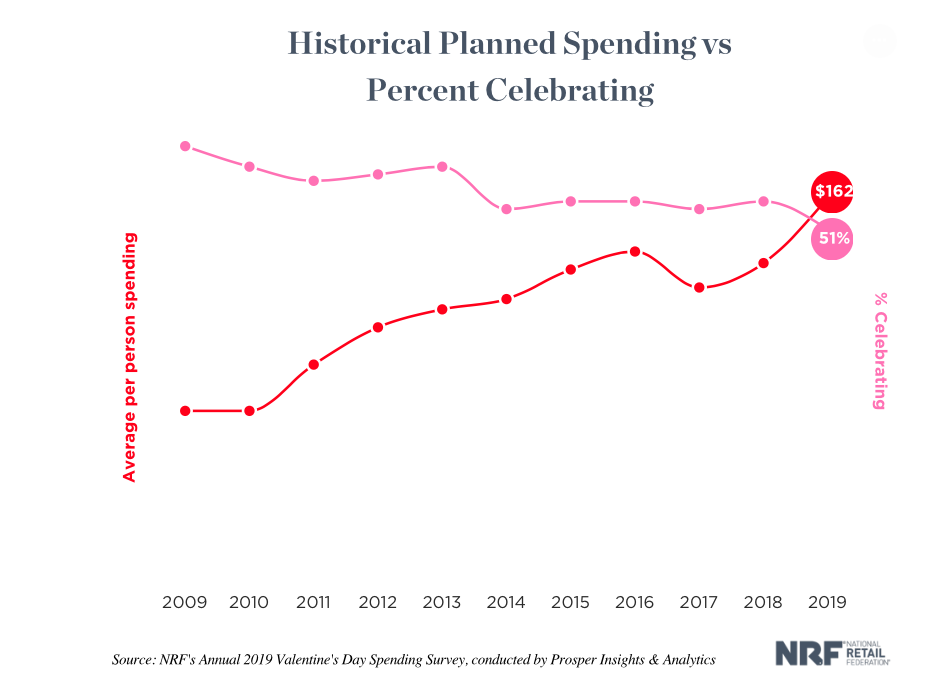
There is no doubt about it: February is a rough month to be single. With retailers everywhere fueling Valentine’s Day, one can’t help but feel at least a little left out. But who is Valentine’s Day really for? In theory, it is to celebrate your loved ones, especially your significant other. In practice, however, many feel that Valentine’s Day is more for consumerism and retailers more than anyone else. With companies and retailers making massive profits every February, Valentine’s Day has been dubbed a Hallmark Holiday, curated to make people feel like they need to spend money to prove their love. In fact, one 1994 study surveyed 105 men “found that though they primarily associated a feeling of love or friendship with Valentine’s Day, a sense of obligation was a close second.” (theatlantic.com). With the percent of people planning on participating in Valentine’s Day hitting an all time low in 2019 (only 51% of people), it is clear that individuals aren’t buying gifts because they want to, but because they feel like they have to.

But just how much are people spending out of obligation? As it turns out, quite a lot. In 2019, “celebrants were spending a record amount of $161.96 per person. That beat the 2016 record of $146.84. It’s also 13 percent more than the $143.56 spent in 2018.” (National Retail Federation). On average, men spend as much twice as much as women for the big day, which can be explained by the antiquated social expectation for men to demonstrate their ability to provide for women financially (thebalance.com). And while you may feel victorious when you buy your spouse the purse she’s been eyeing for months, no one wins more than retailers during the season of love. In 2019, shoppers funnelled a record high of $20.7 billion dollars into the economy, according to the National Retail Federation. The industries profiting most from love (and obligation) are “jewelry at $3.9 billion, clothing/lingerie at $2.1 billion, flowers at $1.9 billion, candy at $1.8 billion, gift cards at $1.3 billion and greeting cards at $933 million” (FoxBusiness.com). Tiffany & Co. , for example, saw “better-than-expected results with overall worldwide net sales rising 15 percent” during the first quarter of last year, which Valentine’s Day falls under (The Financial).
Consumer spending statistics tell us that spending for Valentine’s Day is on the rise, despite the fact that the number of people participating in the holiday seems to be falling. How can we explain this phenomenon? While I cannot pretend to have all of the answers, one possible explanation is increased consumer confidence due to an expanding economy. The U.S. economy has been steadily growing over the past few years and this leads people to feel secure in their financials. When people feel richer, they are more likely to splurge a little extra for special events like Valentine’s Day. So while five years ago, you may have bought your boyfriend the speaker system that costs $400, you are feeling financially strong this Valentine’s Day season and decide to buy him the $700 set instead. He’s a lucky guy…this year.
Regardless of whether you are buying out of devotion or out of societal pressure to live up to your role as ‘good significant other,’ the fact stays the same: you are buying. And as long as consumers continue to keep the holiday alive with gifts and special outings, retailers and Valentine’s Day will live happily ever after, oh so blissfully married by fervent capitalism and heart-shaped boxes.
According to my notes, the Consumer Price Index is “how expensive things are.” In accordance with this definition, I picture the CPI as an endless itemized price list of every item ever sold. Clearly, this is not an accurate picture of the CPI, which indicates that my definition needs some work. The Bureau of Labor Statistics defines the Consumer Price Index as “a measure of the average change over time in the prices paid by urban consumers for a market basket of consumer goods and services.” In other words, the CPI is a measure that tells us both the magnitude and direction of price changes.
How does it do this? Well, instead of keeping an index of the exact dollar value of every item in the market, it measures the change from its old price to its current price. The CPI is a culmination of price comparisons; it looks at what goods used to cost and tells us whether that same good costs more, less, or the same amount.
The CPI also can tell us just how much prices are changing. Below is one version of the U.S. Bureau of Labor Statics’ CPI chart.

The larger the bars on the chart, the greater the change in price. As we can see, the energy bar is far larger than the other categories and also grows in the opposite direction. This tells us that while the prices of other goods are increasing, the price of energy has dropped dramatically.
This type of market shift can tell us a lot about the economy. Is energy getting cheaper because there is an abundance of supply? Is energy getting cheaper because advances in technology? Is energy getting cheaper because the cost of production of energy is getting cheaper? Well, to put it bluntly, the CPI doesn’t know and doesn’t care. However, these important questions, all of which carry massive implications about the health and trends of the economy, wouldn’t be getting asked if it weren’t for the data presented by the CPI. By measuring changes in prices, the CPI becomes a valuable trailing economic indicator and allows economists to predict future market changes.
The CPI is a crucial tool for economists to both hypothesize about the future of the economy and recognize important trends that have already begun (inflation is the best example of this). Without the CPI, economists would have no streamlined way of knowing how much or in what way prices change. So yes, at its core, the CPI is a measure of “how expensive things are.” But at the end of the day, it is a hell of a lot more helpful than just a running list of numbers.
Every four years, the world comes together for the most prestigious athletic competition there is: the Olympic Games. This culmination of athletic excellence is one of the most watched events in all of television. In fact, NBC Sports Group called the 2016 Rio Olympics “The Most Successful Media Event in History” after the event drew over 3.6 BILLION viewers and NBCSN streamed an “unprecedented 6,755 hours of programming for the games.” But the Olympics impact more than just television. Host cities become landscapes of arenas and stadiums. Living rooms across the world are filled with both enthusiastic cheering and defeated sighs. Groceries stores on every corner see massive increases in sales of staple snack foods, like potato chips and soda. Clearly, the Olympics are an event with far reaching influence, but what does that mean when it comes to the economy? And more specifically, how well do the Olympics serve as an economic indicator for the country that hosts them?
Given the magnitude of the Olympics, it would make sense for one to assert that the economies of the hosting countries must be in an excellent place. This is supported by the fact that even joining the race to potentially host is quite an investment. Tokyo, for example, spent $150 million dollars on its bid for the 2016 Summer Olympics. And the most painful part? Rio de Janeiro, Brazil was selected as the host city that year.
The pay in is hefty, but once a city actually is selected to host, the costs only continue to increase. Most often, cities must undergo a massive change in infrastructure. The construction and updates of venues, hotels, roads, airports, and other necessary facilities can cost cities billions of dollars. Taking on such an investment requires immense faith in one’s economy and a commitment to government spending. In 2008, Beijing spent around $42 billion dollars hosting the Olympics. In 2004, Athens spent $15 billion. In 2016, Rio spent over $20 billion to host. This is no cheap endeavor and often even the projected budgets are nowhere close to the actual cost of the event.

But as we know, government spending is a huge part of the global economy. So if a city is dramatically increasing spending, they are putting money into the economy, creating economic stimulation and increasing the country’s GDP. In addition, the aforementioned infrastructure construction would create millions of jobs and potentially attract workers from other countries. Those workers will then also be contributing to the economy when they spend their earned wages.
But all of those changes happen before the games even begin. As it gets closer to the actual games, tourists from all over flock to the host city, increasing the amount of money spent on things like tourist attractions, retail goods, hotel rooms, restaurants, and historical landmarks. People also spend a large amount of money at the Olympic venues themselves, which further stimulates the country’s economy. Increased sales means increased consumer spending which also increases the country’s GDP.
All of these shifts seem positive; decreased unemployment, a potential increase in population, an increase in retail sales, and an increase in consumer spending — all of these changes are typically indicators of economic growth. These numbers, however, are always not indicative of reality.
In reality, the spending is simply too large to bounce back from and host countries’ economies often suffer from the massive spending. In 2008, Beijing made $3.6 billion off the Olympics. This may seem like a good number, but recall that they spent $40 billion in the first place. Athens’ damages were even worse. The city struggled to finish it’s construction in time and even after it did, the cost of the 2004 Olympics pushed Greece’s economy into a massive sinkhole. In 2004, debt was the highest in the European Union coming in at 110.6% of the GDP. In 2005, they became the first country in the EU to be placed on fiscal monitoring. In the years following, the country amounted $342 billion dollars in debt and faced massive economic recession that lasted until only a few years ago. And while the Olympics are certainly not the only factor in Greece’s economic downturn, it “certainly didn’t help.”


All across the world, massive Olympic stadiums lay in ruin, abandoned due to the price of upkeep. These battered venues perfectly illustrate the long term economic impact of hosting the Olympics, reminding us that massive government spending has consequences and economic indicators are meaningless without context. As this analysis reminds us, one should exercise caution before they truly let the games begin.