Student Debt Scares!

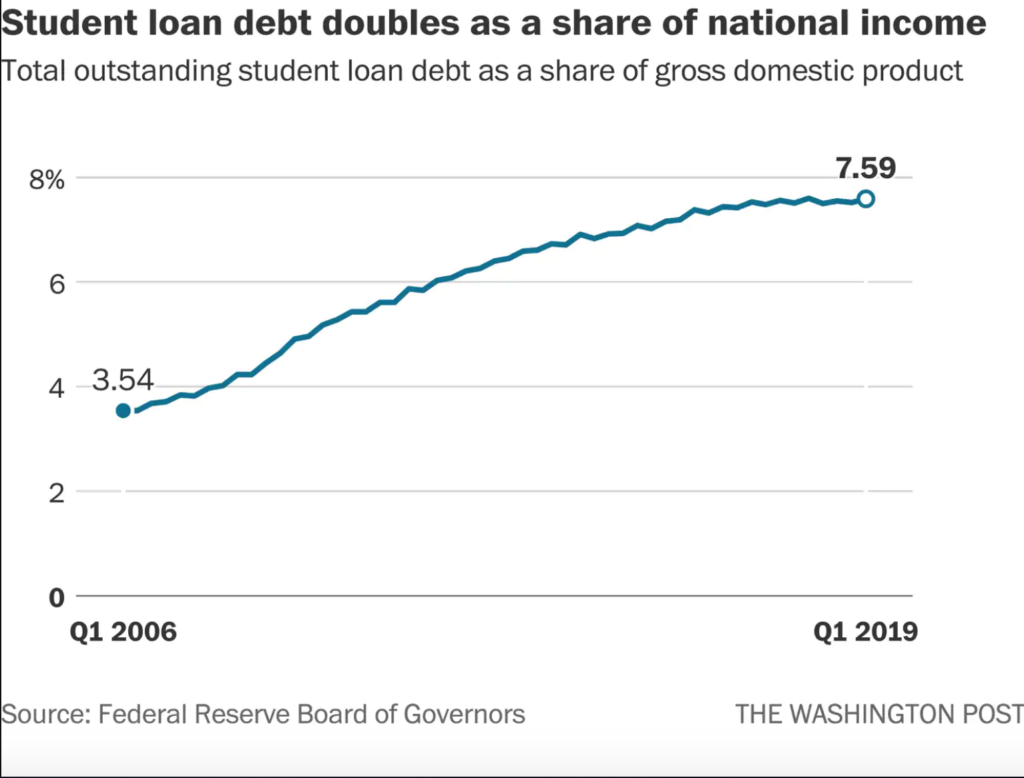
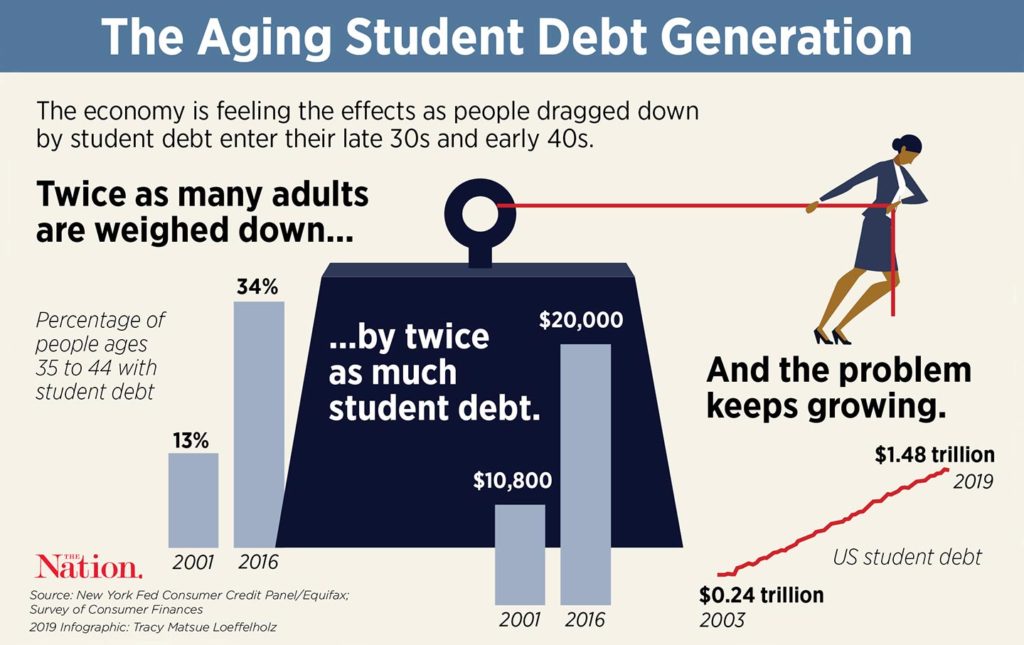
For those who earn more household income than qualified for Pell Grants but also make below the necessary means to bear the brunt of a costly higher education price tag, student loans are an attractive opportunity to finance an education. Christopher Ingraham for the Washington Post reported that American families carry more than $1.6 trillion in student debt or nearly 8 percent of national income. The number is striking, and it’s not going away any time soon. Since the 2000s, this figure has doubled, the Washington Post said.

With the pressure to earn a degree and an attractive promise of future opportunities, many bite the bullet and take out student loans. According to The Balance, the average U.S. graduate was straddled with over $39,400 in student debt in 2017. Some public service jobs and companies offer loan forgiveness opportunities for their employees, promising to pay off their worker’s college loans. Additionally, presidential candidates such as Bernie Sanders have expressed their plans to cancel student debt or make the cost of higher education free, making an attractive promise to those who understand the crippling weight of debt.

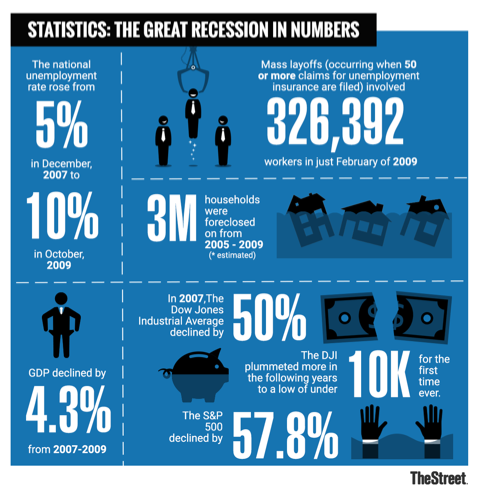
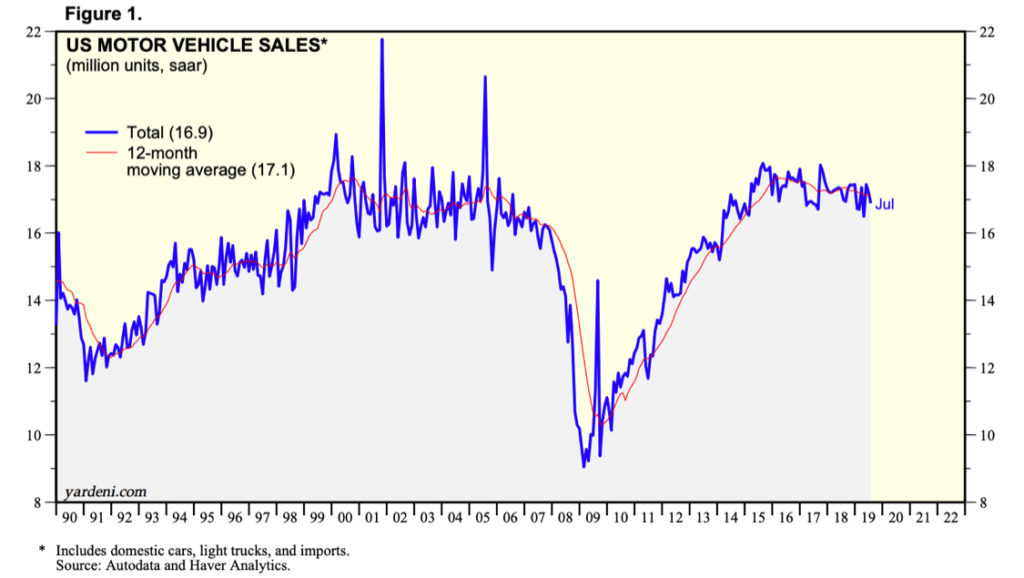
What are the implications of this financial burden? People are delaying marriage, investing less in small businesses, choosing not to buy homes and putting their income straight to paying off debt instead of saving for retirement, Ingraham said. And because of this, people aren’t spending as much money on goods and services. The Balance reported that individuals are less likely to seek out types of credit (like using credit cards or taking out car loans) because they are reluctant to borrow more money. As a result, lenders and banks receive less interest fees and slow spending affects businesses. 

The real question, then, is if a college education is worth saddling piles of post-grad debt. CNBC referenced Twitter trends in which users encouraged other students to drop out of college because they claimed the student debt wasn’t worth it. 

Unfortunately, there is no clear answer because traditionally, a college degree is synonymous with upward mobility and higher earning potential. It’s almost universally acknowledged, in America at least, that to be competitive in the job market, having a bachelor’s degree is the baseline expectancy. 

Thirty-six percent of college graduates say their degree wasn’t worth it, according to CNBC, but experts say it’s still valuable. If basic economics centers around supply and demand, the demand for a college degree is higher than ever before, driving up the price of attaining one. Still, the solutions are bleak. The CNBC article says to avoid too much student debt, choose a more affordable college (advice that offers little solutions, in my humble opinion), and an author quoted in the piece says, “Don’t buy the typical advice that everyone seems to be throwing around these days saying college loans are the worst thing on earth. They’re not.” Still, delaying a family and withholding home-ownership sounds pretty rough to me. In the end, like most things, opportunities are a pay-to-play game and college is no exception with broader economic implications.

Saudi Arabia Aramco Attack

On Sept. 14, a major oil field, Khurais, and another major refinery, Abqaiq, owned by Saudi Arabia’s Aramco were attacked by drone missiles. Geo-politics aside, this led to an unprecedented, major disruption of 5 percent of the world’s energy supply. These two locations account for half of the kingdom’s total output. This equates to 5.7 millions barrels per day.

The price of oil on Sept. 13 was $54.85 dollars per barrel.

Here, the price of oil skyrocketed to $62.90 per barrel just after the attacks. A natural reaction to a sudden shock in a major source of the world’s energy supply.

The price of oil today has lowered to $57.29 per barrel. That is due to government reactions towards the attack which calmed the marketplace.

Saudi-Kuwait joint oil operations announced that they would return to full production very soon. Matter of fact, half of the disrupted output has been restored as Tuesday Sept. 17. Saudi Energy Minister, Prince Abdulaziz bin Salman, said that Aramco will be operating at a full capacity by the end of September. Also, the Saudi official said that the country would use oil supplies on-hand to keep markets leveled.

President Trump also aided in the oil-supply crisis. He authorized the release of the US’ Strategic Petroleum Reserve; furthering the stabilization of crude oil prices. The reserve is located in salt caverns beneath Louisiana and Texas and is the largest of its kind.

The Strategic Petroleum Reserve was established in 1975 by President Gerald Ford as a result of the Arab embargo of the time. This was part of the Energy Policy and Conservation act. The purpose of the Strategic Petroleum Reserve is to keep at least 90 days worth of oil in case crises (such as the embargo and current attacks) were to arise and cause a disruption.

Dot Com Crisis: A Crash Course in Stocks + Frenzy

The Dot Com Bubble is a fascinating foray into supply, demand, and tech hysteria. As the name suggests, the Bubble started as a wave of mass investment. Simply put, investors purchased shares of newly formed web-based companies. These investments were not necessarily prompted by sound business models or impressive sales, but simply because of the excitement surrounding the boom of the World Wide Web (WWW). I mean, at least one business had to succeed right?

Impressionable investors paid significantly more for WWW-based stocks than they were actually worth. As a result, initial public offerings (IPOs) were heavily inflated. For example, when Netscape Communications corporation made an IPO, it closed its stock at $58.25, valuing the company at $2.9 billion. Overall, the National Association of Securities Dealers Automated Quotations (NASDAQ) saw growth from 1995 where it had 1000 points to around 5000 points in 2000.

The eponymous Bubble itself came from the result of all these investments. The difference between the investor’s perceived value of a Dot Com company and the actual income generated from these companies created a market bubble. In short, colossal amounts of money being invested in web-based companies that couldn’t return the expectations created a system that was not sustainable. The bubble would eventually have to “pop”.

And early in March of 2000, the bubble did indeed finally burst. The NASDAQ has lost over two-thirds of its value near the end of 2002. Hundreds of web-based companies lost value, such as 360networks, Inc., Broadband Sports, and Freei. However, not all companies went defunct. Notable players in today’s industry survived the bubble burst. These include Amazon and Ebay, which were able to raise billions of dollars leading up to the bubble pop.

Today, new economic bubbles are emerging-  student loan debt, federal debt, and unfunded state pension liabilities. Time will tell if investors have learned their lesson, or if companies will become more creative in mystifying new industries.

Beans, Beans, and More Beans

Economic indicators give analysts clues to how future trends will likely behave. For example, a drop in purchases of diamond-based jewelry may imply that fewer Americans have the means to spend on luxury items.  Similarly, employment indicators offer economists signs of employment indicators could go either way and they don’t have to be tied to a recession relief; an increase in employment suggests a rise in consumer spending.

“But what about the beans?” no one but a legume connoisseur asked.

Among one of the more unusual economic indicators, no comma are baked beans and similar canned food items. The Baked Beans Index refers to a rise in consumer spending on canned goods. This suggests that the population turns to the salty alternative out of necessity, not preference. In times where fresh fruit and organic vegetables would be a luxury, such as recessions, baked beans allow for a filling meal for the common folk.


A look at the canned food industry suggests that, save for a dip in sales in 2016, there would have been slow but steady growth. The drop in canned goods purchases could be attributed to the after-effects of the Great Recession. Though the last major recession took place between the years of 2007-2009, the economy itself took time to stabilize.
Additionally, though the poorest people in the USA didn’t have far to  fall when it came to the quality of life, the middle and upper classes were affected the most. According to the U.S. Bureau of Economic Analysis, “real GDP fell $650 billion (4.3%) and did not recover its $15 trillion pre-recession level until Q3 2011.”

Most notably, unemployment rose to its highest at 10.0% in October 2009, and did not return to its pre-recession level of 4.7% until May 2016. Due to employment rates normalizing in 2016, it could be assumed people were making enough to be able to spend on “luxuries” like fresh food and veggies. Thus canned goods sales dropped dramatically. The spike in revenue growth for the fruit and vegetable processing industry shown in 2017 could be attributed to the settling normalcy of the job market. 

The above graph displays the fruit & vegetable markets in the USA, within the same time period as the first chart. The 3.19% decrease in canned fruits/vegetable sales corresponds with the revenue growth for fresh goods. In fact, market research firm IBIS World indicates that there was a 1.2% increase in fresh vegetable consumption in 2016. To put that into perspective, people in the US on average ate 640.29 lbs of fresh vegetables in 2016; people, by comparison, ate an average of 633.31 lbs of fresh vegetables in 2015. 

So take note: next time you buy fresh fruit over canned, be sure to savor it before another recession.


Greece’s economy finally on the rise?

After being in a debt crisis since 2009, consumer confidence is at its highest level since 2000 and GDP is expected to have almost 2 percent growth following the fiscal year.

Greece’s GDP Growth up until July 2019. The final quarter will be out at the end of the fiscal year!

How did Greece’s debt crisis get even worse after 2015?

Back in 2015, Greece was still trying to move in a positive direction following an already six year debt crisis. So when the July elections of 2015 came around, the people believed they needed drastic change and elected Alexis Tsipras and his super “left-winged” Syriza party to try and move the economy forward for a change. Tsipras implemented corporate taxes, regulations on international trade, and tons of entitlement programs that the government could not pay for. All of these policies made the debt escalate further which created a major recession.

Alexis Tsipras, the former leader of the Syriza party and prime minister of Greece


The Change in the Right Direction!

Greek citizens became extremely frustrated at the results of Tsipras and the Syriza party through their term, and earlier this year in the July elections opted to elect Kyriakos Mitsotakis, leader of the fiscally conservative “New Democracy” party. After years of different right and left-winged parties running the economy, Greece finally has returned to the two-party system that had them flourish in 2000. Many people worldwide were scared prior to the election that Greece would lean toward right-winged extremism”, but “The New Democracy” party beat out the right-winged “Golden Dawn” party to ensure that democracy is still alive and can flourish again in Greece. Mitsotakis did just that, reversing the socialist agenda that plagued the economy prior to his election. Mitsotakis has implemented corporate tax cuts, lifted restrictions on international trade, and limited entitlement programs within Greece since the government cannot afford it yet. He will continue to reform and work on these policies in the next couple of years as well. These policies are predicted to help the economy grow further and cause GDP to have 2 percent growth at the end of this fiscal year saw. Even though Mitsotakis has just been elected, many economists now believe the Greek economy is stable and will continue to get even better as the economy is at its best since 2000.

The prime minister of Greece, Kyriakos Mitsotakis.


Returning to Normality!

Greece’s capital controls and restrictions are a thing of the past with Mitsotakis in office. Unemployment is still the biggest issue in the Greek economy, but it’s down to 17 percent from its peak at 28 percent in 2013. Granted, many Greek workers do not get fired, as discussed in class last week, so people of college-age or in their young 20’s have a hard job getting employed. That problem is not only an economical issue but a political one as well which makes it hard to judge Greece’s economy on that 17 percent unemployment. Because international trade does not have as many restrictions anymore, Greece is all of a sudden a player in the foreign market, which in the next couple of years will spur the economy to grow even more. Another policy Mitsotakis has implemented is the banks getting rid of “non-performing” or “bad” loans which is set to help grow the economy as well. Greece’s new finance minister Christos Staikouras plans to re-pay 3 billion of Greece’s 8.5 billion euro debt this year as well. All of these policies are not only moving the Greek economy forward but also preventing it from future crashes.

Sources: https://www.ft.com/content/c2c42066-d93c-11e9-8f9b-77216ebe1f17 https://tradingeconomics.com/greece/gdp-growth-annual https://www.southeusummit.com/europe/greece-marks-major-economic-milestone-in-advance-of-a-month-of-financial-planning/

Is It Time To Walk out? How the Strikes Indicate the Business Cycle.

Labor strike has a long history since the industrial revolution, dating back to early 19th century in Europe. It is rarely a top news today. The barista who made a coffee for you at Starbucks, the cleaner who mopped the floor at McDonalds, and your favorite barber at the street corner, may have once protested on the streets.

Fast food workers went on strike at East Los Angeles. Photo taken by Moting Jiang.

It won’t disturb you too much under most circumstances, unless, for example, the angry railway workers make the company cancel your train. But to some extent, the labor strike can tell you what’s happening to our economy, which might somehow impact your life.

Worker strikes can have a wide range of incentives, and in this blog we focus on the economic ones, that is, those over mandatory issues such as wages, working hours, union rights and so on. It is not hard to detect that the number of economic strikes fluctuate yearly. At certain points the workers seem much more proactive than usual, and we can name this phenomenon as the strike cycle. Does it remind you of something? Our economy has periodic expansion and recession too, referred to as the business cycle. Does these two cycles correlate?

Conceivably, it is assumed that strikes occur more frequently and last longer at the period of economic recession; the album of economic depression always contains the pictures of desperate penniless workers marching on the roads. The employers intend to lower the wages and dismiss the employees in an attempt to make their shrinking business survive, consequently arousing disputes and frustrations. However, regarding the demand and the supply of the job market, it is also likely that employees are less inclined to strike when they are at a risk of being crowded-out, while their bargaining power improves during economic expansion. If the workers are rational and self-interested, seemingly they will not irritate their boss when they are losing money.

What Studies on Historical Data Tell Us

A 1952 study by Rees compares the Bureau of Labor Statistics(BLS) series on monthly strikes with the reference business cycle of the National Bureau of Economic Research(NBER) after WWI. It concludes that there is a significant conformity between the two cycles, and the strike peak constantly precedes the business one (Figure 1). Rees explains that the strike represents the tension between union and employers. When the economic expansion is starting, the union has higher expectations while the employers react negatively to it, so their divergence reaches the maximum level.

Figure 1. Credit to Rees, A. (1952). Industrial Conflict and Business Fluctuations. Journal of Political Economy, 60(5), p.361

Some scholars focus on the the relations between strike duration and the business cycle instead. The Institute for the Study of Labor issued a paper in 2008, citing over ten thousand strikes recorded by the Engineering Employers Federation in Great Britain from 1920 to 1970. It discovered that the labor strike duration is countercyclical, that is, the strike will last longer at the time of economic upturn. Additionally, higher employment rate usually enables the union to achieve better outcomes.

It should be noticed that some economists are highly suspicious of the strike data as an economic indicator, concerning that (1) the strike can be driven by political activities such as election and political campaign;  (2)the strikes, like many human activities, can be random and irrational. Scully wrote after studying the strike cycle in mid-20th century that “there is no relationship between the strike cycle and the business cycle” in the long term (while in the short run they do correlate).

Work Stoppage and Economic Cycle in Post-WWII U.S.

What does the labor strike data tell us about the U.S. economics in the past 80 years?

According to BLS statistics, the number of labor strikes in U.S. since 1940s has gradually declined, while still having a cyclical pattern (Figure 2).  BLS only recorded the days of idleness since 1980s, and it also displayed similar pattern(Figure 3).  With reference to the business cycle defined by NBER (Table 1), it is found out that the strike frequency never peaked during the recession. Except for 1948-1950 and 1957-1958 recession, when the economy is shrinking, workers are less inclined to protest on streets than they were in the previous year. When it comes to the strike duration, such correlation is less apparent, partly due to the lack of statistics. But it is still safe to claim that labor strikes usually lasted shorter than last year if the economic downturn is going on.

Table 1. The U.S. reference business cycle since the WWII. Credit to NBER https://www.nber.org/cycles/recessions.html
Figure 2. Data retrieved from Bureau of Labour Statistics and graph generated by the author. See BLS database at https://www.bls.gov/wsp/

Figure 3. Data retrieved from Bureau of Labor Statistics and graph generated by the author. See BLS database at https://www.bls.gov/wsp/

The above-mentioned evidences support the argument that labor strikes increase as the economy booms in order to maximize the union’s bargaining power. Nevertheless, business cycle can not account for all the characteristics of the strike cycle. For instance, the fluctuation of labor strike became very minor after 1990s, and it did not rise up significantly from 1991 to 2001 when the economic blossomed for almost a decade. Potential explanations lie in the development of union trades and labor rights legislation.

In conclusion, Labor strike data reflects the union’s behaviors as rational players in the economy. Trade unions are more likely to organize working stoppage when the business cycle is at its top, and workers are less likely to protest when the economy is falling down and offering less jobs. However, given that other factors especially the political events also exert an essential impact on trade union’s decision-making, it requires more caution to treat strike data as an economic indicator.

Reference

Scully, G. (1971). Business Cycles and Industrial Strike Activity. The Journal of Business, 44(4), 359-374. Retrieved from http://www.jstor.org/stable/2352052

Rees, A. (1952). Industrial Conflict and Business Fluctuations. Journal of Political Economy, 60(5), 371-382. Retrieved from http://www.jstor.org/stable/1826482

Devereux, P. J., & Hart, R. A. (2011). A good time to stay out? Strikes and the business cycle. British Journal of Industrial Relations, 49, s70-s92.

U.S. Bureau of Labor Statistics. https://www.bls.gov/

The National Bureau of Economic Research.https://www.nber.org/cycles/recessions.html

Men’s underwear may tell you how the economy is doing

Photo credit to Global Times

A rise in men’s underwear sales might be part of the signal that the Liaoning Province in northeast China’s is on the path to recovery.

The economic growth of Liaoning Province was 4.2 percent in 2017 and 5.6 percent in 2018. At the same time, according to a report released by JD Big Data Research Institute, part of one of China’s biggest online shopping sites, sales of men’s underwear in Liaoning rose 42 percent in 2017 over the previous year and went to another 32 percent in 2018. The rate of increase in underwear sales in Liaoning was greater than in any other province. An analysis of consumption also shows that Liaoning’s consumers pay more attention to the quality and color variety of clothes.

“The recovery is mainly due to coal and steel prices rising during the period, and the recovery can also be seen in the volume of railway and road freight, electricity consumption of industry, volume of business and employment,” said Liang Qidong, vice president of the Liaoning Academy of Social Sciences, on a Global Times report.

Liang also addressed that the Men’s Underwear Index and similar indexes like “yogurt index” and “bread index” could be taken as an economic indicator.

Liang was not the first person to come up with the concept. Back in the 1970s, Alan Greenspan, the former chairman of the Federal Reserve, first introduced and popularized the Underwear Index. Greenspan found that there was a close connection between the economy’s performance and the sales of men’s underwear. Declines in the sales indicate a weak economy, while upswings predict a recovery in the economy. Behind the theory, a basic assumption is that men’s underwear is a necessity instead of a luxury item, so sales of men’s underwear will keep relatively stable except in times of a sluggish economy. Therefore, men’s purchasing habits for underwear is thought to be an effective economic indicator that can detect the beginning of a recovery during an economic downturn.

The sales of men’s underwear dropped in an economic recession in the United States. Data show a 2.3 percent drop in sales of entire men’s underwear products in 2009, according to Mintel, a London-based market research firm. While as the economy recovers, sales of men’s underwear in the United States have risen. As reported by Quartz, U.S. underwear sales grew by nearly $1.1 billion between 2009 and 2015, after falling in the wake of the 2008 financial crisis. Hanes, a popular lingerie brand, has seen a similar trend.

“If you look at sales of male underpants it’s just pretty much a flat line, it hardly ever changes,” economist Robert Krulwich told HuffPost in an article after the publishing of Greenspan’s book, “The Age Of Turbulence.” “But on those few occasions where it dips that means that men are so pinched that they are deciding not to replace underpants. And [Greenspan] said ‘that is almost always a prescient, forward impression that here comes trouble.’”

However, the concept may be not academically accurate, even though the Underwear Index can be used to reflect the economic situation from a province to a nation. Several reasons presented by critics on Investopedia should be considered, including the frequency of women purchasing underwear for men, and an assumption that men would not purchase new underwear until it is threadbare, regardless of the economic condition.

Sustainable Fashion for a Sustainable Economy

It’s all eyes on Fashion Week season – but not exactly for the insight into Spring/Summer 2020 trends. This September runway will showcase exactly which designers will be taking sustainability into design consideration and which ones will not. London Fashion Week garnered atypical recognition last year with protestors hitting the streets to demonstrate the negative effects on climate change deriving specifically from the fashion industry. While non-sustainable measures often ensue from the cost-cutting nature of fashion brands, the long-term global economic benefits of being “green” should be noted. 

A 2016 EPA report reveals that about 9% of all solid waste in the United States come from rubber, leather and textiles suggesting that a tenth of the our climate problem is attributed to one industry. With that type of power, the potential to improve the economy may come from fashion brands and their sustainable efforts. 

The Green Tradeoff

Shoppers want to make greener purchases, but sometimes budgetary constraints do not allow them to do so. With 75% of consumers agreeing that a brand’s sustainability is important to them, it should be in the best interest of a company to take eco-conscious initiatives. However, for a consumer to be able to shop sustainably they might have to spend almost eight times more. When searching for wardrobe staples — perhaps a black midi dress — a sustainable consumer could seek out Reformation and pay $218. But fast fashion brand H&M (HMRZF) lists a similar dress at an affordable price of $24.99. For a company such as H&M, implementing “greener” policies would raise costs and put them at a risk to losing customers that cannot manage or justify such purchases. 

Credit: H&M
Credit: Reformation

Climate Damage Also Means Economic Damage

A 2018 study by Tom Kompas of the University of Melbourne concluded that countries that comply the most with the Paris Accord will see significant economic benefits compared to those that do not comply. In some cases, the economic damages could range from $9.5 to $23 trillion per year. Not only are irresponsible fast fashion policies causing irreversible damage to our climate, but they also are indicating global economic damages of irreparable proportion.

The incentive for the government to enact and enforce green policy, primarily in the fashion industry, is clear: as production becomes cleaner, global economies benefit, suggesting accelerated GDP growth. Buyers will continue to choose environmentally detrimental brands simply for the savings. If policy were to change and more companies were rewarded for their eco-friendly initiatives by the government, more eco-friendly options at a range of prices would become available to the public, promoting spending.

Presently, our administration has made policy decisions that are not in the best interest of the climate. When creating his model, Kompas had no choice but to assume that the United States would still be following the Paris Accord. In reality, we do not know for sure if or when we will ever join the Paris Accord again. This likely skews Kompas’s study; the economic damages predicted could very well be much worse. Policymakers and enforcers must take these actions into consideration for the sake of the health of the globe and the health of the global economy.

Additional Sources:

http://climatecollege.unimelb.edu.au/files/site1/seminar_documents/Kompas%20EF%202018%20REV.pdf

https://www.forbes.com/sites/kaleighmoore/2019/05/19/new-report-shows-sustainable-fashion-efforts-are-decreasing/#50b469737a4f

https://www.cnn.com/style/article/fashion-week-what-to-expect/index.html

https://www2.hm.com/en_us/productpage.0743995001.html

https://www.thereformation.com/products/graciella-dress?color=Black&via=Z2lkOi8vcmVmb3JtYXRpb24td2VibGluYy9Xb3JrYXJlYTo6Q2F0YWxvZzo6Q2F0ZWdvcnkvNWE2YWRmZDJmOTJlYTExNmNmMDRlOWM2

Building Permits as an Economic Indicator

Typically, when a city’s economy is performing well, it’s population will grow. A strong economy full of expanding, competitive businesses sparks an increase in job opportunities. This, in turn, leads to the construction of new office and apartment buildings. While this simplified chain of events seems rather self-explanatory, analyzing the volume of construction on a local and national level is a sufficient method of understanding the current state of the economy. In other words, looking at the number of issued building permits can provide a benchmark for just how confident businesses and consumers are feeling. In turn, it provides a useful gauge of how well our economy is performing.

By definition, building permits are a form of approval issued by either the government or a regulatory body before the construction of buildings are legally permitted to commence. Data pertaining to building permits is collected on a monthly basis and  is published by the U.S. Census Bureau. This data is collected nationally and broken down by region, state, metropolitan area and county. The data is published on the 18th of every month. 

A look at commercial building permits often signals that businesses are expanding and new ones are forming. Additionally, an increase in permits for warehouse space indicates that commerce, in the coming years, will most likely improve. 

Where commercial building permits indicate the current state of businesses, residential building permits are indicative of behavior and sentiments on a consumer level. For example, a rise in single family homes can indicate that residents have reached a level of economic agency where they feel comfortable enough settling down and moving into more spacious, permanent accommodations. 

Because building permits are not mandatory in all regions of the U.S., the number of building permits is typically fewer than the number of housing starts. Examples of construction and remodeling projects that typically do not require a building permit include: repainting a house, building small fences, repaving driveways and refurbishing kitchen appliances. 

When more building permits are granted, this means that more money will be allocated towards housing, and thus the number of housing starts will increase. However, if housing starts begin to drop in comparison to building permits, this means that construction may be postponed in accordance to environmental or economic conditions

So where does the activity of building permits stand today? This past July, building permits in the U.S. increased by 8.4% (See graph above). This surpassed the market expectation of 3.1%. This growth in building permits is the steepest gain the U.S. has seen since June 2017. When broken down by region, it reveals that this growth was felt most prominently in the West and the South. Overall, building permits totaled an average of 1.33 million for July 2019. So far, December, which reached 1.3 million permits, has been the high of 2019.  

In 2005, when the U.S. economy was at one of its best moments, building permits almost surpassed the record high of 2.41 million in December of 1972 (See graph below). However, leading up to the 2008 recession, the number of building permits plummeted. As demonstrated by the data for June 2019, they have since recovered and are currently climbing. As an economic recession looms in the future for the U.S., building permits will be a key indicator to watch in the near future. 

Sources:

http://www.incontext.indiana.edu/2001/april01/details.asp

https://tradingeconomics.com/united-states/building-permits

https://marketrealist.com/2015/02/understanding-building-permits-impact-homebuilders/

Motor Vehicle Sales Predict the Future of the U.S. Economy

(Photo Credit to Brookings.edu)

Motor vehicles have become a major part of the U.S. economy since its creation. They continue to rule the streets of the U.S. in the forms of cars, trucks, and buses. Although it has become such an integral part of our daily lives, the total sales of motor vehicles are the key to predicting the future of the U.S. economy. 

In the last 29 years, the U.S. economy has gone through tremendous ups and downs. The lowest the economy has fallen in the last 29 years was from 2007 to 2009. This period is known as the Great Recession. During the Great Recession, the unemployment rate doubled from 5% to 10%, about 3M households were foreclosed on from 2005 to 2009, and the GDP in the U.S. declined by 4.3%. For those living in the U.S. during this time, it became clear that there was something very wrong with the economy. 

To indicate how the economy is transforming through any time, economists may analyze the Gross Domestic Product, the Consumer Price Index, or the interest rate. However, an economic indicator that may not seem as apparent as the GDP, for example, is the total motor vehicle sales in the U.S. 

According to Julia Kagan at Investopedia, the total motor vehicle sales is “the number of domestically produced units of cars, SUVs, mini-vans and light trucks that are sold.” The total number of motor vehicle sales in the U.S. is measured by the reported sales by individual manufacturers on the first business day of every month. Although one may categorize the sale of motor vehicles as a part of consumer spending in general, motor vehicles play such an integral role in our society that it may act as an economic indicator.   

In Figure 1, it is clear that leading up to the Great Recession, the total vehicle sales in the U.S. was steadily positive from the period of 1991 to the middle of 2007. Then, the Great Recession occurred, and all motor vehicle sales dropped significantly until the beginning of 2009. Although there are various factors associated with this significant drop, it is important to note that, during this time, the Big Three automakers in the U.S. had to ask Congress for help similar to the bank bailout. At that point, General Motors Company and Chrysler LLC faced bankruptcy, and the Ford Motor Company needed help to compete with other automakers. Eventually, sales began to rise and have now started falling. 

In 2019, the first-quarter auto sales have dropped by nearly 2.5% from the previous year, according to J.D. Power and LMC Automotive. This is due to auto manufacturers producing more expensive cars rather than cheaper cars, which helps the used car industry but hurts the new vehicle market. However, it is important to also think about the demand for new cars. The demand for new cars may be decreasing due to various economic factors that relate to consumer confidence. Therefore, the total motor vehicle sales in the U.S. acts as an economic indicator that is telling of the future of the U.S. economy. 

(Photo Credit to Huntington Beach Ford)

Sources

https://www.investopedia.com/terms/m/motor_vehicle_sales.asp

https://www.cnbc.com/2019/03/26/us-auto-sales-are-falling-and-cars-are-more-expensive-than-ever.html(J.D. Power and LMC Automotive)

https://www.yardeni.com/pub/ecoindauto.pdf(Figure 1)

https://www.thestreet.com/politics/what-was-the-great-recession-14664025(Statistics: The Great Recession in Numbers)

https://www.history.com/topics/21st-century/great-recession-timeline

https://www.thebalance.com/auto-industry-bailout-gm-ford-chrysler-3305670