Housing Vacancy Rates

The economic indicator of housing vacancies and homeownership delves into the overall status of homeowners and renters, particularly the vacant rates. Rental and homeowner vacancy rates are obtainable for U.S. regions, states and for the 75 largest Metropolitan Statistical Areas (MSAs), and information about geographies are accessible both quarterly and annually, according to census.gov.

The real question is, how do we decipher these rates in the short term (the past few years) and in the long term (a decade or longer)? What does an understanding of these rates tell us about housing issues in the United States?

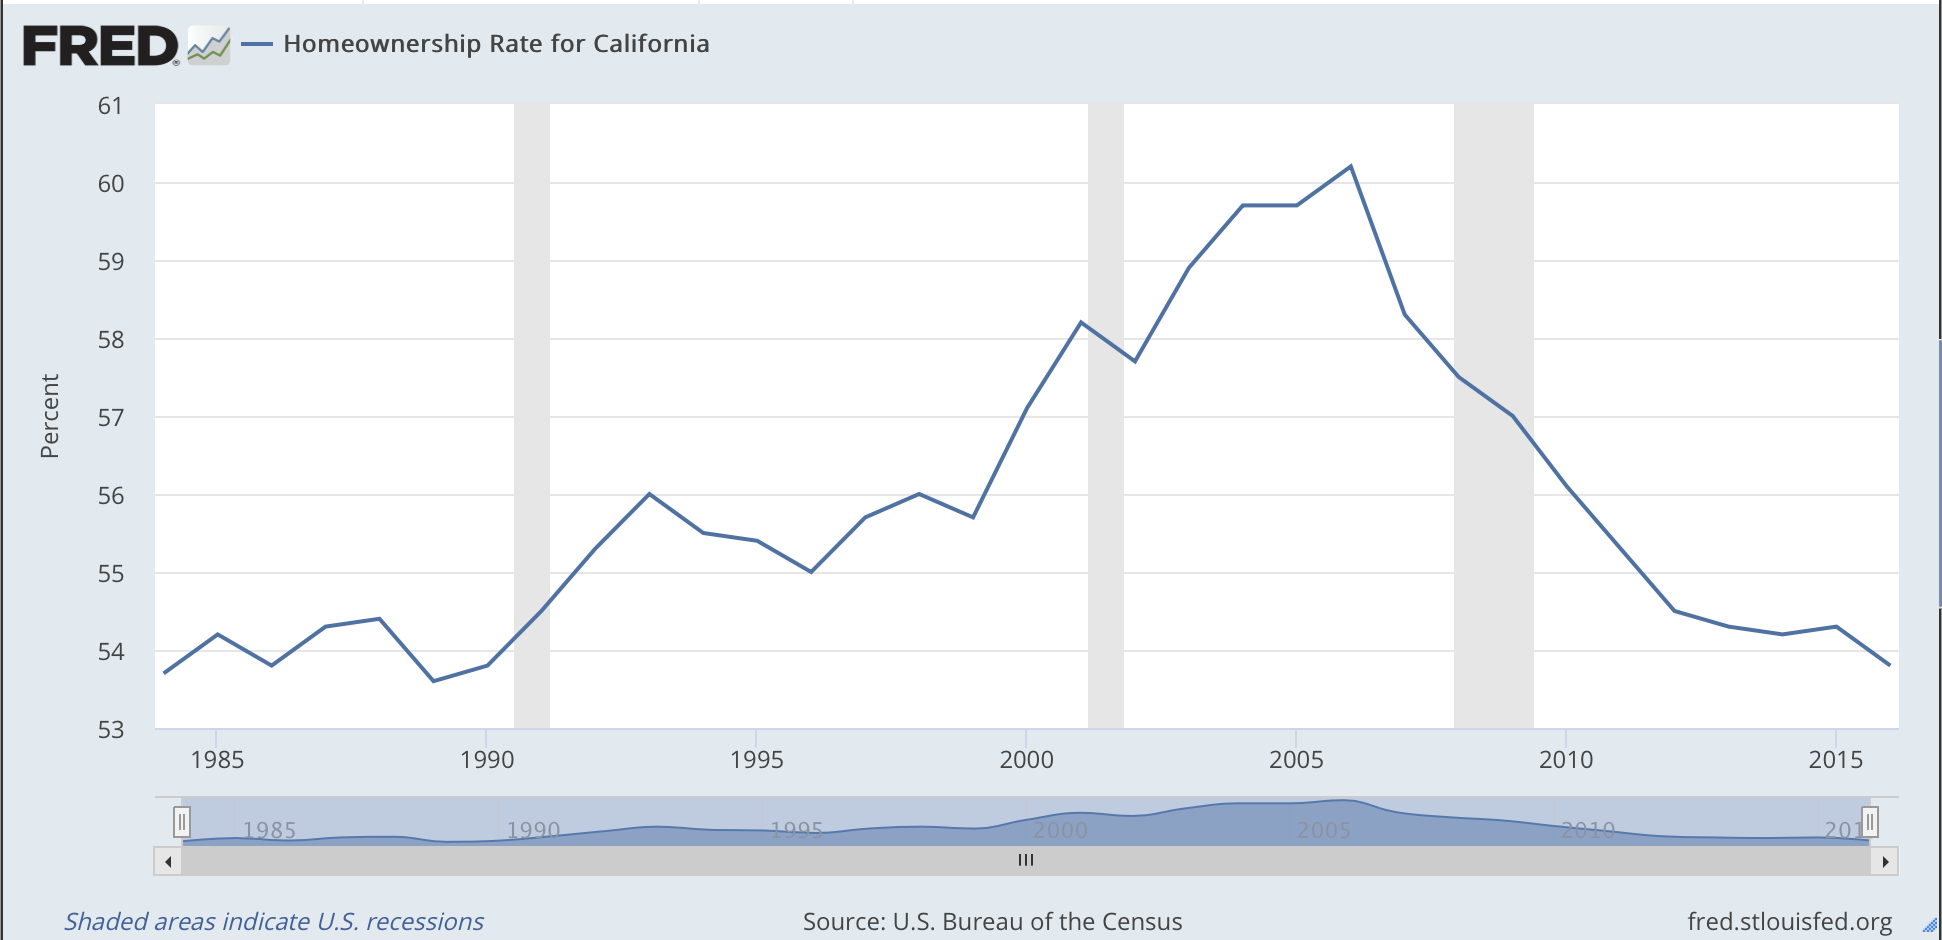
As of July 27, 2017, the rental vacancy rate was 7.3 percent, and the homeowner vacancy rate was 1.5 percent. These numbers have noticeably improved (decreased) since 2010. In fact, from 1995 to 2017, the rental vacancy rate hit its highest number in 2010, a 10.23 percent average in all four quarters. The homeowner vacancy rate was usually around 1.5 percent over that time span, but it obviously rose when the U.S. economy entered a recession in late 2007 and spiked close to 3 percent.

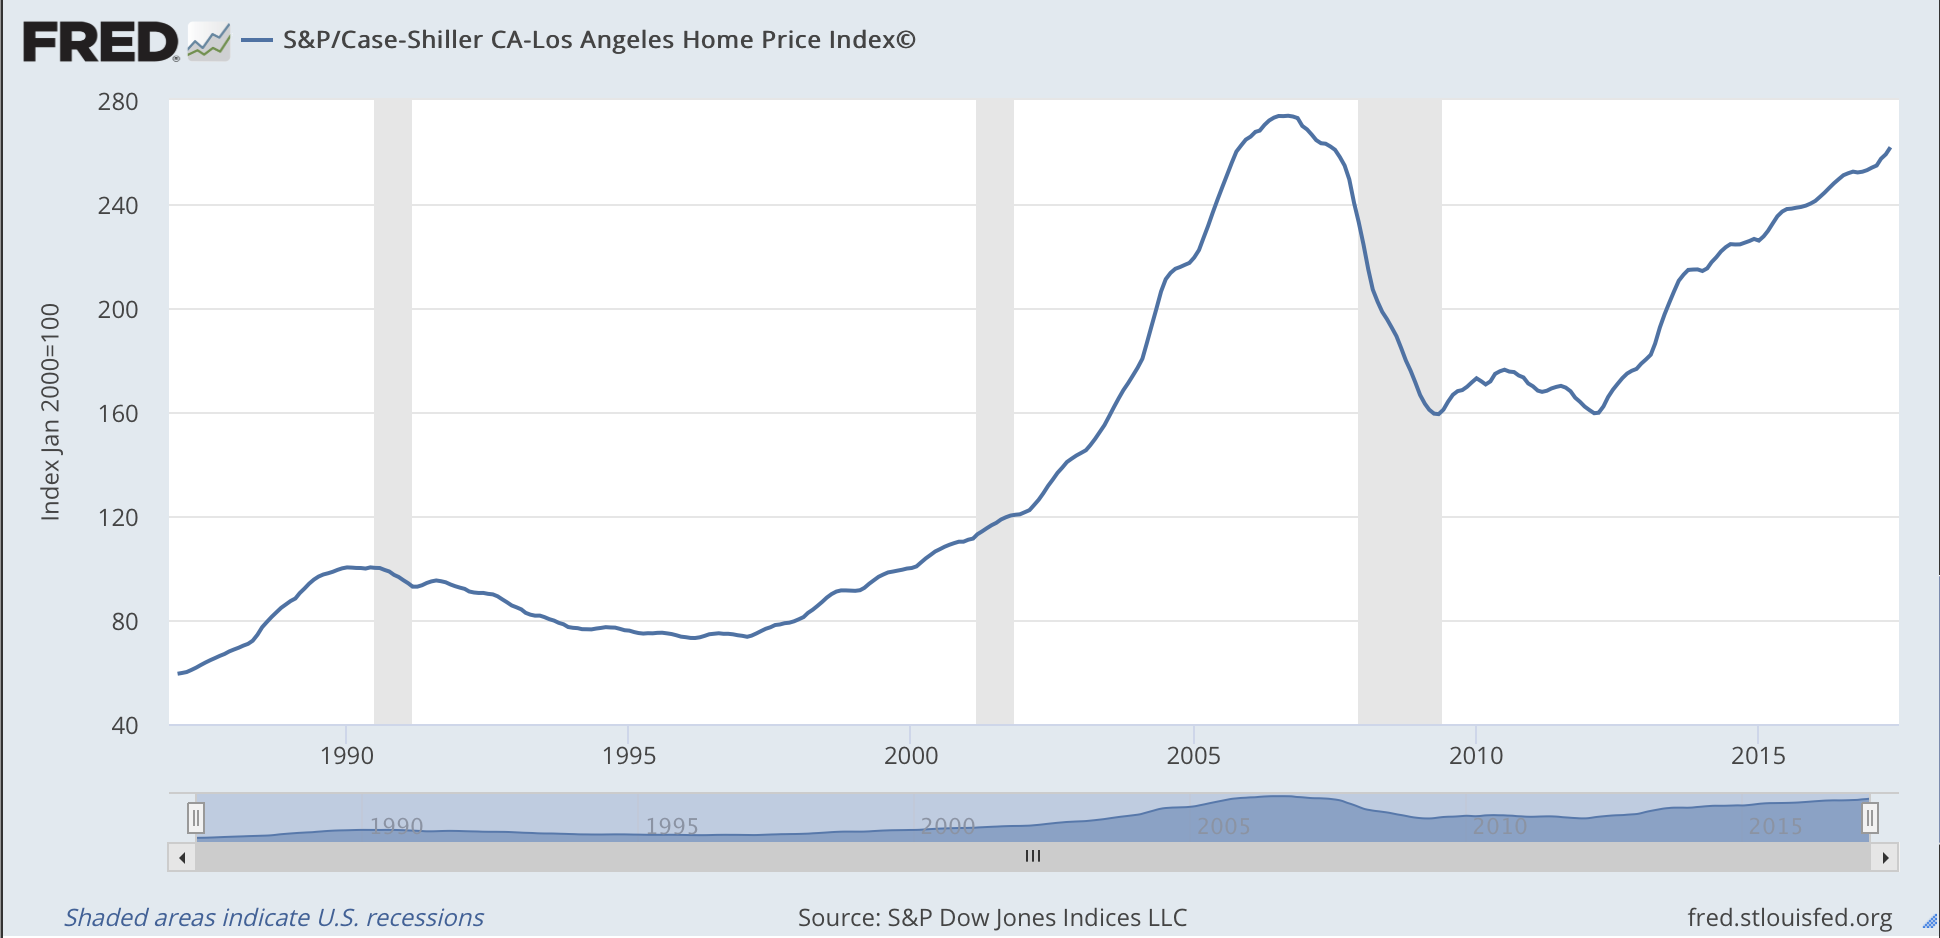
Since 1995, the rental and homeowner vacancy rates are able to stay more or less intact even though the median asking rent has continuously increased, while the median asking sales price for vacant houses can increase and decrease in somewhat of a cyclical fashion, falling when the prices get too high and outweigh demand. Via information from the United States Census Bureau, the median asking sales prices for vacant units climbed up to around $200,000 but began a steep decline once the 2007 recession arrived.

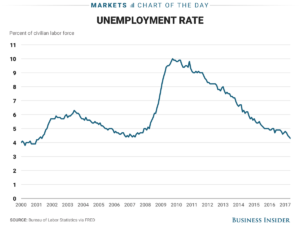
After leveling out for a few years, the median asking sales price has begun the upward trend again and, measured at $177,200 in the second quarter of 2017, is on pace to eclipse $200,000. Rental and homeowner vacancy rates can continue to stay low, but if the numbers compiled on the graphs of recent years tell us something, it’s that troughs follow peaks, even if skyrocketing prices and lower unemployment rates make the economy seem like it’s booming.

Rental and homeowner vacancy rates help describe important characteristics which define value in a marketplace: supply and demand. If more and more people are buying and renting houses, you’d expect the vacancy rates to be lower. In this case, the supply of housing is getting less and less, and the demand for housing is likely higher. Therefore, rental and home sales prices should increase, making the housing market unkind to a significant portion of regular people.

“The irony of the modern housing market is that the places where we are seeing wage growth are places where people can’t live because they are too un-affordable,” said Nela Richardson, chief economist at real estate brokerage Redfin, per Forbes.

Now, economists must deal with the possibility of housing prices becoming overinflated, as they hope for the market to stay stable over the next decade or two.

Social Media & the Economy

There are billions of social media users around the world, as this number continues to increase. In 2017, almost everything is, or can be, done over the Internet; whether it is wishing your cousin in Australia a Happy Birthday, spreading awareness about your lost dog, researching about why your stomach may be hurting, or even exposing your knowledge and credibility in your craft.

Most importantly, social media has played a huge role in revolutionizing the way businesses operate. Brands are now able to expose themselves right in front of your eyes no matter where you are.

You can be in bed, scrolling through your Facebook timeline, and potentially come across an advertisement that sparks your interest. After about 4 clicks, you can purchase that product and have it arrive at your doorstep as soon as the next day. More importantly, you just generated business for that company while you were in bed.

Businesses are able to use social media to learn more about themselves. Reviews, feedback, and consumer research has never been easier, allowing businesses to spend less money on what is not working and pump more money into what is. This is so important for businesses to pay attention to and utilize, because it is something that can potentially take your company to the next level.

This magical ability through the use of social media has sparked a new wave in the economy. Entrepreneurship is at its highest peak of popularity, because now you can legitimately operate your business from your living room – all you need is a laptop.

This has even impacted the decrease of the unemployment rate. The word “unemployment” has lost a lot of its weight, partially due to the easily accessible online market places; where you can buy and sell almost any item to make money.

“Freelancers” have also gained tremendous popularity with the rise of social media. Let’s say you had enough of your boss so you quit your job, but you haven’t found a job yet, or you recently got laid off and are in the middle of a job hunt: During this time, you can now list your skills and experiences online and find contract jobs to work on for money until you find another job. This may even work out better for you, and the autonomy could be the cherry on top!

Social media has really disrupted the economy – for the better. There is so much opportunity in the world, and the Internet has literally placed it right in front of your eyes.


References:

http://ageconsearch.umn.edu/bitstream/162500/2/SAEA%20Econ%20Impacts%20Paper%202014%20Submitted.pdf

https://www.theatlantic.com/technology/archive/2010/10/is-social-media-driving-the-economy/64780/

https://www.forbes.com/forbes/welcome/?toURL=https://www.forbes.com/sites/quora/2017/08/02/how-does-social-media-influence-the-economy/&refURL=https://www.google.com/&referrer=https://www.google.com/


Los Angeles rents soared as wages stagnated

Rent prices in Los Angeles County increased by nearly 15 percent over a recent period as wages remained unchanged, putting pressure on renters to find other ways to make ends meet or face potential homelessness.

The U.S. Census Bureau pegged the median household income in L.A. County at $56,196 in 2015, the most recent year for which data are available. That was virtually the same as in 2011, when that figure was $56,266 in inflation-adjusted 2015 dollars.

But over the same period, rental prices in the area shot up increasingly quickly. Rental website Zillow, which compiles nationwide home and rental data, found that the median monthly rent increased by 14.5 percent from the end of 2011 to the end of 2015.

That increase didn’t happen steadily. Instead, rents increased significantly in a short period of time. After remaining stable for a few years, the median rent in L.A. County increased rapidly in 2014 and 2015, with a peak year-over-year increase of 8.2 percent from June 2014 to June 2015.

Zillow’s rental index is calculated to reflect changes in the monthly median rent and account for fluctuations in the kinds of homes that are available to rent. This makes it suitable for comparisons, but individual data points are not a reliable indicator of median rent at the time.

It’s not obvious what led to soaring rents, but the trend has not slowed down. Zillow found that in July 2017, the median rent was more than 4 percent higher than a year earlier.

Official income data isn’t available after 2015, which makes it impossible to identify whether rent increases continue to outpace changes in income. Both the state of California and the city of Los Angeles have increased the minimum wage since 2015, to $10 and $12, respectively. Those minimums are set to increase to $15 in the coming years.

California’s statewide minimum wage had increased during the survey period before 2015, but those changes didn’t seem to affect the real dollars Angelenos could afford to spend after accounting for inflation. For example, the state minimum wage reached $9 per hour in July 2014, but the real median household income in L.A. County remained essentially unchanged.

The increase in rental costs might have had major impacts on individual lives. According to municipal government data, the number of homeless people in the Los Angeles area increased by 12 percent from 2013 to 2015, as rent prices increased dramatically.

That city and county data, compiled by the Los Angeles Homeless Services Authority, showed an increase in the total homeless count from 35,524 to 44,359 across the survey area, which did not include the cities of Long Beach or Glendale.

Though census income data isn’t available after 2015, continuing increases in rents and the numbers of homeless people suggest that this trend increased. The municipal governments’ 2017 homeless survey found that 55,188 people lived without homes in the L.A. area, an increase of 24.4 percent from 2015 and 55 percent from 2013.

Median rent has also continued to increase by sizable margins — it’s now 8 percent higher than in 2015 and 24 percent higher than in 2011, when the survey period began.

Trump’s Tweets and the Dow

President Trump’s recent election has been accompanied by many ups and downs for the United States, but in terms of the Dow Jones Industrial Average, the Trump administration has proved to be a healthy change. After the election, excitement around the new president’s policy promises caused the Dow to soar to record-breaking heights. It reached 22,000 even in the midst of unrest in the administration’s leadership according to CNN. It is interesting to note the disconnect between political turmoil and the Dow as of late. President Trump’s administration has set many precedents so far and one is the number of high-level advisors that have left the president’s side in such a short window of time. With that being said, the Dow has not been severely affected. The president continues to be its biggest cheerleader and tweets predictions about it as well. CNN notes that not only is this unheard of for a president to weigh in so frequently about the stock market, but to target the Dow specifically in his comments is new. This recent rhetoric surrounding the stock market is not only unprecedented, but it will not last. The market is constantly fluctuating and what goes up, must come down. It will be interesting to see how the new president reacts to the Dow going in the opposite direction. Will he remain outspoken or zip his lips? While we are all inclined to look at all of president Trump’s statements with a grain of salt, the Dow does actually indicate the economy is doing well. CNN Money questions if that the rise of the Dow is due to the new president’s pro-business agenda or lasting effects of President Obama’s rule? We will never know. Nonetheless, confidence is high in the stock market since the election in 2016 and as an economic indicator, the Dow is providing no need to worry about the market’s health. What is on the horizon though, is the reality that the stock market is a malleable entity and it will fluctuate. Confidence and campaign promises are keeping the Dow in an upward rise these days and despite threats of Russian probes and potential for a missile attack from North Korea, the stock market has remained stable for the most part. Stay tuned for more updates on the continuing saga of an interesting correlation between a rocky administration and a unique rise of the Dow Jones Industrial Average in next week’s edition of “Trump’s Tweets.”


Sources: http://money.cnn.com/2017/07/20/investing/trump-wall-street-stock-market-record/index.html

http://money.cnn.com/2017/08/02/investing/dow-22000-trump-apple-wall-street/index.html

http://www.marketwatch.com/story/trump-tweet-shows-hes-a-dow-jones-industrial-average-man-2017-08-01

California’s housing crisis: What gives?

It’s no new news that California is experiencing a housing crisis. Just how bad the crisis is might surprise you.

The San Jose Mercury News published an in-depth investigation into the current crisis and finally answered the question: “What gives?” and most importantly “What’s next?”

Home ownership in California is at an all-time low since World War II. The average home price is 2.5 times higher than the average price nationally. With a median cost of around $437,000 more and more people are choosing to rent instead of buy.

While renting may seem like the better option it still takes a toll on residents as nearly 70 percent of poor Californians see most of their paychecks go to constantly rising rent. Couple the cost of rent with student loan debt and you have a crisis.

It can be said that while rent is infinitely more expensive in California than other places, residents are still getting paid more. This is indeed true, however, hidden within the truth is the fact that income has not kept pace with rising home costs.

This large income inequality has led many to move out of California, namely those living on the poverty line. From 2000-2015 800,000 residents have moved out of California to other states including Texas. The average income for the thousands that left in 2007 was $50,000.

Those who choose to tough it out and stay in California often become homeless. Between 2015 and 2016, California saw an uptick in homelessness of about 2,400 people. Housing data website, Zillow estimates that a 5% rent increase in Los Angeles would result in an additional 2,000 homeless people. So far rent has increased 4%.

The study found that such a crisis has large repercussions on the economy as a whole. The McKinsey Global Institute found such crisis cost the economy between $143 billion and $233 billion annually.

So how can California fix its problem before the bubble bursts? The state will once again tackle its long-awaited housing package again this month. While help may be on the way it won’t fix the problem entirely. According to the Legislative Analysts Office, helping the 1.7 million poorest residents would cost around $15 billion at the very least. The Los Angeles times estimates that of the three bills being considered only 25% of that estimation would be provided.

What is Consumer Sentiment?

Believe it or not, your opinions count! Your views regarding the health of the economy, long-term economic growth and your personal financial situation play a role in shaping public policy, economic policy and stock markets. You are, essentially, an economic indicator, according to the University of Michigan. Feeling special now?

Consumer sentiment is a measurement of the overall health of the economy, determined by consumer opinion. It directly relates to the strength of consumer spending. The University of Michigan’s Michigan Consumer Sentiment Index (MSCI) is the most popular publications of consumer sentiment. American households are contacted randomly each month via telephone. Here, the chosen ones are asked about their financial situation and attitudes about the economy.

The Force, aka. The University of Michigan, releases the final report of the previous month on the first of the next month. Basically, the index is useful to economists because it gives a snapshot of whether consumers feel like spending. Yep, Leo… We’ve all been there at Chipotle.

Inflation and favorable employment conditions are what give consumers the urge to spend. But, current events also affect how much we spend. Things like bull and bear markets, and geopolitical events.

Why are economists dying to know what consumers are up? Because consumer spending accounts for more than two-thirds of the economy. This is, basically, real-life Gossip Girl… your one and only source into the financial activities of America’s citizenry. Where have they been? And what have they been up to? Who knows? You know you love me, xoxo… the economy. So, the more confident consumers are about their finances and the economy, the more likely they are to spend.

The MCSI is determined by subtracting the percentage of unfavorable consumer responses from the percentage of favorable ones. It is calculated based on the following five core survey questions:

  1. Compare the pair – Would you say that you are better or worse off financially than you were a year ago?
  2. After some crystal ball gazing – Do you think a year from now you will be better off financially, worse off, or about the same as now?
  3. Now, let’s get down to business – As a nation, do you think the next 12-months will be financially good or bad?
  4. Back to the future – What would you say is more likely: the country, as a whole, having a good five-years or so, or periods of widespread unemployment / depression?
  5. To spend or not to spend? Do you think it’s a good or bad time to buy major household items, such as furniture, refrigerator television etc.

After the relative scores have been worked out, and the actual equation of CSI = x1 + x2 + x3 + x4 + x5 / 6.7558 + 2.0 has been left in the school hallway for the Will Huntings of the world to work out, we have the CSI!

And there we have it – the MCSI – one of the leading indicators of consumer sentiment in the United States.


References

Investopedia 1

Investopedia 2

Economic Calendar

One Rate Does Not Make a Summer, But May Indicate a Mild Fall

It is almost the end of August and this summer seems to have brought positive news to both the U.S. and European markets. The latter especially may now breathe a sigh of relief since, as the Wall Street Journal reported on Aug. 24, 2017, even the weakest European economies such as the Greek, the Portuguese, and the Spanish have been showing growth over the last year. Along with them, the Italian economy seems to be enjoying a substantial reversal in its usual downward trend, as shown by the steady decrease of the unemployment rate released by Istat, the Italian National Institute of Statistics, on June 7.

These developments are being reported just as the Federal Reserve’s annual conference is taking place in Jackson Hole, Wyoming, where Mario Draghi, president of the European Central Bank, and Janet L. Yellen, the Federal Reserve chairwoman, will speak about the future of the European and U.S. monetary policies for the year to come. Their speeches will focus on whether the current lenient regulations will be removed.

The decision on this very hot topic—appropriate for the end of summer—might affect the improvements shown by the delicate economies of the Eurozone, such as Italy’s, which has been reinvigorated by the positive unemployment and employment figures released in June 2017.

Why do these rates matter? Even though they are mere numbers, they stand for people; people who have been struggling to find jobs. As reported by the Italian business newspaper Il Sole24ore,  the unemployment rate decreased 0.2 percent from May to June of 2017, and has settled at the level of fall 2012—when Italy reached its lowest unemployment rate. This news has created confidence among markets, entrepreneurs, and investors.

The recovery of Italy’s economy was also reported by Quartz and Bloomberg this month; these two media outlets showed that the Italian GDP increased by 0.4 percent in the last quarter, thanks to added value of manufacturing and services, as Lorenzo Totaro wrote on Aug. 16, 2017, on Bloomberg; this GDP increase reflects the larger number of employed people.

These indicators have also revealed another interesting aspect of the story: the employment rate of the female population has increased by 0.7 percent from June 2016 to June 2017, reaching the threshold of 48.8 percent. Women are more likely to be unemployed in Italy; this upturn signals a great change in the economy of the country.

In this scenario of mild recovery and optimism, the decision of whether to pull back the current stimulating monetary policy is very important for a country such as Italy, whose policies and efforts seem to be heading in the right direction. Certainly, as recently stated by Carlo Calenda, minister for economic development, and Ignazio Visco, governor of the Bank of Italy, the improvements observed through the lenses of economic indicators such as the GDP or the unemployment and employment rates do not mean that Italy has completely recovered from its financial crisis (Corriere della Sera, Aug. 24, 2017); the country still needs reforms to encourage business innovation, and support the work life of employees.

“For the first time in ten years all the major economies of the planet are growing,” (Marketplace, Aug. 24, 2017) and what might happen to Italy after the Federal Reserve’s annual conference concerns European countries as well as the U.S. We have to wait to see if this new wave of economic growth will be fostered and advanced by the new regulations that will be implemented by Mr. Draghi and Ms. Yellen at Jackson Hole. All we know now is that the enthusiasm about Italy’s steady growth is based on solid facts, and it is part of a remarkable turnover regarding the entire Eurozone.

Unemployment Rate Forecast; source: tradingeconomics.com/italy/unemployed-persons/forecast


Here’s One Way to Measure How People are Doing Financially

Gross domestic product growth can provide valuable information about the health of a nation’s economy, but it rarely goes any deeper than that broad lens. Disposable personal income is one way to indicate how people are doing on a more narrow level.

Disposable personal income is a measure of how much money families have once taxes are deducted from their paycheck. Disposable personal income is usually displayed in billions of dollars.

Disposable personal income shows how much people have left over, not just what they spent. If consumption is low but disposable personal is high it could mean people are putting more money towards necessities and/or saving.

This metric can also be compared to other indicators, like food prices, to determine what percentage of a person’s disposable personal income is being spent on necessities.

The USA Today said in a recent article that people are spending almost half of what they used to on food, which may mean that they are spending more of a percentage of their disposable personal income on other necessities, like housing and healthcare.

Disposable personal income has been on a steady upward trend since 1960 and before the great recession between 2008-2009 it briefly spiked from 10.8 trillion to 11.4 trillion (numbers adjusted for inflation). During the recession disposable personal income contracted.

Disposable personal income since 1960.

Since the recession, the trend moved upward, and in 2012 reached a sudden peak of 13 trillion. More recently, in 2017 disposable personal income contracted by around 4 billion.

Disposable personal income in 2016 – 2017.

2017’s lower numbers could account for stagnant wages, higher taxes and a number of other things.

Disposable personal income is a helpful economic indicator because it can be compared easily to other indicators and shows how the average person is doing in the economy. But as it is in the aggregate it leaves economic inequality out of the picture.

The Economic Resilience of the Movies

In 2008 when much of the economy was in decline and unemployment was on the rise, the movie industry had a happier story to tell.

In during the great recession in 2007 and 2008, instead of seeing a sharp decline in movie ticket purchases there was instead there was minimal change. Movie ticket sales and the health of our economy are not correlated and therefore box office performance is not a good indicator of the state of our economy.

The box offices’ struggles are not aligned with the rest of the economy. In away they are immune from traditional market down turns.

At first glance, the film industry doing well doing a recession seems counterintuitive. Entertainment is generally seen as an extra budget item that would be cut when money is tighter. However, the movies are like an escape from the real world. When times are tough people can take refuge in the world of the movies. Therefore, the film industry instead of experiencing a slump during the recession it continued to succeed.

The top grossing films of 2007 and 2008 were Spider-Man 3 and The Dark Knight respectively. Both films provide an element of fantasy and heroism. They have the ability to transport the viewer to a different world, one that isn’t their economically dim reality. They gave an escape people craved.

Box office sales did not take a major hit during the great recession, however, they have been hit with a subtle decline in recent history. According to The Numbers, the peak of movie ticket sales was 2002 when approximately 1.5 billion tickets were sold. That is almost 200 million more tickets sold than in 2016.

The decline in box office sales could be a reflection of the changing economy of how we watch movies. There has been a trend towards watching movies at home rather than in theaters. A 2006 Pew Research study found that 75% of Americans would rather watch a movie at home than in a theater up from 67% in 1995. The Pew study is supported by a 2015 CBS News poll which found that a majority of Americans preferred watching movies at home and 84% of Americans watch more movies at home than in theaters

One of the factors in declining movie theater ticket sales is online streaming, with Netflix being the biggest player in the streaming field. In the same time period where movie ticket sales have been declining Netflix has been expanding its subscriber base. Netflix has gone from almost 7.5million subscribers in 2007 to almost 100 million domestic and international subscribers, according to Business Insider and Statista.

The movie industry has been for the most part immune to the ups and downs of the economy. Box office sales are not the key to unlocking the health of the economy, rather they tell us something about the psyche of the nation. Even when times are tough we crave the escapism that the movies provide. Through the ups and downs of the economy, the movies have proved to be resilient.


Sources: 

The Numbers 

Business Insider 

Fortune 

Pew Research

CBS News

Disney: The Monopoly of All Monopolies

In July of 1955, the magic of Disneyland began with the first theme park opening in Anaheim, California. Sixty-one years later, Disney parks and resorts dominate the tourism industry inside and out of America. Every movie and TV show is the perfect opportunity to bring children’s favorite characters to life right in the park. Disney theme parks would not be nearly as lucrative without cashing out on gift shop souvenirs, as screaming children beg their parents to buy them a plush, pet-sized Olaf. The opening of Disneyworld in Orlando, Florida and its booming success has lead to Disney theme parks crossing borders to Paris, Tokyo, Hong Kong, and Shanghai (and that isn’t even including all the resorts.)

Not only does Disney dominate in tourism (Disney runs the world,) their presence in all things entertainment such as media and cable networking is undeniable.  However, with the subscription and viewing issues at ESPN, the historically stable company is facing unforeseen challenges.

It is no secret that America’s patience with cable is slowly dwindling, but no one knows this better than ESPN. Nielsen Cable confirmed the alarming loss of subscribers for November 2016 was 621,000, and a drop in revenue of over $52 million. Don’t try to do the math for 2016 as a whole. Long story short, its pretty painful.

The question is will ESPN put Disney at long-term risk? Although shareholders aren’t exactly fleeing anytime soon, we have to consider how the future of cable will affect the company as a whole. Disney may be too big to fail in many people’s eyes, as the popularity of Disney’s parks, resorts, and studio entertainment will not wane anytime soon. Despite this, looking at the impact Disney parks and resorts have on the economy is important to understand how much could be lost if Disney earnings continue to slow down (the thrilling exploration of quarterly earning reports will take place to further understand this.)

Disney’s effect on the urban economy in Anaheim and Orlando

The Disneyland Resort in Anaheim has undoubtedly changed the economy of the surrounding city (Disneyland Resort includes Disneyland and Disney California Adventure, Downtown Disney, and three hotels.) In fact, Disneyland is one of the reasons for Southern California’s economic success. An economic impact study was conducted by Arduin, Laffer & Moore Econometrics (ALME) which revealed that $5.7 billion is generated annually for Southern California’s economy. Additionally, the Disneyland Resort contributes $370 million in state and local taxes. The employment statistics are equally impressive The study was based on fiscal 2013 data, so these numbers may be higher today. Employment is also positively impacted with 28,000 employed and 25,000 jobs created indirectly due to the company. Disneyland Resort’s employment rate has grown at 34% which is faster than California’s 6.7% rate (from 2009-2013.) As you can see, Disneyland dominates Anaheim, one-third of Orange County’s tourism profits being linked to them.

The opening of Disney World Resorts shaped the future of Central Florida. Before Disney, the area was far from a popular destination. As of 2015, there are an estimated 67.8 million visitors to all theme parks combined (which includes Magic Kingdom, EPCOT, Hollywood Studios, Animal Kingdom, Typhoon Lagoon, and Blizzard Beach.) Compared to Disneyland and California Adventures combined 27.7 million visitors, that is a huge difference. It shouldn’t be too surprising then that Disney dominates this urban economy as well. According to a study conducted by Fishkind and Associates, Disney World is responsible for generating an estimated $18.2 billion annually and 1 in 50 jobs in the state are linked to the company. The 161,000 jobs linked to Disney World along with $900 million spent paying Florida vendors is equally noteworthy if not more. This study was based on fiscal 2009 data, so its impact since then has surely increased.

If it is not already apparent, Disney has a huge impact on local economies.  Disney pumps money into these areas by attracting so many visitors who end up spending money outside of the parks themselves. Job growth and tax revenue are equally as important if not more to keep the system growing. This economic growth positively impacts the U.S. and makes us more appealing to international travelers. In fact, the multitude of park and resort locations have not dissuaded international Disney fanatics from coming to the states, as it gives the incentive for true fans to accept the challenge of visiting all parks and resorts. According to a fellow anonymous Trojan who works as a performer at Disneyland Anaheim, “true Disney fans will stop at nothing to come to the parks. Some annual pass holders come every day! And a lot of the time I get to meet so many international kids it’s crazy.”

The fact is cities like Anaheim and Orlando were created by Disney, for Disney. If Disney begins to falter then so do these cities as they are all almost too reliant on each other at this point in time. To show this, it is now time to play the numbers game.

Disney as a whole

As Disney expands, it is unrealistic to expect every quarter to be a slam dunk. Additionally, increase or decrease in attendance, revenue, and profit has a lot to do with the season in tourism. Disney’s best profit time of the year is during the most wonderful time of the year: Christmas. Other factors come into play such as unforeseen events. For example, the Charlie Hebdo attacks in 2014 along with the terrorist attacks in 2015 during Bastille Day and in November decreased attendance at Disneyland Paris. No one wants to put their entire family at risk after a tragic event like that. Therefore, there was a 10% drop in guests and 7% drop in revenue this past year.

The fourth quarter for Disney as a whole was a shock compared to past years, and even compared to the third quarter. The third quarter generally had a trend of increased revenue and income, with a 6% increase in revenue for parks and resorts and 8% increase in profit. On the other hand, the fourth quarter resulted in a decrease across the board.

Fourth Quarter and Full Year Earnings for Fiscal Year 2016 https://ditm-twdc-us.storage.googleapis.com/q4-fy16-earnings.pdf

As shown above, revenues were down 3% from $13.5 million to $13.1 million, and operating income was down 10%, from $3.5 million to $3.1 million.

Looking at revenues for parks and resorts, there was only a 1% increase from $4,361 billion to $4,386 billion. Operating income was down 5% from $738 million to $699 million. The report attributes lower operating income to lower turnout at Disneyland Paris and Hong Kong, but this is offset by the opening of Shanghai. Long story short, Disney always has an answer for concerning numbers.

The true reason for decreased revenue and income is largely connected with cable networks. Media networks revenue was down by 3% from $5,826 billion to $5,658 billion, and operating income down by 8% from $1,819 billion to $1,672 billion. Revenue for Cable Networks decreased by 7%, and operating income at Cable Networks decreased by $207 million to $1.4 billion (from $1.6 billion.) This is linked to both ESPN and Disney Channels.

ESPN is bleeding money

Decreased revenue is primarily due to ESPN, as the loss of subscribers in November alone was 621,000. According to Market Realist and Nielsen Cable projections, from 2013 to 2015, 7 million subscribers have been lost. 

The issue is the expense of ESPN. At roughly $7 a month, you end up paying around $80 a year. However, owning as many sports rights as ESPN has is truly that expensive. But customers don’t really care about that they just want their sports!According to Disney, this quarter resulted in lower income from ESPN specifically due to “lower advertising and affiliate revenue and higher programming and production costs” Ironically, during their third quarter press conference, it was the complete opposite wording with

According to Disney, this quarter resulted in lower income from ESPN specifically due to “lower advertising and affiliate revenue and higher programming and production costs” Ironically, during their third quarter press conference, it was the complete opposite wording with “higher advertising and affiliate revenue” to explain the “nice operating income growth” of 1%. I see what you did there Disney, but no one is fooled (but seriously what is that plug-in statement code for/what does it really mean?)

During their press conference back in August, Disney said they are optimistic that subscriptions would slowly trickle back in. To combat loss of subscribers, they are pairing up with BAMTech to allow future streaming. The licensing rights of BAMTech include MLB and NHL which will bring more viewers. Bob Iger claims the goal is to provide a complimentary service to what ESPN already has, by creating streaming access for the sports that are not currently on the channels. This includes college sports, basketball, tennis and so on. Although no cable subscription is necessary to watch this new ESPN streaming service, the catch is the channels already available on ESPN will not be viewable through this service.

To me, this idea may work for in the short term to bring people in, but it will further frustrate customers and be counterproductive to not be able to fully stream all ESPN channels. However, Iger also feels that more subscribers can be brought in through Direct TV’s Sling TV, which is only $20 a month and includes all the ESPN channels a sports fan needs. Perhaps this will work, but this would require more incentives to join Direct TV and every region in America has a different cable monopoly (for example Comcast is your only viable option in Marin County in Northern Calfornia.)

How ESPN aka the former cash cow of Disney may affect theme parks

You may be wondering how all of this connects. Logically, every component of business matters but how much impact could the decline of ESPN have on theme parks and resorts? Before streaming programs changed the game, ESPN was the be all and end all of Disney profits. The money has been pouring in ever since being acquired through ABC back in 1995. According to the annual report of 2014, ESPN brought in $6.8 billion in operating profit or 46% of the company’s total. Cable networks overall contributed to 34% of Disney’s revenue. Wells Fargo Securities analyst Marci Ryvicker estimated back in November 2015 that $700 million in fee revenue and $200 million in earnings would be lost due to the loss of subscribers (3 million at the time.)

All of this is problematic because if there are less corporate funds, then there are fewer funds to open new attractions within existing theme parks, along with taking the possibility away of expanding further (but does anyone really need another Disney theme park, I think not.)

Additionally, if the stock price begins to drop significantly, investors pulling out is never a pretty sight. You can even say ESPN is potentially holding back Disney’s stock price from growing as the headlines of “millions of subscribers lost” doesn’t help anyone.

Overall, what we’ve learned here (and probably already knew) is everything within Disney is deeply intertwined. The theme parks and resorts simply cannot succeed without the funds to maintain upkeep and periodically upgrade them. I believe that the current business model for ESPN will not be successful or beneficial past 2020. Streaming is taking over as it is, and although families will continue to buy cable packages for a long time, nothing is permanent in this technological world. It may be time for Disney to sell ESPN to Comcast or AT&T and let someone else face the backlash. In fact, if subscribers do increase as Iger predicts, it would not be a hard sell to another cable company to take on the project. Since Disney theme parks and resorts are such an important part of the domestic economy (if I had discussed the world market as well this would be overwhelming) sacrificing the most traditional and magical component of Disney is not worth it. Disney’s history all ties back into the mini economies of Anaheim and Orlando (and the rest of Florida) and therefore prolonging their well-being is not negotiable.

Disney Parks and Resorts Research

https://smartasset.com/credit-cards/the-economics-of-disney-world

https://ditm-twdc-us.storage.googleapis.com/q3_fy16_earnings_transcript.pdf

http://www.usatoday.com/story/money/2016/08/09/disneys-q3-income-up-5-theme-parks-film-studio-gains/88483996/

https://blog.shermanstravel.com/2014/8-major-differences-between-walt-disney-world-and-disneyland/

http://www.ocregister.com/articles/study-665882-resort-disneyland.html

https://publicaffairs.disneyland.com/disneyland-resort-generates-5-7-billion-for-southern-california-economy-2/

http://www.broadcastingcable.com/news/currency/disney-ceo-bullish-espns-future/161076

http://www.broadcastingcable.com/news/currency/disney-earnings-suffer-espn-declines/161072

https://finance.yahoo.com/quote/dis?ltr=1

http://marketrealist.com/2016/03/disney-believes-espn-will-start-gaining-subscribers/

http://www.heritage.org/research/reports/2011/07/what-is-poverty

https://en.wikipedia.org/wiki/List_of_assets_owned_by_Disney#Walt_Disney_Parks_and_Resorts

https://www.bloomberg.com/news/articles/2015-11-27/espn-viewer-losses-add-to-angst-for-disney-s-big-profit-engine

Disney Quarterly Reports

https://thewaltdisneycompany.com/disneys-q3-fy16-earnings-results-webcast/

https://ditm-twdc-us.storage.googleapis.com/q1-fy16-earnings.pdf

https://ditm-twdc-us.storage.googleapis.com/q2_fy16_earnings.pdf

https://ditm-twdc-us.storage.googleapis.com/q3-fy16-earnings.pdf

https://ditm-twdc-us.storage.googleapis.com/q4-fy16-earnings.pdf