Blue Apron’s Bust

To date, 18+ investors have put $199,400,000 into a company they believed would disrupt the world. In a pre-IPO regulatory filing, the company said it could be worth $3 billion, pricing shares at a range of $15-$17 and making it a unicorn. More recently, though, one of the co-founders stepped down as CEO, the company’s market value is $714.59 million, and as of December 5, 2017, at 6:26 pm EST, those highly-anticipated common shares are worth a measly $3.76.

Blue Apron was once a highly sought after and heavily funded food and beverage startup. Now, it’s the most recent company to go down in a string of failed initial public offerings. So, what happened?

In 2012, chef Matt Wadiak connected with Harvard MBA Matt Salzberg and engineer Ilia Papas, a duo looking to launch a food startup. In August of that same year, the three began hand-boxing ingredients, the first version of their product, in Wadiak’s New York City apartment. They shipped to their 20 closest friends and family members and found vast success.

The idea, and the company, took off. In February of 2013, Blue Apron received $3 million of funding in its Series A round. Series A follows seed capital, the initial funding round that raises cash for market research and business development. Blue Apron received $800,000 in its seed round from angel investors Traveon Rogers, Jason Finger, and James Moran. Angel investors “are affluent individuals who inject capital for startups in exchange for ownership equity or convertible debt” (convertible debt is a bond that the holder can either convert to shares in the company or cash out at the equivalent amount). These three investors–a football player and two entrepreneurs–saw something in Wadiak, Salzberg, and Papas. They invested in the founders themselves and an idea that could confront an industry ripe for disruption: food.

The hefty $3 million from Series A financed the optimization of Blue Apron’s product–meal-kit deliveries–and user base, growing the number of subscribers much higher than those first twenty friends and family members. This round saw action from Greycroft Ventures, Graph Ventures, First Round Capital, BoxGroup, and Bessemer Venture Partners, all of which are venture capital firms.

Venture capital has a relatively short history. In America, companies were originally funded heavily by debt. This began to shift in 1811, when New York established limited-liability laws, making it so that shareholders wouldn’t be held liable if companies went bankrupt. These new laws, in addition to the development of information systems that reliably report the status of a company to potential investors, are what allowed funding via equity to come to fruition. Railroad companies were some of the first companies to be funded by equity. Since their shares were tied to tangible assets–trains, train tracks, etc.–people were more keen to invest in them because they could always sell these assets as direct materials if the company itself went bankrupt (Salon).

Henry Goldman (yes, relation to Goldman Sachs) next introduced a way to underwrite securities for companies without tangible assets like railway cars, deriving market value from a company’s earning power. Goldman’s valuation process was used mainly for merchandise and retail companies. Tech companies couldn’t borrow from banks or raise capital because people didn’t know how to value them or if they were reliable companies. Thus, private equity was born. These tech companies were too high risk for the typical methods of funding, so they turned to private, wealthy individuals (Salon).

The invention and mainstream adoption of personal computers ignited an explosion of startup companies seeking venture capital to fund their early growth stages. Venture capital is special because it mainly funds new companies and ventures who are looking to raise early stage funding. This type of investing can be done by individuals (Angel investors), investment banks, or other firms, funds, or financial institutions. VC can yield extremely high returns, but is also very high risk.

The venture capital phenomenon gained even more traction with the invention of the internet, ultimately leading to the formation of a dot com bubble. Venture capitalists were investing millions of dollars in any company that ended in .com. These new internet companies, however, wouldn’t produce earnings or profits for several years, so their valuations were based purely on speculation.

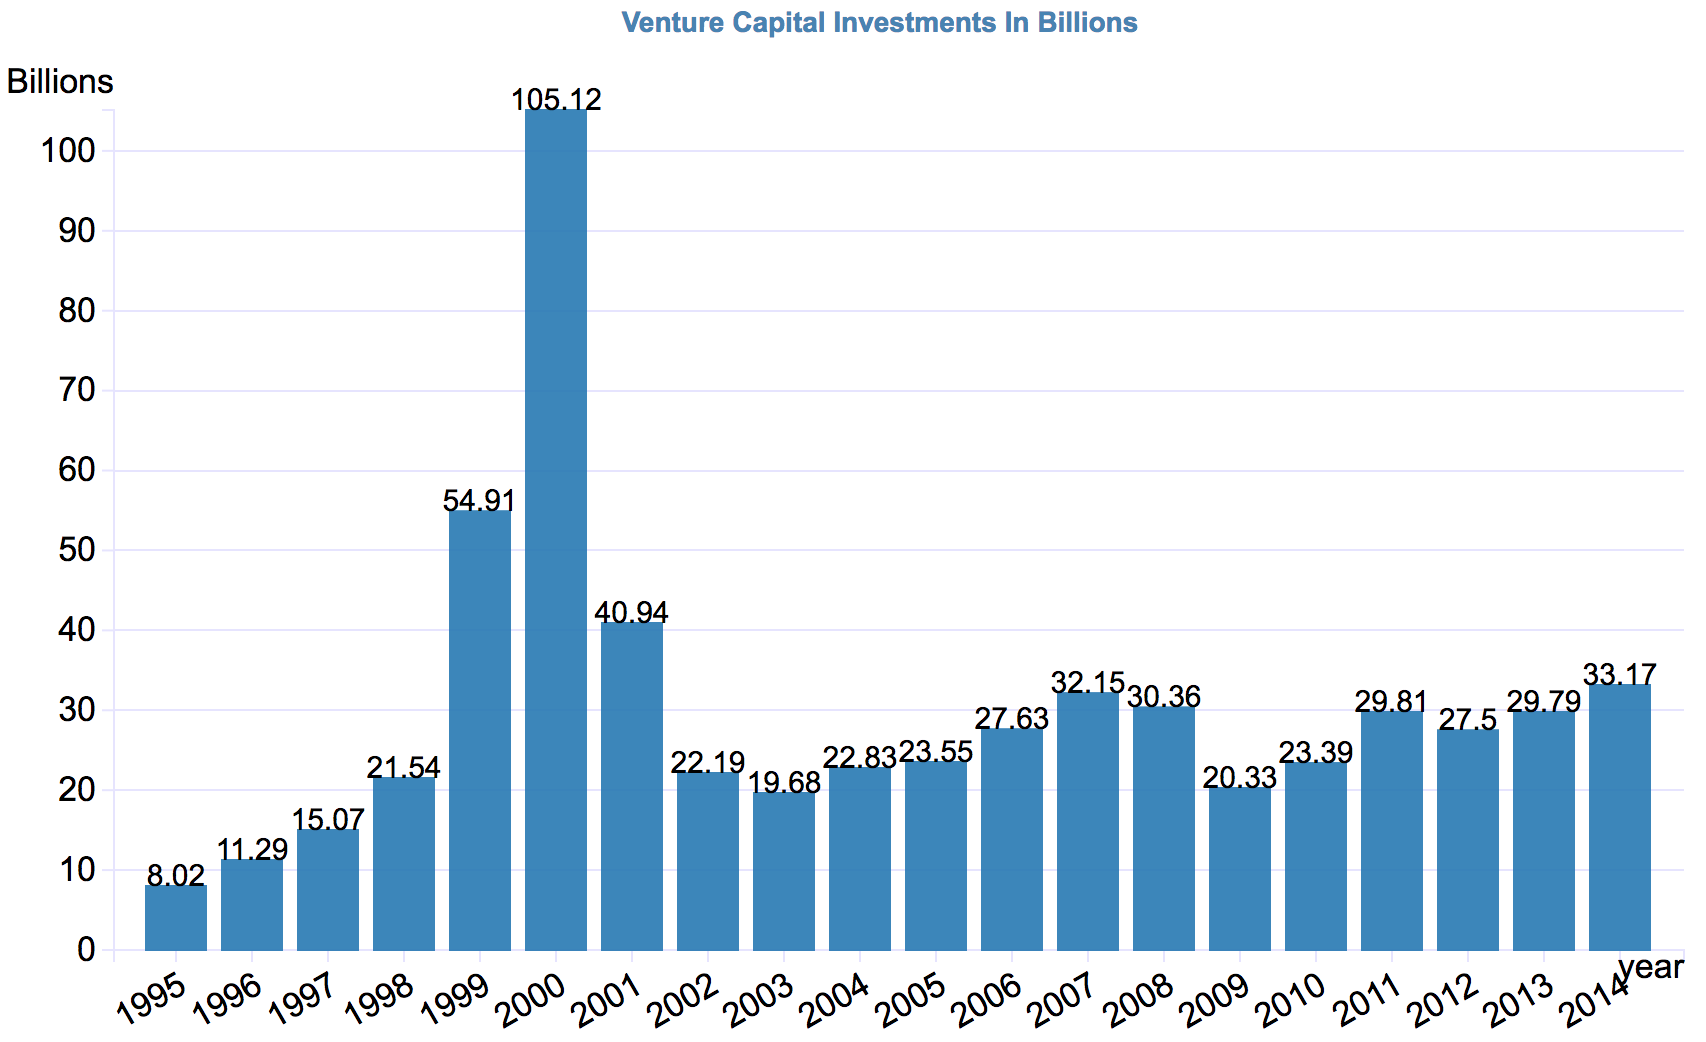
Graph: Data Science Central

As seen in the graph, U.S. venture capital investments reached an insane high of over $106 billion in 2000. The following year, 2001, is when the dot com bubble burst. These highly speculated and overvalued internet companies could not meet the expectations of the VCs who owned equity in them, and eventually they tanked. Trillions of dollars of venture capital funding went under. The landscape since has recovered, yet in recent years has started to see an uptick.

In 2016, $69.1 billion of venture capital was invested across 7,751 companies (NVCA). Blue Apron actually skipped funding efforts that year, as it was anticipating going public. The company received their $3 million Series A funding (mentioned earlier) in early 2013, only to be met with another $5 million from Series B later that summer. The next year, 2014, brought $50 million in Series C, and the year after $135 million for Series D. At this point in time, October of 2016, Blue Apron was set to do more than $1 billion in annual revenue and was preparing to IPO. As reported in the unaudited income statement provided in Blue Apron’s 2017 Q2 Earnings Statement, Blue Apron did $482,900,000 in revenue in the six months ended June 30, 2017, which was up from 2016’s $374,022,000, but not close to being on track to make the projected $1 billion in a year. Once again the question arises, what happened?

Chris Dixon, of prominent VC firm Andreessen Horowitz, applies something called the Babe Ruth Effect to venture capital. Babe Ruth, an American baseball player, frequently struck out while at bat. However, when he did hit the ball, he broke several batting records. Typically used in gambling and statistical logic, the Babe Ruth Effect explains that in venture capital, a few big hits are what often “return the fund.” VC investors will bet frequently on new ventures, of which only a few, or one, will have success of any magnitude. In fact, 80% of returns come from only 20% of the deals (CB Insights). This follows a power law distribution. Most people expect companies and their returns to fall somewhat linear in rank v. return. In reality, the graph looks very different from this expectation. The highest ranked company typically performs exponentially better than the second highest, and so on and so forth.

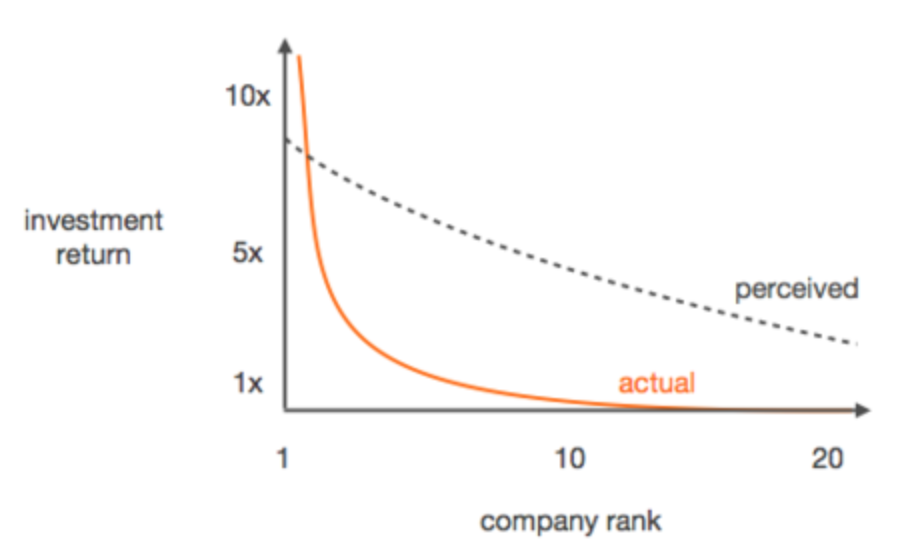
Graph: Michael Dempsey, Compound VC

Power law distribution is prevalent in venture capital, as it is also seen across unicorn companies (startup companies valued at over $1 billion). When 100+ unicorn companies are ranked from highest to lowest valuation, a cluster of values dominates at one tail-end of the graph.

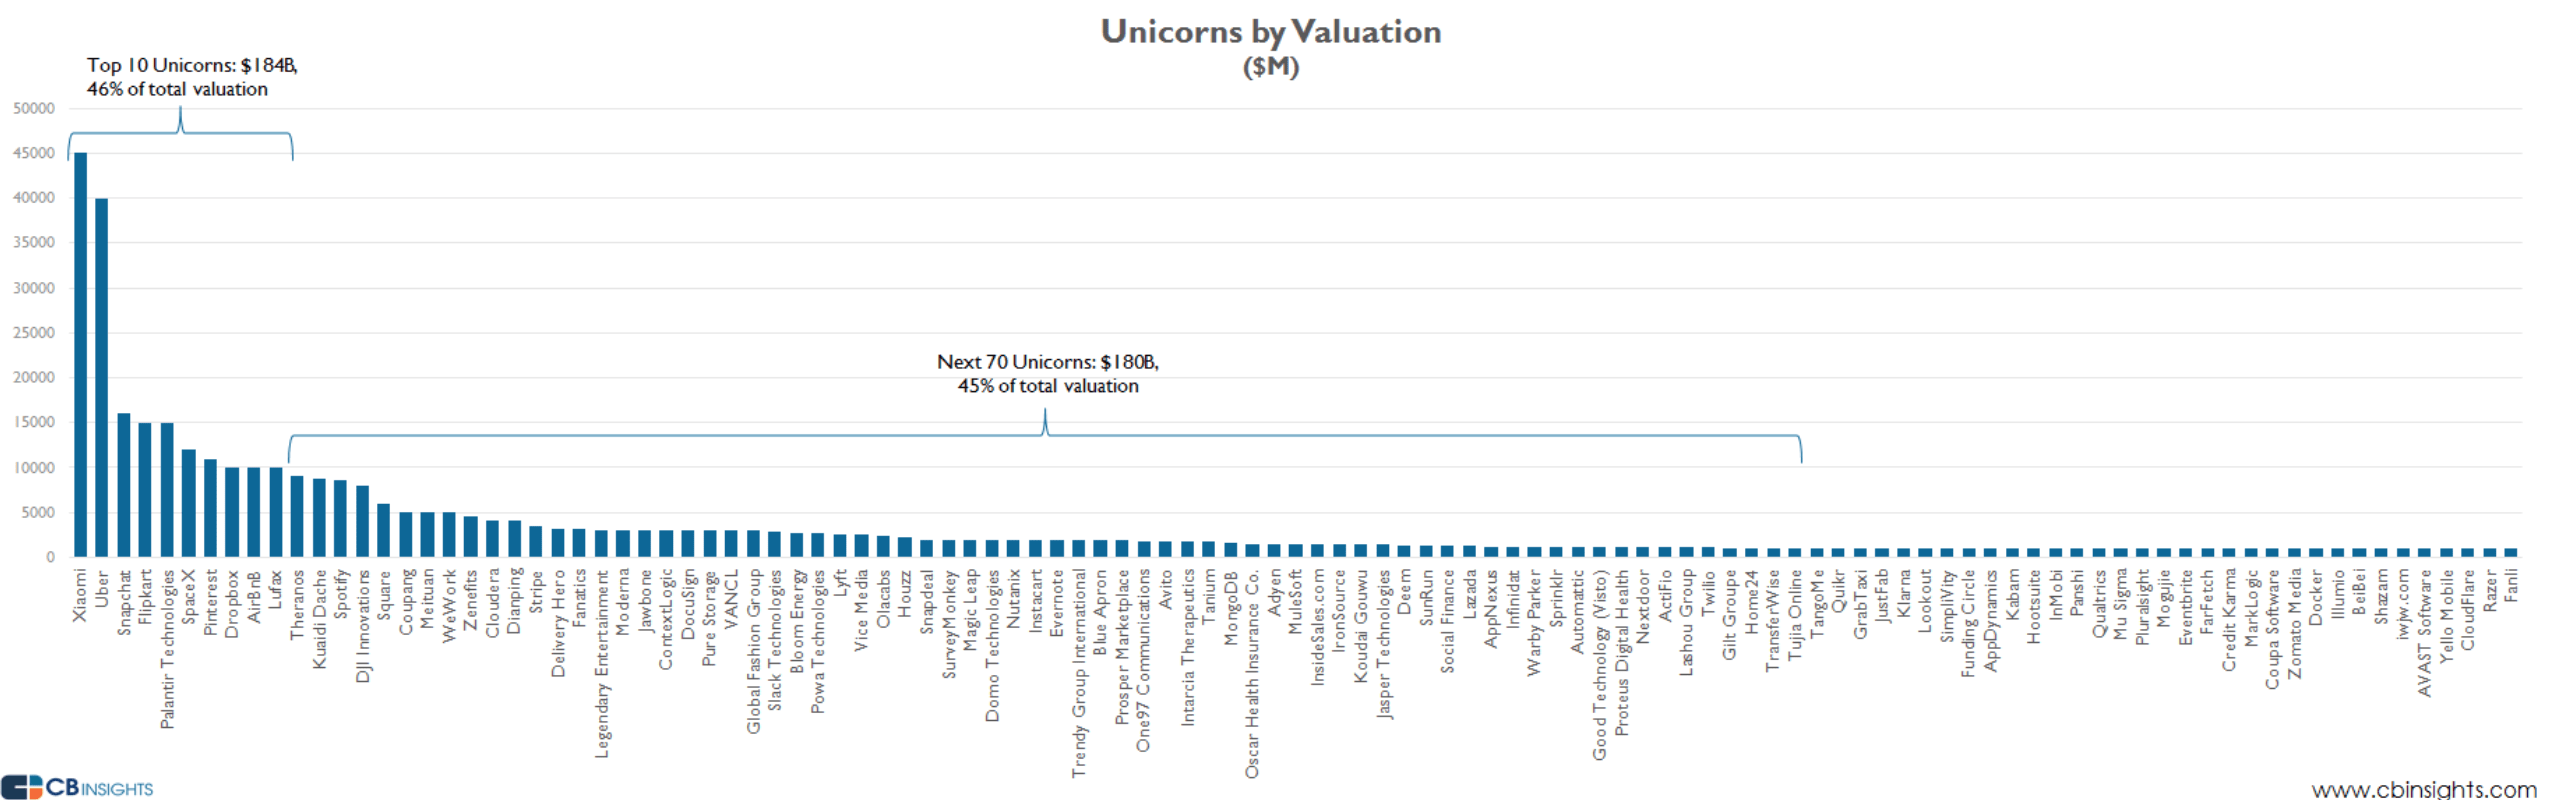
Graph: CB Insights, November 16, 2017

The top ten unicorns, including Uber, Snapchat, SpaceX, AirBnb, Pinterest, Dropbox, etc., represent $184 billion, almost half of the total valuation. Blue apron can as one of the following 70 unicorns. Its valuation falls between Trendy Group International and Proper Marketplace, all three of which are companies or relatively similar valuation size. Because the distribution follows power law, the first few unicorns have the highest valuation by exponential values, followed by the rest of the unicorns. The tail trails off with most companies at almost the same valuation.

Valuation and market capitalization are two different measures. Valuation is the estimation of a private company’s market value. It is what these unicorn statuses are based on. Companies like Uber, who are still private, have no measured market value, so they must go off of valuation. Dash Victor, former Square accounting manager, explains that a company’s valuation can be calculated by multiplying the price paid per share at the latest preferred stock round (for Blue Apron this is their Series D funding round) by the company’s fully diluted shares, which consists of outstanding preferred shares, options, and warrants, restricted shares, and potentially an option pool. Before going public, Blue Apron had a proposed valuation of just under $3 billion. Its current market capitalization, calculated by multiplying outstanding common shares by the current stock price, is only $710.79 million.

Differences in the way these two numbers are calculated can be attributed to some of Blue Apron’s woes. In market capitalization, only common shares (stock sold at IPO in addition to preferred shares converted to common shares at time of IPO) are used in calculating the total. Valuations, on the other hand, include outstanding options, warrants, and restricted shares. Additionally, a company’s valuation is based on preferred shares, which as titled, have preferred options over common shares, like in some cases guaranteed pricing upon exit. Victor explains that valuing a private company using this method is like “valuing a concert by taking the price of a front row seat and multiplying it by every seat in the house.” The premiums involved make it difficult to compare a company’s valuation to its market capitalization.

Valuation/market cap discrepancies were nowhere close to Blue Apron’s only problem. The year 2013 saw record highs for the volume of global VC investment, the majority of which was in companies in early and seed stage funding. Money was cheap, markets were overconfident, speculation was high, and this venture capital funding was easy to obtain. VC firms were investing in more and more companies, and according to the law of distribution, lots of these companies were bound to fail.

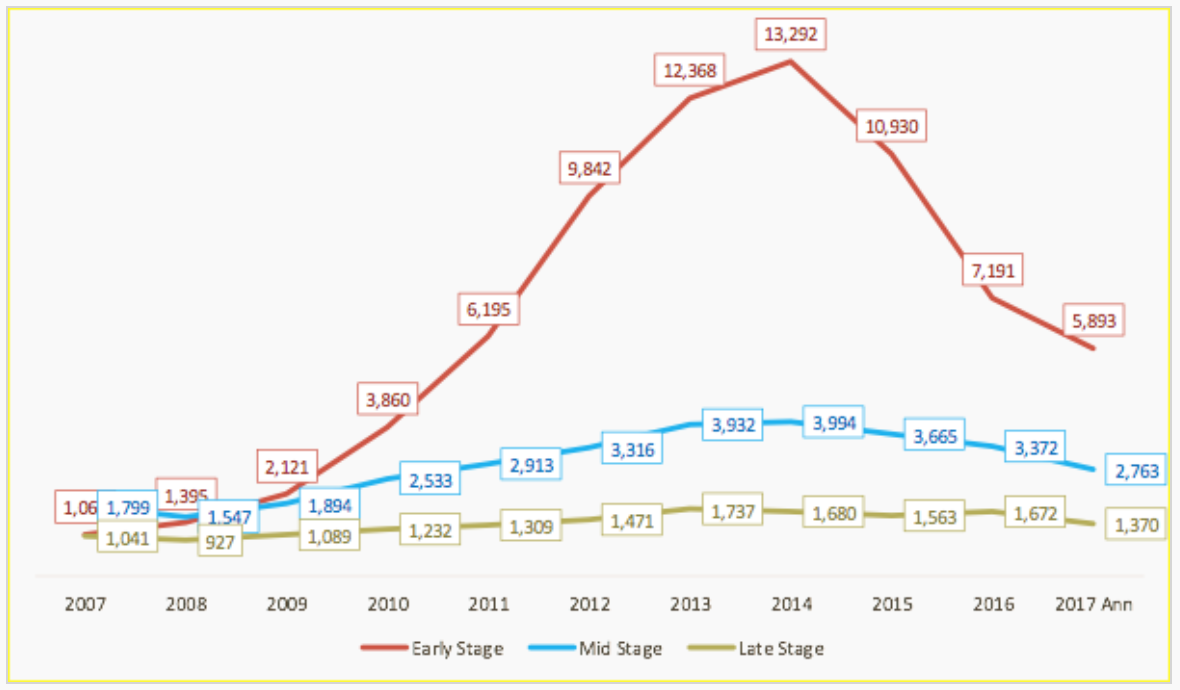
Graph: Global VC financing volume into technology companies by stage. (TechCrunch)

Blue Apron credits itself as an American ingredient-and-recipe meal kit service. When asked to define Blue Apron, a past subscriber coined it simply as a “food service.” Blue Apron is a subscription service that delivers semi-weekly, perfectly portioned ingredients and step-by-step recipes. Their vision claims a they’re on a quest to create better standards, regenerate land, eliminate the middle man, and reduce waste. The past user, Bella, said she and her father subscribed as an easy way to transition into being a single parent family. Her dad wanted to continue providing home cooked meals for her, but he didn’t have time to devote to grocery shopping, meal planning, and ingredient prepping. They subscribed for the convenience of the product, not the vision.

Another problem Blue Apron faced in going public was this current environment of hyper convenience. It seems as if every new product or service provides people with something to make their lives easier. This abundance of convenience is becoming oversaturated. The Los Angeles Times’ Tracey Lien writes that new ventures aimed at solving “seemingly trivial problems” have increasingly been popping up. This is due to powerhouse startups–Facebook, Google, Snapchat– already picking the “low-hanging fruit of the startup economy.” This is why the world had a $700 juicer and has a sock company that has received $110 million in funding. With lots of investment cash and copious amounts of wannabe founders, the startup economy has seen an increasing number of companies founded not to solve pressing world issues, but instead the trivial issues of the upperclass. This is what accounts for the hyper convenience in U.S. products and services. People no longer feel that delivery or subscription services are special. They’ve become desensitized to these luxuries, and no longer give them much value.

Another dilemma in the obsession with startups and their culture is the way in which they is communicated. For starters, the media defines almost every new venture, Blue Apron included, as a tech company. Blue Apron is a subscription service, but its products lie in the realm of the food and beverage industry. It can be classified as a delivery or ecommerce company, but to strictly define it as a technology company would be inappropriate. America is obsessed with technology, so consequently, startup coverage is heavily focused on tech companies. But with no real parameters for determining what it means to be “tech,” metrics and numbers can be misconstrued. A food and beverage company should not be expected to perform the same as an SaaS company. Similarly, an apparel startup should not be anticipated to live up to the performance metrics of a fintech company. Fortune’s David Meyer was wrong to compare 2017’s worst IPOs–Snap, Inc., Blue Apron, and Stitch Fix–all as technology companies.

Blue Apron’s meal kit delivery was a good idea. It probably could have done well in certain high income markets. However, it was overvalued, overfunded, and over speculated, leading to an unsatisfactory initial public offering. The state of American venture capital is at a tricky crossroads. Hundreds of trivial companies are being funded, leading to increasingly inflated valuations. Very few of them will IPO, but of those that do, they often face a rude awakening when their market capitalizations do not match their private valuations. The current obsession with tech, VC, and going public could potentially create drastic consequences for the American startup economy.


Behavioral Economics

Humans do not actually behave according to economists’ thought processes. Classic economics assume that humans are perfectly rational beings, who are all-informed and have infinite calculating abilities. In such a world, where people have concrete preferences and act in isolated events, advertising would not need to exist. This is because people would be certain in their preferences and unable to be swayed by ads.

In 2016, $190 billion was spent on advertising in the United States, so clearly, the real world has a need for advertising. That’s where behavioral economics come into play. Behavioral science–at the intersection of economics and psychology–assumes that people are not rational or capable of making decisions in their best interest (Freakonomics). In reality, most people make decisions using their emotions as the deciding factor either equally as much or more often than they use reason.

In this world of incomplete information, independent actors (people) must infer from others or situations with more complete information. Their safest bet is often to copy what the people around them are doing. The academic term for this is social norming, which in lay man’s terms means peer pressure.

A big reason for this herd mentality is something called loss aversion. Loss aversion is a concept explaining that people experience greater emotion (pain) with loss, than the emotion (pleasure) they experience with gains of proportional size. So in simplified terms, people hate giving stuff up, even if said stuff has little to no value to them. They want to mitigate their losses, and one way of doing this is by making decisions that other people have already made which weren’t catastrophically bad.

Behavioral economics takes into account these factors playing into decisions that real, irrational individuals make. It’s a study of the “codification of behavioral anomalies” which economists establish using empirical evidence (Forbes). Consumers frame their personal economic outcomes as gains and losses, which affects their economic decisions and choices. Behavioral economics examines this framing.

Advertising is an industry that has been using behavioral economics to its advantage long before the area of study was formally established. The industry manipulates the emotions of consumers in a way, changing their preferences, which contrary to standard economics beliefs, are not concrete. Like social norming, people pick well-known brands because they figure they’re less likely to be catastrophically bad than the alternative.

One tactic some advertisers use is the creation of scarcity. Limited edition, limited time only, etc., labeled products construct an artificial scarcity, driving humans to take action. They buy the product right then and there instead of waiting. Companies and advertisers exploit this scarcity bias in consumers as an effort to sell more products.

Advertisers and ad agencies rely on data to help manipulate their audiences. This collection of data calls for a new area of academia–this time in the field of ethics. Where is the line drawn? If voluntary data collection is okay, what about involuntary? How do these ethical issues converge with those of digital data collection as seen by Google, Facebook, etc?

http://adage.com/article/adagestat/advertising-dan-ariely-behavioral-economics-marketing/146001/

https://www.investopedia.com/terms/b/behavioraleconomics.asp?ad=dirN&qo=investopediaSiteSearch&qsrc=0&o=40186

https://www.spectator.co.uk/2017/08/how-sutherlands-law-of-bad-maths-could-solve-nightmare-train-commutes/


Trump’s Trade (Partial)Truth

I’ve trained myself to automatically assume that everything Donald Trump says is incorrect. It mitigates frustration and utter disbelief. It prioritizes my sanity. Most importantly, it causes me great surprise when he says something that is anything remotely near true. With Trump as our president, I keep Snopes bookmarked in my favorites bar.

One of Trump’s favorite hot topics is China. He called global warming a hoax created by China. He accused the U.S. of becoming at third-world country at the hands of China. He even tweeted that China did “NOTHING” to help the U.S. stop North Korea from creating nuclear weapons.

No matter how much I hate to admit it, though, President Trump’s take on trade with China does have an inkling of truth. In his 2017 Inaugural Address, he said:

“We’ve made other countries rich while the wealth, strength and confidence of our country has dissipated over the horizon. One by one, the factories shuttered and left our shores with not even a thought about the millions and millions of American workers that were left behind.”

While this is an extreme exaggeration, we should be careful not to brush it off as quickly as we do his take on global warming.

China, by all means, is a global powerhouse. However, it wasn’t always that way. For years and years, communist China had a downward-spiriling economy. But between 1991 and 2013, China’s exports increased from 2% of the world’s total to almost 20% (Freakonomics). The country transformed into a leading producer as a result of its plentitude of resources available and more importantly, its cheap labor. China was able to do this so quickly because of its sheer size and the massive potential amount of slack it had to pick up.

In the 1990’s, the Ports of Los Angeles and Long Beach exploded in use due to China’s manufacturing transformation. The two ports combined currently do the most trade in the U.S. (Port of LA Communications). Jobs in shipping–working at the port, sorting, on trains, etc–all either kept or exceeded their current demand. The one part of the labor market that fell apart was manufacturing.

Globalization, trade amongst foreign countries, raises the GDP of the countries at stake. This is not without adverse distributional consequences, though. And one of its biggest dilemmas is labor.

China’s rapid production development is one of the best things to have happened to the U.S. middle class. Chinese workers are employed and producing items to be exported to other countries. People in the U.S. are happy because everything they buy is so much cheaper, thanks to the low financial cost of labor in China and the super low cost of streamlined shipping thanks to the invention of TEUs (Gabriel Kahn). The net effect of the U.S.-China trade relationship is good.

The loser is the manufacturing labor market, a potential reason for why we are currently living in a country with Donald Trump serving as president. With China producing things at such low costs, the need for low-skilled or unskilled manufacturing jobs in the United Stated became virtually nonexistent. Manufacturing workers were laid off in the masses, and plants closed throughout America. From 2000-2007, one million U.S. manufacturing jobs disappeared, 40% of which was attributable to China’s newfound success (Autor). Highly-skilled U.S. workers were just fine, but those who were educated at that level lost their work to cheap Chinese labor.

Those low-skilled manufacturing workers were now out of work and needed to costlessly reallocate to their next best opportunity. This was not easy to do because for the most part because their adaptation skills were poor, making reallocations unsuccessful. This had adverse effects on other labor markets, which served the manufacturing plants that went out of business. The wages of manufacturing jobs that did still exist were lowered because of the low cost of Chinese labor. Public transfer benefits such as medicare, medicaid, food stamps, etc., became more widely used because low-skilled workers were out of work, and their skills levels made it hard for them to reallocate without any costs.

China’s transformation into a country of mass exports adversely created job loss, wage depression, and increase in welfare spending for a particular portion of the United States: manufacturing workers who aren’t highly skilled. The growth of China into a powerhouse nation was as a majority a global good. However, much to Trump’s and my dismay, it also fully disrupted a U.S. labor market–manufacturing–for the worse.

Revised: Education: A Catalyst in Gender Pay Gap


Education: A Catalyst in Gender Pay Gap

In President Barack Obama’s 2015 State of the Union Address, he stated that women “make 77 cents for every dollar a man earns.” If a woman had a dollar, or even 77 cents, for every time she heard that statistic, it would cover lunch for a week. While this statistic, a ratio of two medians for full-time, full-year workers, can be problematic in that it doesn’t account for pay for the same work, it is true that a gender pay gap still exists in the United States; the female-to-male earnings ratio in 2016 was only 80.5%, although up from 70% in 1990 (U.S. Census Bureau).

Determining the causes of the gender pay gap is not a simple task. Communication surrounding the disparity is plagued by inaccuracies, as evident in Obama’s SOTU. Media coverage tends to say that the gap is caused by discrimination. Claudia Goldin, professor of economics at Harvard University, explains that while this was once the case, it is no longer a significant cause. She also reasons that another popular argument, categorical differences such as competitiveness and negotiation skills, doesn’t go the full degree in explaining the pay gap either. When featured on the Freakonomics podcast “The True Story of the Gender Pay Gap,” she deemed that the main reason for disparity is the high cost of temporal flexibility, valued more by women than men.

Temporal flexibility is “the variation in the number of hours worked and the timing of the work” (Oxford Reference).  Women value this flexibility so highly because they disproportionately have caregiving obligations—watching the kids, looking after their parents, assisting sick family members, etc.—which require them to work differently. It is important to note that not all women desire this temporal flexibility. In fact, the National Longitudinal Survey of Youth found that in 2006, women without children or spouses earned 96 cents for every dollar a man earned. The gap between men and women who place similar amounts of importance on temporal flexibility is somewhere in the 95% range, according to Princeton Professor Anne-Marie slaughter, who was also interviewed on Freakonomics. But since many other women disproportionately dedicate time to caregiving without compensation, they are willing to pay the high costs for flexibility of hours scheduled and worked.

This high price that women pay is reflected in their salaries. Glassdoor reports that the top five jobs in which women earn less than men, four of which are the following: chef, dentist, c-suite, and psychologist, all of which have at least a 27.2% base pay difference. The costs of temporal flexibility in these types of jobs are the highest because they are so specialized.  A chef’s signature dish cannot be made by a different chef, and a patient’s wellness is dependent on his intimate relationship with his specific psychologist. These workers aren’t substitutable, so the handoffs are more costly. These handoff costs are reciprocated to costly workers, who work fewer or their own hours and thus cause more handoffs.

When women enter these types of careers, they are initially paid similar wages to their male counterparts. However, when they begin to have children, or start caring for someone else, they can no longer adhere to the requested hours set by their employers. Since they cannot devote all of the hours needed by their clients to them, they don’t receive raises, aren’t made partners, and can’t grow their careers. Women work fewer employer-requested hours and consequently notice negative effects on their salaries. The high cost of temporal flexibility is a partial cause of vertical segregation, defined by Stanford University’s Topic Report as “the overrepresentation of a clearly identifiable group of workers in occupations or sectors at the top of an ordering based on desirable attributes.” In this case, men are overrepresented as c-suite workers, dentists, etc. because they possess a desirable trait—a low value on temporal flexibility.

The difference in the value of temporal flexibility by gender also influences horizontal segregation, “the concentration of men and women in professions or sectors of economic activity” (Stanford).  In choosing occupations, men tend to choose sectors where levels of responsibility are high. The UNC Population Center published North Carolina’s largest jobs by sex, and men’s were drivers, managers, supervisors, laborers, and salespersons. The majority of these do not allow for flexibility in work hours, an adverse effect of requiring lots of responsibility. Inversely, many women go into careers that are compatible with their family lives. In North Carolina these were elementary school teachers, nurses, secretaries, and health aides. The flexibility for teachers and nurses stems from their abnormal work schedules. Teachers work shifted hours, which align with children’s school schedules. They additionally have summers off and longer holiday breaks. Nurses do not have typical 9-5 hours either. They have options to work night shifts, allowing them to be home during the day. These types of occupations offer more part time employment opportunities and have smaller penalties for career pauses, so women gravitate toward them.

There is a bright side, though. In 2012, Pew found in its analysis of the U.S. Census Bureau data that the number of women enrolled in college outnumbered men by 11%, (See Appendix A). And female earnings increased 2.7% from 2014-2015, while men’s only increased 1.5%. Hence, the gender pay gap is shrinking. Hannah Rosin, in her Atlantic feature, “The End of Men,” argues that economic success is shifting away from being determined by attributes typical of men, e.g. physical strength and stamina. More women are entering the work force. Women entering new fields are dedicating less time to unpaid domestic work, making them more valuable workers who are paid more. This also creates a new need in the labor force for domestic workers. These jobs are being filled by women.  The typical working wife earns on average 42.2% of the household annual income, which was 2-6% in 1970. Four out of ten mothers are now the primary moneymakers in their families. Wage gaps are shrinking for these ideologically normal women who have traditional families and are of high socio-economic statuses. But how can the United States shrink the gender pay gap for all of its women?

The countries with the smallest gender pay gaps are Iceland, Finland, Norway, and Sweden–all Nordic countries, whose populations combined roughly equal that of Texas. They’re all also welfare states with little population diversity. The differences between the United States and the Nordic countries are significant in explaining their differences in gender pay and illustrative of why they will continuously rank highly while the U.S. will not.

Over time, traditionally male professions are becoming increasing female-dominated. In a study on occupational feminization and pay, researchers found that when controlling for skill and education, professions with more women pay less than those with less women. This is seen in recreation, design, housekeeping, and biology. The reverse happened in computer science; when men started flocking to the field, salaries rose significantly. These changes in pay can be partially attributed to the devaluation of work done by women, a result not of temporal flexibility, but of creeping gender bias. Tangible solutions to the devaluation of women’s work lie in creating structural, systematic change, which would be a huge undertaking for the United States.

One area with huge practical potential to decrease the gender pay gap for everyone is the U.S. school systems. Primary education is an enormous hindrance on working parents, especially in the case of mothers who disproportionately handle childcare. It’s also a huge handicap for working single-mothers and other non-traditional working caregivers. Primary education reforms can reduce the amount of temporal flexibility that working women need.

Take, for example, Germany, which ranked 13th best in global gender pay in 2016 (the U.S. ranked 45th out of 144 countries). Kerri Shigo, former senior marketing manager at Microsoft, moved to Munich with her husband and four children in 2008. Shigo had previously worked part-time at Microsoft to take care of her children. Upon moving to Germany, she took a long-term break from working. In conversation, Shigo expressed that she regretted quitting work for the years that she lived abroad. A large factor that led to this regret was the pre- and primary-schooling in Germany. Her youngest child attended kindergarten, Germany’s version of pubic preschool, from age three to six. The kindergarten school week ran Monday through Friday, and days lasted from 8:00 am until 4:00 pm. Kindergarten school days are set-up so that mothers who need to drop-off and pick-up their children can still work a full eight-hour workday. Another benefit of the German school system is its calendar year, which runs on a somewhat year-round schedule; students are in class for two months, then they have a break that alternates between one and two weeks. Working mothers don’t have to worry about arranging flexibility of timing at work to care for their children during a lengthy summer vacation. Instead, their holidays align more closely with their children’s, so they can use their paid vacation for the other breaks.

Germany’s public-school system is supportive of reducing the amount of temporal flexibility that working moms need, effectively contributing to its smaller gender pay gap. It would be beneficial for the United States to reform its education system, borrowing from some of Germany’s ways. Lowering the age in which children start school would allow working-mothers to return to their jobs after childbirth earlier, if they choose to do so. Shifting the school day to more accurately reflect the work day could allow women to work on their companies’ hours instead of their own. Lastly, reforming scheduling of the school year to eliminate a lengthy summer break and instead have shorter breaks more reflective of the holidays would let mothers better align their paid time off with their children’s breaks.

There are several other approaches and combinations of approaches that would be effective in reducing the U.S. gender pay gap. One such is politics, which is currently at play in Canada, where a cabinet member is pregnant. It’ll be interesting to see how Canada decides to handle its first political pregnancy, and if they use policy change to address it. Other potential solutions are offering paternity leave, uprooting recruiting practices, or improving performance reviews and feedback. Education is merely one route to take in diminishing the U.S. gender pay gap. What is most important is that the causes of the disparity become more widely known, so that more action can be taken to help mitigate the already shrinking gender pay gap.


APPENDIX A

This graph, from the World Economic Forum, highlights the Global Gender Gap Index in contrast to its four subindexes, which determine its value. A Y-Axis value of zero equals inequality, and an X-Axis value of one equals equality. The Education Subindex is much higher than the Economic Subindex, as illustrated by the current environment in the United States—more women are in college than men, yet they are still earning less in their post-graduate careers. This difference indicates a need for a higher Economic Subindex to raise the Global Gender Gap Index.


Education: A Catalyst in Gender Pay Gap

Briana Grubb

Professor Gabriel Kahn

JOUR 469

October 11, 2017

Education: A Catalyst in Gender Pay Gap


In President Barack Obama’s 2015 State of the Union Address, he stated that women “make 77 cents for every dollar a man earns.” If a woman had a dollar, or even 77 cents, for every time she heard that statistic, it would cover lunch for a week. While this statistic, a ratio of two medians for full-time, full-year workers, can be problematic in that it doesn’t account for pay for the same work, it is true that a gender pay gap still exists in the United States; the female-to-male earnings ratio in 2015 was only 0.80 (U.S. Census Bureau).

Determining the causes of the gender pay gap is not a simple task. Communication surrounding the disparity is plagued by inaccuracies, as evident in Obama’s SOTU. Media coverage tends to say that the gap is caused by discrimination. Claudia Goldin, Professor of Economics at Harvard University, explains that while this was once the case, it is no longer a significant cause. She also reasons that another popular argument, categorical differences such as competitiveness and negotiation skills, doesn’t go the full degree in explaining the pay gap either. When featured on the Freakonomics podcast “The True Story of the Gender Pay Gap,” she deemed that the main reason for disparity is the high cost of temporal flexibility, valued more by women than men.

Temporal flexibility is “the variation in the number of hours worked and the timing of the work” (Oxford Reference).  Women value this flexibility so highly because they disproportionately have caregiving obligations—watching the kids, looking after their parents, assisting sick family members, etc.—which require them to work differently. It is important to note that not all women desire this temporal flexibility. In fact, the National Longitudinal Survey of Youth found that in 2006, women without children or spouses earned 96 cents for every dollar a man earned. The gap is virtually nonexistent between men and women who place similar amounts of importance on temporal flexibility. But since many other women disproportionately dedicate time to caregiving without compensation, they are willing to pay the high costs for flexibility of hours scheduled and worked.

This high price that women pay is reflected in their salaries. Glassdoor reports that the top five jobs in which women earn less than men are the following: computer programmer, chef, dentist, c-suite, and psychologist, all of which have at least a 27.2% base pay difference. The costs of temporal flexibility in these types of jobs are the highest because they are so specialized. The workers aren’t substitutable, so the handoffs are costlier. These handoff costs are reciprocated to costly workers, who work fewer or their own hours and thus cause more handoffs.

When women enter these types of careers, they are initially paid similar wages to their male counterparts. However, when they begin to have children, or start caring for someone else, they can no longer adhere to the requested hours set by their employers. Since they cannot devote all of the hours needed by their clients to them, they don’t receive raises, aren’t made partners, and can’t grow their careers. Women work less employer-requested hours and consequently notice negative effects on their salaries. The high cost of temporal flexibility is a partial cause of vertical segregation, defined by Stanford University’s Topic Report as “the overrepresentation of a clearly identifiable group of workers in occupations or sectors at the top of an ordering based on desirable attributes.” In this case, men are overrepresented as c-suite workers, dentists, etc. because they possess a desirable trait—a low value on temporal flexibility.

The difference in the value of temporal flexibility by gender also influences horizontal segregation, “the concentration of men and women in professions or sectors of economic activity” (Stanford).  In choosing occupations, men tend to choose sectors where levels of responsibility are high. The UNC Population Center published North Carolina’s largest jobs by sex, and men’s were drivers, managers, supervisors, laborers, and salespersons. The majority of these do not allow for flexibility in work hours, an adverse effect of requiring lots of responsibility. Inversely, many women go into careers that are compatible with their family lives. In North Carolina these were elementary school teachers, nurses, secretaries, and health aides. These types of occupations offer more part time employment opportunities and have smaller penalties for career pauses, so women gravitate toward them.

There is a bright side though! In 2012, Pew found in its analysis of the U.S. Census Bureau data that the number of women enrolled in college outnumbered men by 11%, (See Appendix A). And in September 2017, the unemployment rate of women ages 16 and up was higher than men’s of the same age, as reported by the Bureau of Labor Statistics. Female earnings increased 2.7% from 2014-2015, while men’s only increased 1.5%. Hence, the gender pay gap is shrinking. Hannah Rosin, in her Atlantic feature, “The End of Men,” argues that economic success is shifting away from being determined by attributes typical of men, e.g. physical strength and stamina. More women are entering the work force, and thus many new jobs are being created, replacing the domestic work women used to do for free. The typical working wife earns on average 42.2% of the household annual income, and four out of ten mothers are now the primary moneymakers in their families. Wage gaps are shrinking for these ideologically normal women who have traditional families and are of high socio-economic statuses. But how can the United States shrink the gender pay gap for all of its women?

An area with huge potential to decrease the gender pay gap for everyone is U.S. school systems. Primary education is an enormous hindrance on working parents, especially in the case of mothers who disproportionately handle childcare. It’s also a huge handicap for working single-mothers and other non-traditional working caregivers. Primary education reforms can reduce the amount of temporal flexibility that working women need.

Take for example Germany, which ranked 13th best in global gender pay in 2016 (the U.S. ranked 45th out of 144 countries). Kerri Shigo, former Senior Marketing Manager at Microsoft, moved to Munich with her husband and four children in 2008. Shigo had previously worked part-time at Microsoft to take care of her children. Upon moving to Germany, she took a long-term break from working. In conversation, Shigo expressed that she regretted quitting work for the years that she lived abroad. A large factor that led to this regret was the pre- and primary-schooling in Germany. Her youngest child attended kindergarten, Germany’s version of pubic preschool, from age three to six. The kindergarten school week ran Monday through Friday, and days lasted from 8:00 am until 4:00 pm. Kindergarten school days are set-up so that mothers who need to drop-off and pick-up their children can still work a full eight-hour workday. Another benefit of the German school system is its calendar year, which runs on a somewhat year-round schedule; students are in class for two months, then they have a break that alternates between one and two weeks. Working mothers don’t have to worry about arranging flexibility of timing at work to care for their children during a lengthy summer vacation. Instead, their holidays align more closely with their children’s, so they can use their paid vacation for the other breaks.

Germany’s public school system is supportive of reducing the amount of temporal flexibility that working moms need, effectively contributing to its smaller gender pay gap. It would be beneficial for the United States to reform its education system, borrowing from some of Germany’s ways. Lowering the age in which children start school would allow working-mothers to return to their jobs after childbirth earlier, if they choose to do so. Shifting the school day to more accurately reflect the work day could allow women to work on their companies’ hours instead of their own. Lastly, reforming scheduling of the school year to eliminate a lengthy summer break and instead have shorter breaks more reflective of the holidays would let mothers better align their paid time off with their children’s breaks.

Education is merely one route to take in diminishing the U.S. gender pay gap. There are several other approaches and combinations of approaches that would also be effective. What is important is that the causes of the disaprity become more widely known, so that more action can be taken to help mitigate the already shrinking gender pay gap.


**UPDATE (10/11/17 at 9:59 am). This Fortune article brings up the interesting question of how to navigate maternity leave (temporal flexibility) in the Canadian political landscape.


APPENDIX A

This graph, from the World Economic Forum, highlights the Global Gender Gap Index in contrast to its four subindexes, which determine its value. A Y-Axis value of zero equals inequality, and an X-Axis value of one equals equality. The Education Subindex is much higher than the Economic Subindex, as illustrated by the current environment in the United States—more women are in college than men, yet they are still earning less in their post-graduate careers. This difference indicates a need for a higher Economic Subindex to raise the Global Gender Gap Index.


Ubernomics

Learning economics is a difficult undertaking for students like myself. Unlike biology or mathematics, economics is not tangible or easy to visualize. Even its definition–the study of scarcity–leaves me puzzled about the nature of economics as a field of study.

However, Uber, a global ridehailing service, is an economics student’s saving grace. Uber’s market is an ideal for what we want the economy to look like. It has characteristics of a competitive market: low barriers for entry, many buyers and sellers, and somewhat homogenous services. Most importantly, the prices riders pay are a direct response to supply and demand. Uber is an excellent example with which to apply numerous economic terms and theories.

Take, for example, consumer surplus. According to Britannica, consumer surplus is “the difference between the price a consumer pays for an item, and the price he would be willing to pay rather than do without it.” It’s a number that has been impossible to estimate in the real world (unless you are a fan of the Infinite Universe theory) until now. Steven Levitt, an economist at the University of Chicago, was able to estimate a consumer surplus measurement using Uber’s data, which collects information about completed trips and those that were considered (user opened the app) but never taken.

On Freakonomics’ podcast from September 7, 2016, Levitt explains that even though Uber has an algorithm to come up with the ideal prices of surged rides, the company instead only multiplies the cost by tenths (1.1, 1.2, 1.3) for customer convenience. This series of minute discontinuities allows for the estimation of the price-sensitivity of Uber riders.

Now, what is price sensitivity? In Greg Ip’s The Undercover Economist, he explains the concept: “when I raise the price, how much do my sales fall? And when I cut the price, how much do my sales rise?” So, it’s the extent to which the price of something affects if a person will buy it.

Levitt examined Uber’s database of many similar consumers facing incrementally different prices to examine the price sensitivity of the riders (at what price will they leave the app instead of booking a ride). Levitt also used this data to estimate Uber’s consumer surplus. He extrapolated that in 2015 the consumer surplus in the United States was $7 billion, which means that riders were willing to spend $11 billion on rides, but in reality only paid $4 billion.

The “Regression Discontinuity Analysis” that Levitt used to estimate consumer surplus can also be used to illustrate a real-life example of the demand curve. Britannica explains that the Demand Curve is a graph illustrating the relationship between price and quantity. The curve slopes downward from left to right because price and quantity are inversely related. It’s an artificial construct that economists use to examine real-world situations. But once again, Uber can be of assistance. Uber’s price surging data, all of the small jumps in price faced by similar consumers, can be added together to discover an instantaneous demand curve. When there is no surge, the price of rides is average and so is the amount of drivers. As an oversimplification it can be noted that demand is at equilibrium. When surges occur, prices go up and and the amount of drivers available declines, so demand is high.

Uber has been in the news a hundred times over for all of its scandals and controversies. But Uber deserves more positive press–it led me to pass my econ quiz!


Your Economy Is What You Eat

Within the United States’ precarious political environment, many Americans live in fear that the economy will dip into a deep recession like that of the housing crisis, which occurred not even a decade ago. These nerves are rational, as our market economy is cyclical. Periods of growth have always inevitably been met with periods of recession.

Economic indicators can help us to analyze the economy. Studying trends in retail sales, unemployment, etc. can help us make educated guesses as to where the economy is and where it is going. An interesting economic indicator we can use to analyze these trends is restaurant sales.

In an economy with contracting growth, individuals and families may feel their first inklings of strain in terms of food. In an unhealthy economy, the dollar might be devalued and workers may be laid off, which would lead to a decrease in consumption, which accounts for almost two thirds of the U.S.’s GDP. Consumption measures what is spent on goods and services produced in the United States. Even though it is only a portion of a nation’s GDP, consumption can be used to help predict the future of an economy, especially in a country like America because its consumption is relatively high in comparison with other economic variables.

If an economy is shrinking, one of the first areas of decline is restaurant sales. Economically strained Americans first tighten their finances by refraining from eating out. Food as a commodity is a short-lived luxury, since after you eat it, it’s gone for good. Therefore, food, especially going out to eat, is one of the first areas in which people start to cut back when trying to save money. Declining restaurant sales are an indicator that economic growth is slowing.

Within slowing or flat restaurant sales reports is a hierarchy. The first types of restaurants to feel decreases in sales are full-service, sit-down restaurants. They’re the first to go for individuals trying to save because they are the most draining of important resources, e.g. time and money. Next comes fast casual restaurants, whose sales’ declines mean that there is much more financial strain amongst a nation’s citizens, leading financial experts to turn decidedly bearish on them. Decisions like these lead to less valuable restaurant stocks.

However, not all trends in restaurant sales decline when Americans are nervous about the economy. An example of an outlier is pizza. As Bloomberg reports, in June of 2016, restaurant sales were flat, the lowest growth in sales since 2013. In contrast, Domino’s continued growing, with sales toping 5% for Q2 2014 – Q2 2016. Bloomberg Intelligence Analyst Michael Halen explains that Pizza does well in recessions due to its value proposition–moneymakers feel frugal spending $7.99 on a large pizza to feed their families.

Many other aspects of food can be economic indicators. Increases in grocery store sales indicate that more people are eating in and thus trying to save money. And similar to pizza shops, fast-food chains tend to do well during recession due to consumers’ value propositions. Hugo Lindgren of New York magazine went so far as to publish the “Hot Waitress Economic Index” explaining that during slow, flat, or declining economic growth, restaurant servers are more attractive, assuming that attractive people tend to find higher-paying work during good economic times.

Economic indicators are measurements collected to assist in hypothesizing the future of the economy. They are useful only with supportive data and examined in long-term contexts. Some indicators are estimated by governmental organizations or professional private companies. However, some are more suitable for normal citizens, like pizza.

Other sources: Eater Wall Street Journal Forbes