Chinese Billionaires Are Taking Over L.A.

1x-1-1

In the last five years there has been a measurable increase in the amount of wealthy Chinese that have immigrated to the United States. The instability of the Chinese currency and increase in government regulation has caused some of the wealthiest Chinese citizens to worry about the fate of their fortunes. Therefore, since money is not a problem for many of these individuals, a large number of Chinese invest in American real estate to ensure that their money will be protected under the more stable U.S. dollar. Chinese immigrants have been settling all over United States; however, California is the clear winner when it comes to who has the highest number of wealthy Chinese immigrants. As a Pasadena native, I have been able to see the increasing number of Chinese immigrants in surrounding cities, which is why I will be discussing the growing Asian population in Arcadia, CA.

China is known for being the country with the largest population, being a global leader in trade, production and manufacturing, and housing hundreds of billion-dollar companies that directly compete with, and often dominate, international markets. So why have 2/3 of China’s millionaires emigrated or have plans to move to the U.S. in the next 5 years (Weise, 2014)?

One reason is because of the increased amount of government regulation in China. In recent years, the Chinese government has started to crack down on corrupt Chinese business practices. Knowing this, many wealthy Chinese citizens who earned their fortunes illegally have been trying to hide their money in foreign assets and investments, so they do not get caught.

According to Christopher Hawthorne from the Los Angeles Times, questionable business practices in China are motivating people to move to the U.S. [which, includes] stashing their money overseas and in mansions and other assets. This creates a problem for the Chinese government because with so many citizens moving large amounts of cash overseas, at a rapid pace, the government is not able to keep track of where all of the money is going.screen-shot-2016-10-11-at-4-10-51-pm

Another reason why many Chinese elites are investing their money in American assets is because China’s currency is relatively weak compared to the dollar. In the beginning of the year, the dollar was not as strong as it usually is, which gave China the opportunity to try and stabilize the yuan (Wei, 2016). However, Lingling Wei from the Wall Street Journal reported that in April of this 2016, the yuan actually depreciated 0.6% against the dollar, causing the Chinese government, along with wealthy Chinese citizens, to panic. These feelings of panic have been occurring for years, causing wealthy Chinese businesspersons to think about where they can move their money to make sure that it retains its value.

Their solution: investing their millions into real estate in the U.S. Karen Weise, a reporter from Bloomberg, found that Chinese nationals hold around $660 billion in personal wealth offshore, with $22 billion of that being spent on homes. For the past 10 years, real estate has catered to wealthy Chinese populations all over the country, with the most concentrated example being in Arcadia, CA.

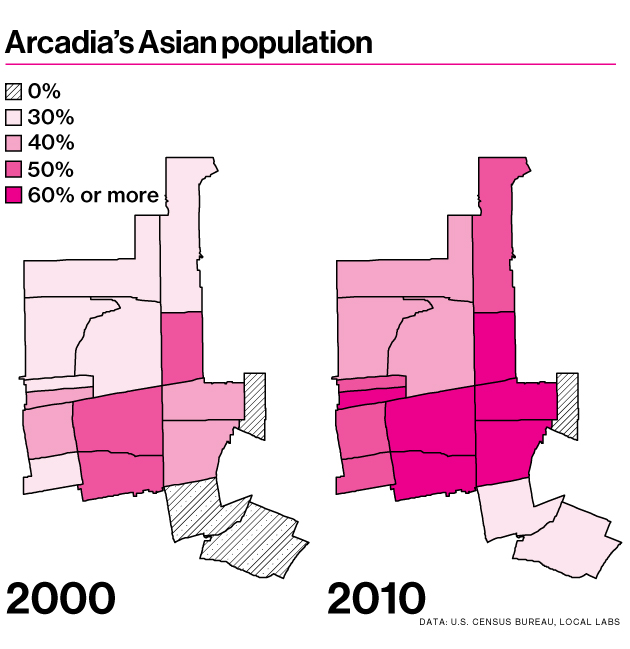
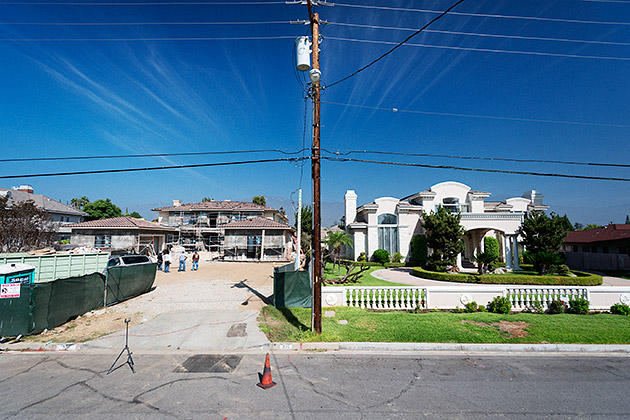
Arcadia is a city 20 miles northeast of Downtown Los Angeles that has become a haven for wealthy Chinese residents. Residents are attracted to Arcadia because of its first-class schooling, nice neighborhood, large homes, lenient building codes, and a pre-existing Asian population. As a result to an influx of Chinese millionaires, Arcadia has become a city categorized by new mansions that cost anywhere from $2 million to $7 million. You would think these ridiculous asking prices would discourage Chinese citizens from emigrating. However, it has done the complete opposite.

1x-1

Just in 2013, one realtor, Peggy Fong Chen, sold over $71 million worth of homes in Arcadia (The Chinese Beverly Hills, 2014). For the most part, these large Arcadian mansions are in high demand because it gives millionaires a place to store their money. Because of China’s shifting real estate policies and the social instability caused by income and wealth inequality in China, rich people have come to feel unsafe, said reporter Jue Wang (2014). For this reason, these Chinese immigrants often pay for their million dollar homes in cash in order to shorten the money trail, with the hopes of hiding their money more effectively from the Chinese government.

When driving through the streets of Arcadia, you are able to large mansions with semi-circular driveways, lined with Range Rovers and Porches. However, when examining the houses closely many seem like they are unoccupied. A member of Arcadia’s homeowner’s association estimated that 20% of these new homes sit empty (Weise, 2014). The main reasoning behind this is that the Chinese are just using these homes to store cash. However, other reasons can be because the mansions are being used as vacation homes, or because many homes are purchased for millionaire’s children, parents, or mistresses, or because language barriers have actually caused Chinese residents to move back to Asia or elsewhere.

The fact that Chinese immigrants are leaving Arcadia because of a language barrier proves that, certain cities and amenities do not appeal to all Chinese elites. However, people are highly aware of the potential profits these immigrants could generate. Therefore, people have had to come up with specific ways to attract wealthy Chinese immigrants.

To attract this specific Chinese market, architects and developers have been building and crafting million-dollar mansions with similar styles, which has drastically changed Arcadia’s city landscape. Most of the homes architects create reflect the Chinese philosophy of feng shui and face the south, which are two important aspects of Chinese culture (Hawthorne, 2014). Chinese culture is deeply rooted in tradition, therefore, Chinese citizens are often more attracted to homes that represent and honor their culture. Arcadian architects also try to attract Chinese millionaires by creating mansions that include: wine cellars, theaters, double-height entry halls, elevators, many master bedrooms, and a separate wok kitchen (Hawthorne, 2014). Architects and developers make a conscious effort to build these Arcadia mansions to appeal to wealthy Chinese immigrants, in the hopes of earning a large profit.

Architects and developers are not the only ones trying to bring Chinese millionaires to America. The U.S. government recognizes the money that wealthy foreigners have, and wants them to spend it on American soil. Therefore, in 1990 the U.S. government created a program to attract foreign investments, in the hopes of sparking investment. It requires that if wealthy foreigners invest at least $500,000 in an American business, they are eligible to apply for a green card known as the EB-5 Visa. As of this year, Chinese nationals allocated 85% of the 10,000 visas offered. Therefore, through this plan, the U.S. was able to generate $4,250,000,000 in investments; in addition to the money foreigners spent once they came to the U.S.

The influx of wealthy Chinese immigrants has brought a lot of business, investment, and money to the United States. For example, in 2014, Arcadia brought in a record revenue of $7.9 million just from fees for building permits and developments, which is a 72% increase from the previous year (Weise, 2014). Wealthy Chinese immigrants also helped with the U.S. economy during the recession of 2009. During this time, China elites were slightly affected but still stayed wealthy. Therefore, as America was facing a time of dramatic economic downturn, Chinese millionaires continued to move to the U.S., bringing millions of dollars with them. This money was then used to hire workers, pay for goods and services, and to help keep businesses afloat.

As much as this influx of wealthy Chinese immigrants can be beneficial it can also create problems in society. One problem is with long-term residents who feel like their cities are being commercialized solely for the purpose of financial gain. For example, people that have grown up in Arcadia have watched their hometown turn into a “Chinese Beverly Hill” with mansions that are not even occupied. As of 2010, it was reported that than 44% of Arcadia’s residents were Chinese (Bertrand, 2015). This report just shows how the Chinese population is starting to take over cities, which could further upset city natives. Therefore, it is evident that the thousands of wealthy Chinese immigrants that have settled in the U.S. have disrupted cities by attracting commercial development and expunging any remnants of a city’s history.

1x-1-2

Another potential problem that should be considered is that the growth that Arcadia is experiencing is not normal. The building of mansions has grown at a rate that does not seem to be sustainable. Therefore, we want to be conscious about how much money we are pouring into these projects, so that we can avoid any real estate bubbles in the future. If we continue building mansions we will either run out of resources or run out of buyers. Therefore, we must make a cautious effort to focus on only creating supply when there is demand.

As you can see, there are pros and cons surrounding the immigration of Chinese millionaires. Regardless, it is important to recognize the impact they have on the U.S. economy and society, in the hopes of finding a harmonious balance between the two. Immigration is a great way to encourage diversity and change; however, we do not want to promote too much diversity in a way that will drive out the people who inhabited an area first. Therefore, this balance is essential to creating a world where everyone can prosper

Works Cited:

Bertrand, Natasha. “This California Suburb Has Become a Haven for Wealthy Chinese

Residents.” Business Insider. Business Insider, Inc, 02 Feb. 2015. Web. 6 Oct. 2016.

Hawthorne, Christopher. “How Arcadia Is Remarking Itself As A Magnet for Chinese Money.”

Los Angeles Times. Los Angeles Times, 3 Dec. 2014. Web. 9 Oct. 2016.

VocativVideo. “The California Town Where Chinese Millionaires House Their Kids-and

Mistresses.” YouTube. YouTube, 05 Dec. 2014. Web. 2 Oct. 2016.

Wang, Jue. “Chinese Homebuyers Heat up LA’s Real Estate Market.” US-China Today. 4 Apr.

  1. Web. 10 Oct. 2016.

Wei, Lingling. “China Challenged to Keep Yuan Stable as Dollar Rises.” WSJ. Wsj.com, 16 May

  1. Web. 10 Oct. 2016.

Weise, Karen. “Why Are Chinese Millionaires Buying Mansions in an L.A. Suburb?”

Bloomberg.com. Bloomberg, 14 Oct. 2015. Web. 11 Oct. 2016.

Runaway Production & Film Incentive Programs

imgres

Runaway production is when film and television productions are filmed and produced outside of the U.S. or outside of Los Angeles. Productions are being lured in all directions to leave Hollywood due to film tax incentive programs. It is estimated the California lost over $9.8 billion dollars due to runaway production before crafting their own film tax incentive programs. The original California Film & Television Tax Credit Program that was passed in 2009 to be effective from 2011 to 2014 was a $100 million-per-year incentive plan. The program included a 20% tax credit for feature films and new television series and  independent film. This plan had a cap of $50 million for the films. The eligible films to receive the tax credits were chosen through a lottery system. This program is administered by State Film Commission called the California Film Commission (CFC). Their responsibility is to attract and retain motion picture production in California.

screen-shot-2016-11-03-at-8-26-21-pm

After the first program was made, filming in the LA region bounced back. According to the CFC, 229 projects were completed during the first film tax credit program and these projects received $447 million worth of tax credits. These projects went towards the total production spending in California that went up to $3.7 billion during that time period. The total, including the incomplete projects that received tax credits during the program, was that the $800 million tax credits under the program could be partly responsible for the $6.1 billion production spending in California between 2011 and 2014. But, it is estimated that about a third of the projects that received tax credits from the first program would have been made in California either way. This is what makes this program unclear of whether it was actually worth the money.

na-cd687_filmjo_16u_20141127133007

(Change thought to be from the original program)

6a00d8341c4eab53ef01bb09388d3d970d-800wi

This whole concept of California having a film tax incentive program stemmed from having to keep up with other states that created these programs first. Starting in the early 2000s states such as New Mexico, Georgia, New York, Louisiana and North Carolina started making film tax incentives. These states created these programs in hopes to start a new industry in their state to create new jobs and in turn boost their state’s economy.

imgres-1screen-shot-2016-11-03-at-8-39-34-pm

Georgia’s first tax incentive program was introduced in 2002. The state’s second and most progressive tax incentive, the Georgia Entertainment Industry Investment Act began in May 2005 and was later updated in May 2008. Their program has a 30% tax credit for films. The amount of tax credits Georgia has included in their programs has grown from $10.3 in their original Act to $504 million currently.

Another state that had a program early on was Louisiana. They enacted the Louisiana Motion Picture Tax Incentive Act in July of 2002. Their program included the the Investor Tax Credit of 30% for films with no cap and the Labor Tax Credit of 5% credit for payroll expenditures on Louisiana residents. From these aspects, this stimulated filming in the state and employment of their own residents.

images

As these states continued to tweak their programs, California wanted to tweak their original program as well. Hollywood wanted to pass a new incentive plan that included more money for films but it was difficult to show tax payers that the initial plan was worth the money in the first place and now it is even more difficult because the amount they wanted to include increased a lot. In order to evaluate the economic effects of a film tax credit program it is important to separate the new spending resulting from it and the spending that would have happened regardless of the credit program existed. In efforts to separate these and give tax credits to the projects that they actually need to target, their new incentive plan was tailored further. This plan further specified which project would get the tax credits in order for it to be more reasonable and effective in reaching its goal. The goal of the new program, the California Film & Television Tax Credit Program 2.0, is to keep the productions that are currently filming in California there and for new productions to choose to film in California. Another hope is for these financial incentives to make California competitive enough amongst other states and countries to show executives the benefits of filming in the L.A. region because of the access to experienced crews and the element of being close to their L.A. homes since the business is run out of Hollywood.

The program is a $330 million-per-year incentive plan which started in 2015 after being passed ultimately in August 2014.  

Some new features of the plan varying from the original:

-The length of the program is now a longer period of 5 years

-It expanded eligibility to films with larger budgets (over $75 million), TV pilots and 1 hour TV series

-It has a new ranking system for selection based on jobs and other criteria instead of the original lottery which could select any project randomly (this is a focus on job creation)

-Projects being filmed 30 miles outside of the Hollywood area would get a 5% boost to keep them in-state (this is targeted towards visual effects and sound studios in the Bay Area)

-It caps the amount of a movie’s budget that can earn tax credits at $100 million

images

From this program, the hope is also for these financial incentives to make California competitive enough amongst other states and countries to draw executives to see the benefits in filming in the L.A. region because of the access to experienced crews and the element of being close to their L.A. homes since the business is run out of Hollywood.

According to FilmLA, since the 2.0 program was enacted overall filming in L.A. went up by 11.4% in the first quarter of 2016 in comparison to the first quarter of 2015 when the new program began. They reported that L.A. had a total of 9,703 shooting days since it was enacted and the total shooting days in all of 2015 was 8,707 days. The peak was in 1996 with 14,000 shooting days (this can be a goal to hopefully get back to). The local unions in Los Angeles have reported that they have reached capacity employment as well according to FilmLA.

But, California’s program has very tough competition currently. Georgia has recently developed its own $2 billion film industry, which has led to the start of being coined as “Y’allywood”, or the Hollywood of the South. Georgia is ranked third in the U.S. for film production now and it is the fifth in the world. This can largely be due to the Georgia Entertainment Industry Investment Act which was most recently modified in 2008. From this Act, Georgia gives a 20% tax credit to any film that spends $500,000 or more there during production and 10% tax credit supply for including the state logo in the film’s credits. So Georgia gives a total of 30% in tax credits. This is just the baseline for those films starting at $500,000, a big difference in comparison to California’s plan. Other factors working for Georgia right now include its international airport, the biodiversity in their land for shooting and many new sound stages that have been built.

film-tv-credits-georgia-e1438031536153

(filmed in Georgia recently)

imgres-2

But, Georgia’s goal varies from California’s. Georgia hopes to make film a new industry in their state. This plan’s ultimate goal from the tax credits is to eventually attract enough companies and productions that will stay in Georgia long-term, instead of being in California or other competing states.

(California Film & Television Tax Credit Program 2.0. – made to counter-act the outcomes shown in the graphic above)

(California Film & Television Tax Credit Program 2.0. – made to counter-act the outcomes shown in the graphic above)

And it seems to be working so far. Ledger Enquirer newspaper states that, ” The state’s estimated $53 million tax credit for 2013 added over $6 billion to Georgia’s economic activity, with a growth rate of 55 percent. That’s quite a return on investment”. But the growth in Georgia could be seen as too much, because the film industry is growing so fast that there is a shortage of crew members for the productions. Local universities are adjusting their curriculum to prepare more workers for production jobs in the state, according to AJC Newspaper.

It is hard for California’s program to compete with theirs because they do not cap, more money is allocated to the program and it spans a longer period of time.

A drawback of the results so far from California’s 2.0 program is that even though there are more films being shot in California again, it is not the large ones. This is because of the cap. So these films still seek out the states or countries that do not cap their tax credit programs.

The tax credits included in the program are able to create below-the-line jobs (which are jobs such as lighting technicians, drivers, location managers etc.). The program doesn’t consider the expenditures on the talent which is a big part of a film’s budget (lead actors, directors and producers). The CEO of Independent Studio Services, Greg Bilson, stresses the importance of the consideration of “above-the-line” costs in tax incentive programs, “On an average $100 million film, 80 percent of that is above-the-line. That number will change depending on who’s in it, but even if it’s just 50 percent of the film, if the incentive doesn’t apply to half of a $100 million film, the California incentive compared to other incentives out-of-state and out-of-country is effectively half or less”. This is a contributing factor to why California’s program isn’t keeping large films in the state, the program doesn’t account for a huge portion of the budgets for those films. The high prices for permits, processing and fire department reviews in order to film on location in California are also inconvenient for production and can lead production to go elsewhere.

5467

According to the film industry trade publications such as The Hollywood Reporter, Deadline Hollywood and The Wrap, many states are decreasing the amount of tax credits in their programs. In my opinion, as other states drawback their own incentive programs, California should too. This is because California’s purpose of creating their program wasn’t to create a new industry in the state, like these states’ intention. Its purpose was to compete with the other states’ incentive offers, so if they are bringing down the level of the playing field, California should bring down their incentive program to that level.

Also, I believe that one of the ways to make California’s plan the most effective is if they gave producers something they can rely on for the future. With the plan only spanning over five years, the tax credit situation in California isn’t very dependable for a producer. Now, large productions can take a very long time to make and films can be in development for years while they are in the decision making process of where to film. If the program was over a longer term more companies would also want to invest in the film industry in California specifically and not elsewhere. Because digital media and streaming services have also started to take-off, possibly credits to keep them in California being added on-to the program could be a good idea for preventative measures so they do not leave in the future.

After the results and assessment of the 2.0 I do not think that the same program will be re-approved. I think that a new, scaled-down program involving less money will be made or the 2.0 will gain additions such as tax credits for digital and a longer time period. But, it is difficult to tell now what moves will be made with the effectiveness of the 2.0 being uncertain.

Works Cited

“Are Film Tax Credits Cost Effective?” The Los Angeles Times. N.p., n.d. Web.

By Julia Wick in Arts & Entertainment on Apr 19, 2016 10:37 Am. “Film Production In L.A. On The Rebound Thanks To Tax Credit.” LAist. N.p., n.d. Web. 11 Oct. 2016.

“California Analysts Office Report.” N.p., n.d. Web.

“California and Runaway Production.” Variety. N.p., n.d. Web.
“Costs and Benefits of Film Taxes.” Business Journals. N.p., n.d. Web. 11 Oct. 2016.

“Georgia’s New Hollywood.” Movie Pilot. N.p., n.d. Web.

“Irresistible Film Tax Credits.” Oz Magazine. N.p., n.d. Web.

Johnson, Ted. “Producers Say High Fees at L.A. County Parks Are Hurting Location Filming.” Variety. N.p., 22 Oct. 2014. Web. 11 Oct. 2016.

Lodderhose, Diana. “Runaways Welcome: Countries Offer Incentives to Lure Productions Fleeing Hollywood.” Variety. N.p., 29 Aug. 2013. Web. 11 Oct. 2016.

Michael Thom. “Fade to Black? Exploring Policy Enactment and Termination Through the Rise and Fall of State Tax Incentives for the Motion Picture Industry.” N.p., n.d. Web.

Michael Thom. “Lights, Camera, but No Action? Tax and Economic Development Lessons From State Motion Picture Incentive Programs.” Sage Journals. N.p., n.d. Web.

Paul Caron. “Starstruck States Squander $10 Billion In Film Tax Incentives Producing Minimal Economic Returns.” Tax Prof. N.p., n.d. Web.

“Runaway Production.” Wikipedia. Wikimedia Foundation, n.d. Web. 11 Oct. 2016.

Strauss, Bob. “California Film Incentives Take Spotlight, but Blockbusters Need Greenlight.” California Film IncentivesTake Spotlight, but Blockbusters Need Greenlight. N.p., 06 Aug. 2016. Web. 11 Oct. 2016.

Center, California, and July 2010. Film Flight: Lost Production and Its Economic Impact on California (n.d.): n. pag. Web.

Hall, Gina. “Why Is California Tripling Film and TV Tax Credits While Other States Slash Them?” TheWrap. N.p., 28 Aug. 2014. Web. 04 Nov. 2016.

Office, Legislative Analyst’s. California’s First Film Tax Credit Program (n.d.): n. pag. Web.


.


Brexit and Breadwinners: What leaving the EU means for the future of the UK workforce.

Behind the Vote

 Brexit. A coined term that filled Newsrooms, Facebook feeds, and local pubs all summer long.

Having joined the European Economic Community in 1973, the UK decision to revoke that membership on June 23rd sent shockwaves around the world, as countries questioned what the implications would be for their own economic relations and the European community at large. With ‘Leave’ capturing the vote by only 52% to 48%, the decision was highly controversial and has continued to cause market anxiety in the months since.

The unknown implications of Brexit on the workforce was a key issue heading into the vote, as many economists argued that a decision to leave would trigger an economic reversal in the UK. This meant that if the UK were to ban EU migrants from working in the UK then it could potentially create more employment opportunities for nationals.

With EU workers accounting for 6.6% of the workforce, the referendum drove voters to ask serious questions about long term job security and availability. Would Brexit make it easier for young people to find jobs in the UK? Would wages increase as the result of a decreased supply of labor? What would happen to those jobs of migrants forced to leave? Where will the UK stand in terms of the international workplace?

Some economists predicted that in the short term, organizations would choose to either transition their operations overseas or put a hold on hiring new employees until there was more economic certainty. Both scenarios would decrease labor demand, which could have an impact on overall employment levels.

However, it was and continues to be extremely difficult for economists to predict the outcome of the decision, as UK was the first nation to leave the EU and therefore was no precedent to compare it to. Similarly, if the UK had decided to ‘remain’, its trade and economic relationships with other EU countries could have been severely damaged due a lack of trust and increased tension.

In speaking about this uncertainty, Jurga McCluskey, head of UK immigration at Deloitte said, “Nobody really understands the complexity of leaving the EU because no one has ever left the club… If we leave, the landscape for immigration will change significantly — it won’t be so much what we do but who we chose to work with. Who will those migrants be?”

picture1

Immigrants and Employment Skill Levels

According to research by Oxford University’s Migration Observatory, as of June 2016, there were 2.2 million EU workers in the UK composing for 6.6% of the total workforce. Of that number, 10% were employed in the manufacturing sector and 8% were in retail, hotels and restaurants. Due to the fact that the UK relies heavily on EU workers to fill low-skilled roles, the vote has insinuated anxiety for both employers and employees across various industries.

The Oxford research also found that prior to the vote, three-quarters of EU citizens working in the UK would not meet visa requirements for non-EU overseas workers. As shown in the chart below, low-level jobs were not the only ones at risk, with EU workers in the banking and finance sector showing projected ineligibility levels of 65-70%.

picture1

This is significant because once law makers clearly define what the immigration policy will be, it will affirm the governments “vision” for the post-Brexit economy.

But do UK nationals really want those jobs?

While many argue that that Brexit will supply a large number of low-level jobs for UK nationals, we must also consider whether or not people are actually going to be willing to take them?

In a conversation with Amy Smith, a student at the University of Sheffield, she expressed her concern saying:

‘Having grown up in Germany I witnessed the benefits of immigration first-hand. Immigration is important for the job market – especially since Germany’s demographic structure shows a larger aging population. Because of this, Germany doesn’t have enough young people to fill all of the positions which are becoming available as more and more of the last generation retire. Immigrants are vital for filling the low level positions German natives are less willing to take. I think the UK needs to recognize that the same implications can and will happen here.’

This issue was further discussed by economist Jonathan Porte who described the demand for immigrant’s jobs as not being just a zero-sum game. In an article published by the Guardian he explained, “it’s true that, if an immigrant takes a job, then a British worker can’t take that job – but it doesn’t mean he or she won’t find another one that may have been created, directly or indirectly, as a result of immigration.”

This ties back to the idea that if the demand for certain jobs never existed, will the Brexit decision really change that?

 Current State of the Workforce

 It has been three months since the June 23rd vote, and economic numbers are showing more promise than expected. Although there was widespread fear that a decision to leave the EU would cause widespread job losses, economic data following Brexit is saying the opposite.

According to an August 2016 report by Telegraph, the post-Brexit economy saw a decrease in unemployment, an increase in consumer spending, and a government budget surplus. In July, the UK unemployment rate was at 4.9%, its lowest rate since 2005, and this number has remained unchanged according to August and September data.

screen-shot-2016-10-11-at-5-06-15-pm

So with these economic forces showing positive signs for the UK, does this mean that the workforce still has to worry?

Maybe not so fast.

While UK employment continues to rise, the country has seen a sharp rise in inflation which poses a major threat to job levels and wages. An August report showed that the UK’s CPI rose to 0.6% which was higher than expected, being up from 0.5% in June.

The Office of National Statistics spoke on this issue saying, “while there was no sign of the plunge in the value of the pound having an impact on CPI, the producer prices index (PPI) show that sterling’s slump had pushed up the cost of imports for British manufacturers, which could fuel inflation down the line.”

An increase in inflation could potentially affect the UK’s employment rate going forward, as the uncertainty of market can lead to lower investment and lower economic growth in the workforce. Furthermore, inflation can also trigger a lower export demand which could cause unemployment in various trading sectors.

 Due to the fact that the official removal of the United Kingdom from the European Union may not happen for some time, economic uncertainties will continue to dictate discussion among economics and politicians alike.

Until Parliament makes an official decision on Brexit’s terms, workers and immigrants across the UK must patiently wait… and hope that the decision to leave didn’t take their jobs with them.


 Sources: 

https://www.ft.com/content/953671ba-b784-37f6-8f29-45402e846d50

https://www.theguardian.com/business/2016/aug/17/uk-unemployment-claimant-count-falls-after-brexit

http://www.telegraph.co.uk/business/2016/08/19/what-brexit-apocalypse-no-sign-of-economic-woe-after-the-referen/

http://www.independent.co.uk/news/business/news/brexit-uk-economy-eu-referendum-result-jobs-employers-hiring-a7191381.html

https://www.ft.com/content/3d0de756-1764-11e6-b197-a4af20d5575e

http://www.independent.co.uk/news/uk/politics/points-based-immigration-system-theresa-may-explained-brexit-referendum-australia-a7227001.html

How does Supply and Demand affect the Change in Oil Prices?

The introduction of technology through a variety of platforms has greatly affected a number of different industries, including automobiles and oil production. Technology has changed the automobile industry through the introduction of electric vehicles (EV) and modernization of fracking practices. According to an article in BBC News, “Fracking is the process of drilling down into the earth before a high-pressure water mixture is directed at the rock to release the gas inside”. In correlation with increased technology and automobiles, is the concern over oil prices for the general public and corporations. Although oil prices are impacted by many things, from technology such as fracking, to war and peace in conflicting regions, the main contributor is the battle over changes in supply and demand.

Significant economic events will also impact the amount of oil consumption. For example, Iran’s re-emergence into the world’s top oil producers will help to increase supply, which could eventually surpass demand. When supply is greater than demand, prices of oil will decrease so that people will be attracted to buy more gasoline at that moment. This will also be used as a tactic during times of economic turmoil, when the general public does not have the funds to spend money on gas. During the Financial Crisis of 2008, people were so worried about the outcomes of their financial inve150710-us-petroleum-consumption-voxeu-chart
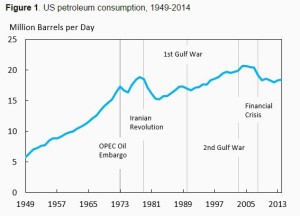
stments that they saved all the extra money they had for necessities. People decided to make the switch from driving their own cars to using public transit as a means to save money. As seen in Figure 1, the
re was a decline in US petroleum consumption between the years of 1949 to 2014 after each war and econ
omic crisis. The average price per gallon of gasoline in the United States fell from $4.08 in June 2008 to $1.61 in December 2008. A shortage of demand for the supply that was available, created a surplus in gasoline and the need for a reduction in prices. As a result, there is a direct correlation between world economic events and supply and demand of oil, leading for a change in prices.

Over the last several years, United States production of oil has nearly doubled. This has lead to more competition, forcing Middle Eastern exporters to find new areas to sell to. Although Russia has constantly been through economic issues, it continues to hold its rank as the number one oil producer. The current price of crude oil hovers around $51.18 per barrel according to Reuters. In comparison, a barrel used to sell at above $100 at the midpoint of 2014. It is believed that this is a result of large oil companies reducing investments in new technology and exploration for new oil. According to a research report produced by RBC Capital Markets, “projects capable of producing more than a half-million barrels of oil a day were canceled, delayed or shelved by OPEC countries alone last year, and this year promises more of the same.” To reiterate the question that people ask of what drives a change in oil prices, it is a result of supply and demand, but as a result of competition. Companies are pulling out of new opportunities to find oil because the costs outweigh the benefits. In the past, drilling for oil created a cash cow that families like the Rockefeller’s were able to establish untouchable fortunes as a result. Surging United States’ production of oil has created cheaper prices for Americans due to cheaper transportation and importation costs and the ability to export oil to other countries. With increased competition among corporations and on a global level between countries, the supply for oil is increasing at a rate that demand is unable to keep up with.

The introduction of electric vehicles has increased competition among the automobile industry. EV sales are increasing month-to-month in comparison to the same month during the previous year. However, this is not enough to keep up with total vehicles sales. The introduction of electric car dealerships, such as Elon Musk’s Tesla, has created a new target market for those who want to drive environmentally friendly vehicles. Total vehicle sales have increased from 2009 to 2016 by about 74.5%. September U.S. auto sales reported strongly at 17.8 million vehicles. Total electric vehicle sales during the month of September was reported at just below 17,000 units. The previous numbers are important to refute rumors that an increase in electric vehicles on the road will lead to a decline in oil prices. Ryan Lance, CEO of ConocoPhillips, stated that EVs “won’t have a material impact for another 50 years”. Yes, there is major growth in the industry and an increase in population of people who are looking to buy plug-in vehicles, but there is not enough competition to all-gasoline cars to disrupt oil production.

The Organization of the Petroleum Exporting Countries, also known as OPEC, plays an important role in determining the supply and production of gas. The oil minister of Saudi Arabia, Ali al-Naimi, is determined to keep oil production consistent in 2014. OPEC has the power to decide to cut production as a means to increase prices and revenue. Mr. al-Naimi firmly believes that keeping oil prices where they were would help to stimulate global economic growth. To show the rarity of reducing production, back in September, members of the organization agreed to cut production for the first time in over eight years. Fast forward to today, Russia’s Vladimir Putin showed support for OPEC’s proposal to “freeze oil production in order to reverse the slump in global prices”. He stated that oil prices have decreased by more than 50% in two years due to surplus production. Not only would freezing oil production raise the low prices of oil, it will also help to prevent price fluctuations in the future. Putin is in favor of freezing production, or reducing supply, to raise prices so that Russia can remain the dominant power of the oil industry. Currently, oil and gas make up 70% of the entire country’s export incomes, resulting in a decrease of about $2 billion for every dollar that oil prices fall. The organization is aiming to cut about 700,000 barrels per day at its next meeting on November 30, 2016 in Vienna, Austria. Many nations fail to reach agreements at these meetings because they are greedy or are involved in political battles with one another. For example, the proxy war between Iran and Saudi Arabia, two of the world’s largest producers of crude oil, has created tensions that would force them to refuse agreement in order to prove a point. There is no question over the strength of OPEC and its ability to make a decision that could either raise or cut the price of oil. However, as mentioned previously, the simple issue over whether prices will be increased or decreased comes down to worldwide supply and demand.

There is not a single, clear-cut answer to determine what the main force behind the change in oil prices are; however, we can correlate the change to surpluses and deficits in supply and demand. Economic events, such as the Iranian Revolution in 1979 and the Financial Crisis in 2008, were main contributors to changes in supply and demand for oil. The revolution created an oil shock throughout the United States, when oil exports were severely cut from Iran, decreasing supply. The economic crisis in the U.S. affected the other end of the spectrum, leading to a decrease in demand from oil consumers throughout the nation. Competition amongst oil producers around the globe has increased significantly over the last decade, forcing companies to slash prices in order to attract buyers for an excess supply. Lastly, OPEC, the dominant oil production coalition, has the most control over the oil industry and the ability to make decisions regarding prices and production. Talks about freezing production are lingering throughout Europe, specifically Russia, with hopes to reduce the supply and increase prices. Overall, each example provided refers back to the simple economic principles of supply and demand. When supply is greater than demand, prices go down; and, when demand is greater than supply, prices go up. Oil consumption and production are resulting forces of supply and demand.


Works Consulted

BBC News. “Opec Oil Output Will Not Be Cut Even If Price Hits $20.” BBC News. N.p., 23 Dec. 2014. Web. 10 Oct. 2016.

Cox, Lydia. “The Surprising Decline in US Petroleum Consumption.” World Economic Forum. N.p., 10 July 2015. Web. 10 Oct. 2016.

EIA. “U.S. Natural Gas Total Consumption (Million Cubic Feet).” U.S. Energy Information Administration. N.p., 30 Sept. 2016. Web. 11 Oct. 2016.

Krauss, Clifford. “Oil Prices: What’s Behind the Volatility? Simple Economics.” The New York Times – Energy & Environment. The New York Times, 29 Sept. 2016. Web. 11 Oct. 2016.

Reuters. “Auto Sales Down in September Even After Bigger Dealer Discounts.” Fortune – Auto. N.p., 3 Oct. 2016. Web. 9 Oct. 2016.

US Energy Information Administration. “World’s Top Oil Producers.” CNNMoney. Cable News Network, 22 July 2016. Web. 10 Oct. 2016.

Wise, Alana. “A Legendary Investor Thinks Electric Cars Will Raise the Price of Oil.” A Legendary Investor Thinks Electric Cars Will Raise the Price of Oil. N.p., 25 Sept. 2016. Web. 27 Sept. 2016.

Wanda’s Hollywood Ambition

Wang Jianlin, the richest man in Asia, is trying to change the balance of power in the global entertainment business. As the head and the founder of the largest Chinese commercial property company Dalian Wanda Group, Wang has made decisions to spend billions to buy his way in Hollywood. After the company became the world’s largest cinema chain operator in 2015, it announced several other acquisition and partnership with major Hollywood Studios. While facing critics and doubts, the company is not hiding its ambition to become a global entertainment colossus.

1448348228208472_480_320

Both Wanda and Hollywood are facing opportunities and concerns. To Wanda, it is shifting focus from property development to entertainment, hoping to start a new chapter of its business legend. Since 2012, Wanda has spent more than $10 billions to invest in everywhere from worldwide theater chains to Hollywood studios. But it takes time to define whether these are financially smart decisions. To Hollywood studios, having Wanda and other Chinese investments backing their projects means they have capitol to make the film they want to make; more importantly, they have access to the restricted Chinese film market. But at the same time, it raises concerns that Chinese might start to have too much influence over Hollywood.

According to Forbes, the 61-year-old Chinese businessman Wang Jianlin has a net worth of $32.8 billion as of November 2016, and his company’s assets amounted to over $90 billion. Before it made its moves on Hollywood, Wanda Group primarily focused on its commercial properties. Founded in Dalian, China in 1988, Wanda first started as a residential property company. To date, Wanda has established 160 commercial shopping malls throughout China.

Starting 2012, the company decided to shift gear to entertainment. Wanda Cultural Industry Group, founded in 2012 and became one of the company’s main focuses, has already become the largest entertainment company in China. Prior to the cultural group, Wanda established its film division, Wanda Media in 2010, which has already become the largest private Chinese film production company. It seems like the company has an obsession of becoming “the largest” or “the best,” and yes, the cultural group aims to become one of the top five entertainment companies in the world by 2020.

1369639580692849

This is an aggressive ambition. In hope to make it happen, Wanda followed up with a serious of direct investments, starting with its acquisition of AMC in 2012.

In September 2012, a byline started to appear underneath every AMC logo: A Wanda Group Company. Wanda spent $2.6 billion on this acquisition. AMC was the second largest movie theater chain in the United States at the time, and has over 5,000 thousand commercial movie screens in the U.S., out of a total of 40,759, and the acquisition has made Wanda the largest cinema operator in the world. However, prior to the purchase, theater operators in the U.S. were facing big challenge from low attendance rate. According to New York Times, attendance in North America 2011 fell to $1.28 billion, which is the lowest since 1995. At that time, it was unclear what caused the downfall, but theater certainly didn’t seem like the best investment that would earn Wanda much quick money.

Is it really a good deal for Wanda to buy AMC? At least Wang Jianlin thinks it is.

“It doesn’t matter how much money we make,” Wang was quoted in a Forbes interview. Perhaps rather than getting instant return, his vision is more towards making Wanda a globally known brand. In fact, the act of purchasing AMC had gotten Wanda and himself immediate public exposure. All of the sudden, Western media are writing about a Chinese entertainment company. From a public relation point of view, this is a long-term investment that comes with “free” advertisement.

(120905) -- LOS ANGELES, Sept. 5, 2012 (Xinhua) -- Chairman and President Wang Jianlin (R) of China's Dalian Wanda Group Co. and AMC chief executive officer and president Gerry Lopez attend a press conference at an AMC theater in west Los Angeles, the United States, on Sept. 4, 2012. China's leading private conglomerate Dalian Wanda Group Co. on Tuesday completed a high-profile acquisition of AMC Entertainment Holdings, Inc., valued at roughly 2.6 billion U.S. dollars, in Los Angeles. (Xinhua/Zhao Hanrong) (nxl)

Moving on to 2015, Wanda spent another $3.5 billion on Legendary Entertainment, one of the biggest filmmaking studios in Hollywood. In the past, Legendary had co-produced many well-known movies including “Jurassic World” and “Interstellar.” Some of its productions are more popular in China than in the U.S., such as “Godzilla” and “Warcraft.” The company’s future productions will likely include more Chinese elements and characters not only because it is now owned by a Chinese company, but also because of the access of the huge Chinese market. The number of movie screens in China has been increasing dramatically since 2009. As of 2015, China has 31,882 screens, which is more than triple to the number in 2011.

%e5%b1%8f%e5%b9%95%e5%bf%ab%e7%85%a7-2016-11-07-%e4%b8%8a%e5%8d%881-00-27

Legendary’s upcoming production, “The Great Wall” will release in February 2017. Directed by Chinese director Yimou Zhang and starring Matt Damon, the movie will be distributed by Universal Pictures and two other Chinese distribution companies. This is a giant Hollywood production produced by a Chinese production company – although it wasn’t Chinese until last year.

Just two months after acquiring Legendary, Wanda paid $1.1 billion in cash to settle a deal with Carmike Cinemas, adding 2,954 screens to the AMC family, making it the largest theater chain in the world. The stock prices for both Carmike and AMC raised a little bit right after the purchase, signaling a good start for the merger.

Soon after the deal with Carmike, Wanda tried to make a deal for Paramount. Earlier this year, Paramount was looking for a party to buy 49 percent stake of the studio. Wanda was interested in making about $1 billion equity investment. However, after months of talking, Viacom abandoned the plan to sell in September. In response, Wanda almost immediately announced a partnership with Sony. The exact size of this negotiation was not released, but it is likely to be a smaller investment that won’t give Wanda a lot of initiatives on Sony’s strategic decisions. The company will now provide 10% to 15% in co-financing on some of Sony’s films, including the upcoming production “Passengers.” It will also be Sony’s strongest support on film distribution and marketing in China.

As of now, two months after partnering with Sony, Wanda announced another acquisition for Dick Clark Productions, offering about $1 billion. Dick Clark Productions had produced many television shows and awards, including the Golden Globes and “So You Think You Can Dance.” This acquisition marks Wanda entering the world of television production.

The series of intensive movement is causing lawmakers concern. They are worried that the company’s decisions might have been made in favor of the Chinese communist party, which may perform a “foreign propaganda influence over American media.” Traditionally, Chinese’s cultural presence has not been very strong. So the government has made “enhancing China’s soft power” as one of its priorities. The concerns seems logical especially when Wang Jian Lin is a businessman with a communist party background.

china-hollywood-featured-image

Wang Jianlin explained his business motivation at Wanda’s L.A. Film Summit in October. “Chinese box office revenue has the potential to maintain an annual 15 percent growth for about a decade,” Wang said. By acquiring American companies, he is not only bringing technology and talent back to China, but also opening up the market for the American content. Wang believes his investments will thus be beneficial. And if Hollywood wants a share of this giant market, it needs cooperation with Chinese companies, and it needs to have better understanding in Chinese audience.

Hollywood isn’t the only place Wanda invests in. At the summit, Wang also encouraged Hollywood Filmmakers to come to Wanda’s new movie studio in Qingdao, China. Said to be the largest movie studio in the world, the Qingdao Oriental Movie Metropolis is aiming to rival Hollywood. Situated on a 494-acre site, the studio complex costs Wanda $8.2 billion to build and will open in 2018.

Wanda is not the only one to invest in Hollywood. Other Chinese conglomerates, such as Alibaba and Tencent, have also expressed interest. On Monday, Oct.10, Alibaba announced a partnership between its subsidiary Alibaba Pictures and Steven Spielberg’s Amblin. Earlier, Chinese internet giant Tencent and Hong Kong based information and communication technology company PCCW had also said they would invest $1.5 billion to STX Entertainment.

All those Chinese investments signal greater Chinese influence in Hollywood. However, by far Wanda seems to be the only one determined to enter the game as a main player. All together, Wanda has spent about $10 billion on investment in Hollywood, and certainly is willing to spend more to seal deals with Hollywood giants. Even for a man like Wang Jianlin, that’s still a lot of money. Only one thing can be certain, that the entertainment industry has become one of Wanda’s main strategic focuses. The company said it would become one of the five cultural enterprisers in the world by 2020, and it is keeping up with its ambitious vow.


Other Reference:

http://www.voachinese.com/a/wanda_purchasing_20120716/1405262.html

http://www.theepochtimes.com/n3/2089188-chinas-hollywood-takeover/?utm_expid=21082672-12.JPI1vw8-RKyYhrWpuuXhuA.0&utm_referrer=https%3A%2F%2Fwww.google.com%2F

Wanda’s Legendary Buy Is Just the Beginning of China’s Investment in Hollywood

http://yuleyingtang.baijia.baidu.com/article/649735

http://www.wsj.com/articles/chinas-dalian-wanda-buys-legendary-entertainment-for-3-5-billion-1452567251


How does the fluctuation in fuel prices affect automakers’ sales?

From the second quarter of 2014, there has been a sharp decline in global fuel prices, which not only meant a lot of extra money being saved for vehicle owners, but also meant major changes in the sales and profits of automobile manufacturers. Vehicles and fuel are dependent on each other, and the price and demand for one affects the price and demand for the other. The fuel industry is driven by car sales, and changes in fuel prices also greatly impact consumer spending on vehicles, which in turn affects the revenues and profits of automakers. There are different ways in which automakers can be affected by volatility of oil prices. Changes in oil prices affect overall consumer spending and behavior. Also the sales of fuel-efficient, high fuel consuming cars and alternative fuel cars are affected differently when hit by a substantial increase or decrease in oil price.

The trend in oil prices for the past three years is shown in the following graph published by the NASDAQ stock exchange.


untitled

The last three quarters of 2014 is the crucial period that is to be focused on when exploring the correlation between declining fuel prices and vehicles sales and profits made by manufacturers. A more comprehensive view of these quarters as compared with its previous years can be seen in the following graph.


graph

The average oil price decrease through 2014 has greatly impacted consumer spending and saving. When oil prices go down, consumers think they are inevitably saving a lot of money. In a paper published by NACS, Jeff Lenard elaborated that fuel is a commodity that is intertwined into an average citizen’s everyday life and changes in fuel prices fundamentally impact consumer spending and behavior in different ways.

Firstly, some consumers might change their driving habits. When asked through a NACS survey why people were driving more when compared to the previous year, the answers by people from different genders and age groups were very close to the results summarized in the table below.

It is evident from this table that lower gas prices were 40% of the reason why people chose to drive less and these people were almost equally distributed throughout all the age groups. Hence this indicates that fuel prices have an affect on consumer spending and consumer behavior, which is critical to the sales of the automobile industry.

Secondly, consumers are sometimes able to make decisions on weather they will reduce their driving if gas prices increase. A different survey, also conducted by NACS explored this issue and asked people how much would oil prices have to increase for them to lower the number of miles they drive, and the results were summarized in the graph below. The graph below illustrates the average gas price for each month and the increase in the oil price that would have to occur for consumers to start reducing their driving. Most results show that if oil prices were even $1.00 more per gallon, there would be a direct effect on the number of miles driven by vehicle owners.

bar-graph

During changes in fuel prices, not only is consumer behavior changing accordingly, but people also feel differently overall about the economy which affects every industry, and the automobile industry is especially hugely affected by this. The overall feel of an economy is a subjective term that can be defined by varying characteristics. For example, it could be defined by many characteristics, like economic recessions, decline in the stock markets, or political instability. However, it could also be measured by more specific factors like decline in oil prices. For example a survey that asked target customers during 4 different years (with distinctive oil prices) about how they essentially felt about the economy, their response reflected that the there was more optimism in the economy within people and their consumer behavior during the periods of sharpest decline in oil prices. The outcomes of the survey are presented in the diagram below.

diagram


When people have a positive attitude towards the economy because of decline in fuel prices, they tend to be more liberal about spending money, because as mentioned previously, they think they are certainly saving money on gas (vehicle owners). As a result, this benefits the retail industry, and the sales and profits of automobile manufacturers are impacted in an interesting manner.

The data pertaining to light weight vehicle sales and oil prices throughout the years is displayed in the graph below.

1

It is evident from the graph the fluctuation in oil prices is not directly consistent with the sales of light weight vehicles. However, it would be useful to breakdown the broad category of these vehicle sales into categories to analyze the trend in detail, firstly, small light weight cars, secondly big SUVs and trucks and lastly hybrid or electric vehicles that do not run on fuel.

2

Small vehicles that have a high mileage, which means they drive for a high number of miles for the amount of gallons of fuel, and these vehicles are usually the more fuel-efficient vehicles. Fuel-efficient vehicles usually have higher sales during of periods of rising or high oil prices.

As can be seen in the graph below that is comparing fuel prices and sales small fuel-efficient car sales, the trends of both have been very similar. There is a direct correlation for the trends of oil prices and sales of small cars from 2010-2014.

3

The second category of cars that can be explored is large cars that include SUVs and trucks. These large cars are usually gas-guzzlers, which means they give a lower number of miles for a certain amount of gallons of fuel and hence consume a lot of gas. The trend between large car sales and oil prices from 2010-2014 can be seen in the following graph.

4

There is not a consistent relationship or trend between changes in oil prices and sales of large cars. For example, there is a major decrease in sales of large cars in the second and third quarter of 2010, but there is a decrease in oil price in the second quarter and increase in the second quarter. Also during the last two quarters of 2013, when the US was progressing towards recovering from the financial crisis of 2008, there was an increase in fuel prices but large car sales were slowly diminishing: which could have been because of their low mileage and fuel efficiency. During the period of decline in oil prices, the sales of large cars did not increase. It continued to decrease, but at a much lower rate. This shows that oil prices are not the sole factor that determine or influence car sales, especially in the large cars/SUVs segment.

The third and final category of automobiles that can be explored is the alternative fuel (electric or hybrid) vehicles. Within alternative fuel vehicles, there are electric cars and hybrid cars. Only about a little less than 1% of households in America drive an EV, so though they do not have a very significant contribution towards the automobile industry, it is extremely important to consider EVs, especially when comparing its trend with fuel prices, because EVs are the primary potential solution to the energy and fuel crisis. Analyzing the trends of sales of EVs is important because they are a key alternative to fuel run cars that will face a major crisis in the future.

The following graph shows the trends of oil prices as compared with electric vehicles, and there is almost no correlation between the two. However as mentioned before, electric vehicles only make up less than 1% of total car sales, and how oil prices affect EV sales would not drastically matter for the automobile industry as a whole.

5

Hybrid cars are cars which combine the systems of both a conventional fuel run engine and an electric vehicle. Hybrid cars make up a larger percentage of the automobile industry than electric vehicles. The graph below quantitatively compares the trends of changes in oil prices and sales of hybrid cars.

6

It can be inferred from this graph that the sales of Hybrid cars have been quite coherent with changes in oil prices, except for in the last few quarters of 2011. Similar to the trend in small cars, hybrid cars are also considered very fuel-efficient. Hence their sales go up as fuel prices go up because they do not require as much fuel to run for the same number of miles as other cars, and when fuel prices decrease, consumers inevitably think they are saving money and opt for bigger gas guzzler cars, reducing the sales of hybrid and small fuel efficient cars.

In conclusion, to answer the research question posed at the very beginning of this composition: fluctuations of fuel prices do affect car sales, but very distinctively for different categories of cars. Changes in oil prices both directly and indirectly affect car sales. Fuel prices directly affect car sales when trends in sales of a certain type of car changes correspond to trends in oil prices (for example small cars and hybrid cars). Changes in fuel prices indirectly affect sales of cars by influencing consumer spending and behavior, which is in turn reflected in every retail industry, including sales in the automobile industry. Fuel and cars are almost like complimentary goods from an economic perspective and hence the connection between oil prices and car sales is significant. Consumers’ decisions to purchase certain types of cars is however not solely dependent on fuel prices. A vehicle buyer takes a lot of different factors into account before buying a certain type of car. Also, with the swiftly progressing nature of technology, hybrid cars and electric vehicles have been revolutionizing the nature of the automobile industry. Though EVs do not make up a large percentage of car sales, hybrid cars, especially the Toyota Prius have been becoming increasing popular. Another interesting element to consider could be that many of the self driving cars being built by Uber have been focusing on increasing fuel economy, reduce oil use and curb carbon emissions, according to an article in the wall street journal, written by a former energy advisor for the government. This could also make car sales and decisions made by consumers less dependent on fuel prices. However, driving habits itself have been affected since the initiation of Uber, and car sales have been affected since, so it would be intriguing to see how much further effect the introduction of self-driving cars by Uber have on car sales. Nevertheless, fuel prices continue to affect sales of automobile manufacturers in a substantial manner.

Sources:


http://www.usatoday.com/story/money/2015/08/03/nissan-us-sales-up-8-big-vehicles-soar/31046075/


http://www.fuelsinstitute.org/researcharticles/fuel-prices-auto-sales.pdf


http://www.nacsonline.com/YourBusiness/FuelsCenter/Pages/2016-Retail-Fuels-Report.aspx


http://www.lazardnet.com/docs/sp0/18334/USConsumerAndCorporateBehaviorInALowOil_LazardResearch.pdf


http://www.nacsonline.com/Media/Daily/Pages/ND1114144.aspx#.V_xRSenBzzI


http://www.nacsonline.com/YourBusiness/FuelsCenter/Documents/2016/Consumer-Sentiment.pdf


http://www.ucsusa.org/clean-vehicles/electric-vehicles/bev-phev-range-electric-car#.V_1LV-nBzzI


http://blogs.wsj.com/experts/2016/04/27/how-driverless-cars-might-actually-harm-the-environment/


Ameliorating California’s Drought Crisis with a Water Market

Ninety-seven percent of the world’s global water supply is salt water and of the 3% remaining, only 1% is available for human consumption. Economics is all about scarcity, and like any other scarce resoruce, water and water shortages can create investment opportunities.

The introduction of a water market in the United States – specifically in the western region of the nation, where demand is increasingly high and supply (conversely) is shrinking – could potentially aid water crises in states like California, which has a history of shortages and droughts.

In countries like Australia and Chile, where water-trading markets have already been implemented, water usage has decreased dramatically, while simultaneously curbing waste. There — of course – have been issues raised among critics, who view the trading of water rights as a privatization of water and an attack on the commons, whereby only those who can afford and are willing to pay for the commodity are given access to a life– supporting resource. These concerns can be addressed with proper policy making that will guarantee a minimum supply to households.

california-drought-riverbed-ap_1901880237170-fb

Australia has the largest system of water trade in the world. The development of the nation’s water-trade market came about as a response to severe drought and water shortages.  The country introduced its market in 1983 as a way of reallocating the resource to sectors that demonstrated the most need and productive use of the resource. Citizens are given rights to a share of the water that is available in the Murray-Darling basin, located in South Australia, annually. Instead of basing allocations off of a specific quantity, the shares system reflects appropriate amounts of water actually available in the Murray-Darling during a given year. Australia’s Market is highly regulated and operates on a cap-and-trade system that sets a limit on the amount of permits given to water extractors and irrigators and creates a market for the resource.  The first “pilot interstate water trading project” launched in 1998 and made the trade of permanent water entitlements possible.  Today, a growing number of temporary, usually annual, trade allocations take place through the use of electronic exchanges and third parties, such as lawayers and brokers.  Cap-and-trade is commonly used in environmentally minded economic policies as a mechanism for controlling the amount of impact on the environment. The European Union attempted an approach to controlling greenhouse gas emission via a cap-and-trade policy, but the program is generally regarded as a failure due to an over issuing of permits that created an ineffective system where there was no need to buy or sell the emission permits (Sky News).

The cap in Australia’s case is the amount of water available for use.  Water is distributed via water rights administered by the country’s governing body. For Australia, the system resulted in a reduction of waste in overall water usage because it accounts of yearly rainfall and shortages.  In years where the country faced particularly dry weather conditions or drought, the price of water rose but the number of trades off-set the rise in price: “People used the market to move water where it was needed – and valued – the most. Water-intensive crops such as cotton and rice were temporarily phased out as the water needed to grow them became more valuable than the crops themselves,” (Lustgarten, The Atlantic).  The average price of temporary water rights has for the most part flucuated between $10 and $85 a megaliter (Curran, Forbes).

The water market has essentially allowed the users themselves to make decisions – rather than political bodies — about water usage. In doing so, Australia’s use of water supply has created financial incentive for smarter use: “Farmers in an irrigation district that had porous dirt ditches, for instance, began to line them with concrete, saving millions of dollars’ worth of water that would have otherwise seeped into the earth,” (Lustgarten, The Atlantic).

Similar ways of reducing water usage and cutting waste could be utilized in agricultural regions of states like California. In fact, modern technology has been developed to cut water use by up to 50 percent, though farmers are not motivated to adopt these technologies because of the current water laws set in place. California’s state water law was established in the 19th century during the height of the gold rush, “based on the old miners’ code: first in time, first in right,” (Coy, Bloomberg Businessweek). This prior-‘appropriate water rights doctrine’ – now over 160-years-old – gives first dibs to the first person who takes a quantity of water from a source for “beneficial use.” In doing so, it gives that person the right to continued use of that quantity from the source, for his expressed purpose.  There is essentially a use-it or lose-it mentality that has de-incentivized users to conserve.

screen-shot-2015-05-01-at-11-33-48-pm

(Johnson, Grist)


The current market California operates on has had some success, but because of ambigouty in the out-of-date laws, it is hard for sellers to prove the water they are selling is legally there’s, which have left many potential buyers and sellers ambivalent about entering into trades. If water policies were modernized to reflect the current economic priorities via measures like the implementation of a water market farmers may feel more encouraged to sell off their surplus, rather than let it go to waste.

An additional problem raised by California’s agricultural sector is the economic out-put ratio of water consumption. Farms in the state consume 80% of water while only generating 2% of gross domestic product for the economy. While the agricultural sector is intertwined with other economic categories, such as transportation and warehousing and finance and insurance, which — to a degree –rely on the thousands of farms that utilize their services, there can simply be no arguing the disparity in amount of water usage in the agricultural sector (Ross, Los Angeles Times).

Water markets could check the use of water, shifting agricultural production toward higher-value crops and away from low-value crops that often demand higher amounts of water. Like in the case of Australia, rather than displace farmers by limiting access to available water, the water market could lead to a behavior change in the agricultural sector, especially in areas plagued with drought, by encouraging a switch to crops with higher-value and/or lower demand for water. For example, decreasing the amount of alfalfa crops, which require a large sum of water and can be produced in states with richer supply, while increasing the amount of vineyards and tomato crops, could improve the gross domestic product of the agricultural sector.

Clarifying water rights is a necessary step towards solving California’s drought crisis. Laws that are concrete and clearly defined will make trading water a whole lot easier because, in order to trade, stakeholders must first understand what it is they are selling. A state law passed in 2014 aimed at regulating and monitoring the pumping of groundwater in the state is indicative of steps being taken by the government to enact a regulatory body for the resource. However, these laws will not take full effect until 2040 (Coy, Bloomberg Businessweek).

In the meantime, improving the information about water availability and calculating how much can be utilized without harming the environment would paint a clearer picture of how the resource should be managed. Additionally, building a central regulatory system and repository of information could aid in the establishment of appropriate water valuation (Hanak, Public Policy Institute of California).

The state has already experiment with a cap-and-trade program to cut greenhouse emissions.  The program, which began in 2014, has efficitively reduced overall pollution and is on track to achieve 1990 levels by 2020, a more than 15% reduction from 2015 (Hiltzik, The Los Angeles Times).

California has one of the most extensive water-supply systems in the world and the largest out of any states. The infrastructure the state currently has is entirely sufficient for storage and supply of water to farms, industries and growing cities, but conservation – as previously stated — has yet to be incentivized. The development of ground water aquifers for conservation would allow irrigators to store water in times of surplus, just like a savings account, thus softening the strain placed on the supply of the resource during dry spells (Manning, Reason).


SOURCES:

http://www.latimes.com/opinion/op-ed/la-oe-0602-ross-sumner-water-agriculture-20150601-story.html

http://www.waterfind.com.au/water-trading-explained/

How to bet on the price of water

http://www.theatlantic.com/magazine/archive/2016/03/a-plan-to-save-the-american-west-from-drought/426846/

http://www.ppic.org/main/publication_show.asp?i=1177

http://www.bloomberg.com/news/articles/2015-08-06/to-ease-california-s-drought-make-water-easier-to-trade

https://ww2.kqed.org/science/2014/09/17/what-to-know-about-californias-new-groundwater-law/

https://www.arb.ca.gov/fuels/lcfs/workgroups/lcfssustain/hanson.pdf

http://news.sky.com/story/water-trading-from-rainfall-to-cashflow-10348114

http://voxeu.org/article/price-precious-commodity-water-trading-australia

http://www.latimes.com/business/hiltzik/la-fi-hiltzik-captrade-20160728-snap-story.html

California has a real water market — but it’s not exactly liquid


Higher Minimum Wage? Expect Maximum Job Losses

In April 2015, over one thousand protestors flooded the University of Southern California campus sporting signs and mega phones. The contingent was primarily made up of fast food workers from the popular chains dotting Figueroa Street seeking a $15 per hour “living” wage. This over 100% increase from the federal minimum wage of $7.25 per hour would have once been unthinkable.

In July 2015, Los Angeles County did the unthinkable by instituting a plan to gradually raise the minimum wage from $9 to $15 per hour by 2022. New York City, Seattle, and Washington D.C. have similar plans (Journalist’s Resource). The minimum wage has long been a hot-button topic in American politics. Democrats tend to support a minimum wage increase, arguing that real-worker pay has unfairly stagnated. There is a long standing concern amongst Republicans that the economic effects of a high minimum wage would reduce profits for businesses and cause businesses to cut employment. Increasing the minimum wage to $15 per hour has potential to force fast food and retail businesses to raise prices and slash labor in order to cut costs.

The minimum wage was first enacted in 1938 as part of the Fair Labor Standards Act to keep money in struggling workers’ pockets (Journalist’s Resource). Since then, it has gradually risen from 25 cents to $7.25 per hour, but it has not been able to keep up with inflation and has actually decreased in real value (Journalist’s Resource). If the minimum wage were increased to $10 per hour, it would be equivalent to its adjusted 1968 value (Journalist’s Resource). Since the last federal increase in 2009, 23 states have taken matters into their own hands by increasing the state minimum wage over the federal (FRBSF). In these states, minimum wages in 2014 averaged 11.5% higher than the federal minimum (FRBSF). However, many of these states also have higher costs of living, providing some justification for the wage elevation.

Percent Difference between State and Federal Minimum Wages, June 2014 (FRBSF)

el2015-37-1

There is historical precedent for elevating the minimum wage, but not to the standard of the proposed living wage. The MIT living wage calculator defines the living wage as the hourly rate that an individual must earn to support their family, if they are the sole provider and are working full-time (MIT). A living wage is dependent on location, cost of living and price indexes. For example, the living wage for one adult in Los Angeles County, CA is $12.56 (MIT). In Beaverhead County, Montana, it is $9.74 (MIT). This casts doubt over the effectiveness of a standardized federal living wage, meaning it is in individual states’ and cities’ best interests to set a minimum wage based on their economy.

Recent studies on minimum wage increases have yielded mixed results. A Purdue University study released in July 2015 suggests that paying fast food restaurant employees $15 per hour could result in price increases of about 4.3 percent (US News). Another study by Jeff Clemens from the National Bureau of Economic Research estimates that as many as one million jobs lost from 2006-2010 were a result of minimum wage increases, most of them belonging to lower-skilled workers (US News). Meanwhile, other studies point towards wage growth and spending increases from the lower-skilled worker bracket (US News). In Tacoma, restaurant jobs have actually increased since a bill to raise the minimum wage to $12 by 2018 passed (Grub Street).

The critiques against raising the minimum wage are hard to ignore when examined from a business owner’s perspective. According to a Pew Research Poll, 55% of minimum wage employees are employed in the leisure and hospitality industries, while another 14% are in retail (Pew). This means that minimum wage employees work for both large companies and small businesses, many of which are based in fast food and retail. The effects of a substantial increase would be handled differently from company to company, but the results would be similar.

Ultimately, a business’s job is to make a profit for the owners and investors, while the minimum wage is a form of government regulation intended to protect workers. This conflict between private and public interest was expressed in my interview with a former McDonald’s employee, Hamburger University graduate and small business owner, Patricia Podkowski, 56. When asked how businesses would respond to a $15 per hour minimum wage, she replied, “Business owners are there to put food in their families’ pockets. They will do what they need to do to cut costs.”

What business owners will do to cut costs depends on the size of the business. Many proponents of raising the minimum wage argue that the resulting price increases at businesses such as fast food restaurants are actually necessary. Because the minimum wage has stagnated, fast food prices have as well and can be moderately increased without impacting the profit line. On the surface, small increases makes sense, but the reality is fast food pricing does not follow the basic laws of economics. According to former McDonald’s CEO Ed Rensi,

“If it were easy to add big price increases to a meal, it would have already been done without a wage hike to trigger it. In the real world, our industry customers are notoriously sensitive to price increases.” (Forbes)

97adc5c5bd24ea72498c2f81eb98c386Pinterest

The fast food and retail industries cannot drastically raise prices because their customers are looking for bargains. While an increase from $1 to $2 may not seem like much, a 100% increase may scare off a loyal fast food chain customer who is accustomed to their favorite item only costing $1. The effects of drastic price hikes to cover for labor raises would only result in additional losses for businesses, leading to unemployment.

Employers are not just paying more in salaries from a minimum wage increase, but would have to pay additional costs such as payroll taxes and insurance. This means owners and managers will resort to creative methods to cut labor costs while maximizing productivity. Patricia, a former shift manager at McDonald’s, believes that managers will spread out shifts and decrease the number of employees during slow hours. For example, a fast food chain employee who used to work the 12:00-5:00 lunch shift might find their hours reduced to 12:30-4:30 to account for the downtime between the lunch and dinner rushes. Even if their salary is increased, they will actually end up losing money in a given pay period because they are working significantly less hours. This could be further amplified at small businesses with lower profit margins, where an owner can pick up shifts themselves rather than paying an employee.

If price increases cannot offset increasing labor costs, decreasing labor is the only other option for business owners. A major point of emphasis for Patricia was that business boils down to controllable and uncontrollable costs. Utilities, taxes and production costs are uncontrollable, price is semi-controllable and labor hours are relatively controllable. However, there are still uncontrollable aspects of labor, which accounted for 15-35% of operating costs at different companies she worked for. Business owners cannot cut too much labor because they have to produce enough product for their customers. However, minimum wage workers may soon find their jobs replaced by a less expensive alternative: technology.

In 2011, McDonald’s ordered more than 7000 self-serve kiosks to replace entry-level cashiers (Forbes). The famous Chicago Rock and Roll McDonald’s is planning on thorough automation in an attempt to shake up their image in the eyes of younger customers (Chicago Eater). It is much cheaper for a business owner to invest in and maintain a $35,000 robotic arm to scoop french fries than it is to pay a human upwards of $31,000 a year to do the same task less efficiently. Former McDonald’s CEO Ed Rensi believes that raising minimum wage in the face of automation will only expedite the process of replacing employees with machines, saying, “It’s very destructive and it’s inflationary and it’s going to cause a job loss across this country like you’re not going to believe.” (Forbes)

unknown

http://www.zerohedge.com/news/2016-04-06/mcdonalds-responds-minimum-wage-hikes-launches-mccafe-coffee-kiosk

The morality aspect of minimum wage may be the most compelling argument against substantial increases because the result might hurt the marginalized people the minimum wage is meant  to protect. In California, $3.7 billion goes to public assistance to working families (Washington Post). Even with a full-time job in one of the highest minimum wage states, minimum wage employees need welfare to survive. This means the government is essentially subsidizing fast food and retail companies with taxpayer money to keep their payroll low. Executives are not suffering from minimum wage increases, the workers are by becoming stuck in a vicious cycle of economic poverty with no wage mobility. An increased minimum wage is not the way to break this cycle, it will only trick young people into thinking minimum wage is a way to make a living when they should be pursuing an education.

Word Count: 1457

References

http://journalistsresource.org/studies/economics/inequality/the-effects-of-raising-the-minimum-wage

http://www.frbsf.org/economic-research/publications/economic-letter/2015/december/effects-of-minimum-wage-on-employment/

http://livingwage.mit.edu

http://www.latimes.com/business/la-fi-minimum-wage-impacts-20160421-snap-htmlstory.html

http://www.forbes.com/sites/timworstall/2016/05/26/mcdonalds-ex-ceo-says-15-minimum-wage-would-lead-to-robots-and-automation-hes-right/#4fb0dd847860

http://chicago.eater.com/2016/9/27/13078184/chicago-mcdonalds-of-the-future-photos-river-north-touch-screen

http://www.pewresearch.org/fact-tank/2014/09/08/who-makes-minimum-wage/

http://www.usnews.com/news/the-report/articles/2016-03-28/ask-an-economist-will-a-minimum-wage-hike-help-or-hurt-workers

https://www.washingtonpost.com/posteverything/wp/2015/04/15/we-are-spending-153-billion-a-year-to-subsidize-mcdonalds-and-walmarts-low-wage-workers/

http://www.thenewstribune.com/news/politics-government/article109295012.html

http://www.grubstreet.com/2016/01/seattle-restaurant-jobs-increase.html

Interview with Patricia Podkowski, 10/5/2016

The Economic Realities of an Independent Catalonia

The debate surrounding Catalan independence has swirled with varying degrees of fervor for hundreds of years. Back in the 1600’s Catalans fought for freedom from the Spanish crown in the Reaper’s War which they ultimately lost. Since then the region has remained in a strained relationship with the Spanish Central government. Whether that government was a monarchy, democracy or fascist dictatorship the Catalans have always felt a distinctly separate cultural and ethnic identity from the rest of Spain. Similar sentiments exist in other Spanish regions such as the Basque Country and Navarre, as well as other European regions such as Scotland, in the UK, and the Umbria region of Northern Italy.

In more recent years, the arguments from separatist groups have taken a decidedly more economic bend. They have been fueled by the European debt crisis and other major economic issues facing Spain, and signal a bit of a change from the arguments from yesteryear. Even during the Spanish Civil War, which was largely fought between German and Italy-backed Nationalists and Soviet-backed Communists, the Catalans were largely in league with the anarchists whose economic policies you can probably guess weren’t too fully formed based on the fact that, you know, they were anarchists.

So this new approach is a stark change of tact for independistas, but don’t let the new paint job fool you. Despite the difference in content the underlying message is the same. They are still leveraging the historic trend of Catalan mistrust of the Madrista government and deeply felt regional pride to push for an independent Catalonia. Only now their arguments center on unfair taxation and mounting regional debt, instead of language and literature.

But does this rhetoric hold up to objective economic scrutiny?

If we look at raw numbers we can see that Catalonia comprises a significant portion of the overall Spanish GDP. In 2014, Spain’s total GDP was about $1.1 Trillion, according to World Bank, with Catalonia consistently accounting for around 20% of that figure, or just over 200 Billion euros, despite only comprising 16% of the nation’s population at 7.5 million people. Catalan GDP per capita was just over 28,000 euros in 2014, just behind the Euro-zone figure of just under 30,000 euros. But it was over 20% higher than the average Spaniard, thus making it one of the wealthiest regions in the country.

screen-shot-2016-10-08-at-12-03-23-amSource: Statista

Two major drivers of the region’s economy are both the export and transport of goods. Catalonia accounted for 25.5% of Spain’s total exports in 2015. Barcelona, the regional capital, is the third largest port in Spain, and Catalonia handles 70% of exports from the rest of Spain. Based on these strengths it would certainly hurt Spain to lose the one of its most economically powerful regions. It would hinder trade, and levy a sharp blow on the overall country’s overall economic output. Conversely, it could put Catalonia in danger of facing tariffs and boycotts on its goods which would harm its trade-dependent economy. Dangers loom for both sides in the event of a separation.

screen-shot-2016-10-08-at-12-01-07-am

Catalonia Region Economic Data (Source: World Bank)

So what’s driving the Catalan’s push for economic separation? Two things: a major debt crisis and the perception of unfair taxation. But what do we find when we look at these issues more closely? Let’s look at the debt issue first.

Despite the region’s economic strength it is still the holder of the largest regional debt in Spain. The meteoric rise of Spanish debt as a result of the European debt crisis was felt by the entire country, but it’s an issue that has become a particular flash point for Catalans.

screen-shot-2016-10-08-at-12-04-08-am

Catalonian GDP per capita compared to Spain and the Eurozone (Source: Statista)

After a brutal recession in 2008, and a second recession hit in 2012 and debt in greater Spain soared from 65.9% of GDP in 2011 to 85.4% in 2012. This reality led the Spanish central government to levy harsh austerity measures in an attempt to get the debt situation under control. They froze public sector wages and cut government spending by 12%. Combined with a regional unemployment rate of 22% in 2012, Catalans came face to face with a daunting combination of economic issues.

In attempting to service the debt the Spanish government made it more difficult for regions, like Catalonia, to jump start their economy through classic Keynesian stimulus plans. This is also a consequence of the Euro currency system which does not allow individual country to create their own monetary policy in order to ease the blow of recessions.  Perhaps that fact forces Madrid’s hand to austerity measures, but not many Catalans want to hear excuses for the Madridistas. The economic results, or lack thereof, of these actions certainly does not help matters. Despite severe austerity measures Spanish national debt debt rose to 99.3% of its total GDP in 2014, and then shrunk slightly to 1.1 trillion euros, in 2015.

screen-shot-2016-10-10-at-11-08-23-pm

Source: Trading Economics

The question of how the two sides will allocate this debt is essential to understanding the possible economic consequences of Catalonian Secession. If the two nations agree that the Catalans should take 19% of the debt with them, or the same amount of money they contribute to Spanish GDP, then the effects on Spanish national debt after losing the region would be marginal, because they would lose the same share of debt, as they lose in total GDP.

However, if the central government allows the Catalans to leave with 16% of the debt, which matches their population size, or even 11% which would equate to government expenditures in the region then, according to economist Xavier Sala-i-Martin, Spain’s national debt could rapidly approach unsustainable levels. Even worse, If the Spanish central government comes to no debt transfer agreement with the Catalans it could mean that they leave without taking on their share of the Spanish national debt. This would be legally dubious, but possible,  and it would cause Spanish debt to explode. It’s estimated that debt levels would rise to nearly 125% of total Spanish GDP due the multiplying effect of losing the Catalan contribution to the national GDP while also taking on more debt. This eventuality could lead to a Spanish default. However, if the Catalans attempt to leave with no economic agreement they could surely expect to face harsh economic sanctions from Spain. Possibly even Spain blocking Catalonia’s entry into the EU because countries need unanimous approval for entry.

With both sides facing dangerous outcomes from secession, it can be difficult to understand why this independence movement has gained so much traction. But by investigating Spanish taxation practices we can see why so many Catalans, who are already predisposed to mistrust the central government, feel independence is their only option to receive fair treatment.

In response to central government austerity and rising debts, the Catalan regional government requested a payment of around 5.57 billion euros from Madrid, and not in the form of a loan. They wanted this as repayment for what they see as unfair taxation policies by the Central government.

According to a survey taken by the Catalan regional government in 2014, 80% of the Catalan population felt the central government taxed them at an unfairly high rate. In the populace’s view, too much money was taken without reinvesting enough of it back into Catalan infrastructure and social programs. These concerns led to the slogan, “España nos roba,” (Spain is robbing us), and fueled the pro-independence parties that were elected throughout the region in September 2015.

The question of whether Spain is truly “robbing” the Catalan people quickly becomes more complicated than it initially appears, and certainly more complex than the independentistas of Catalonia want their supporters to believe.

If we use the figures given by the Catalan government, they lose 8.5% of its GDP to the central government every year. Independentistas argue that if they left Spain then this money would simply stay in the region for the people to use at their own discretion and help curtail their rising debt. Those on the remain side respond that if you take into account the amount of public spending on services and infrastructure paid for by the national government then this number of “saved” GDP would shrink to around 4-5%.

screen-shot-2016-10-08-at-12-05-37-am

Source: Statista

Around the world, it is not uncommon for a wealthy region, such as Catalonia, to pay a higher share of taxes that are then redistributed to less wealthy regions. A 2014 study by Wallet Hub illustrates how this very principle exists here in the US. For example, a state like New Jersey received only $0.88 for every dollar they put into federal income tax. Meanwhile Mississippi, a relatively poor state, gets $3.07 back for every dollar they put into the system.

So if this happens regularly elsewhere are the Catalans just being unreasonably greedy? Maybe, but maybe not.

In a 2012 study published by Barcelona’s Pompeu Fabra University, researchers found that Catalonia accounted for 118.6%, of national taxes per capita which placed it third out of the 15 regions in Spain. After the redistribution of taxes its per capita distribution of tax money fell to 99.5% of the national average, placing it 11th. Conversely, Extremadura, a remote, mountainous region along the Spanish border with Portugal, which ranked 14th in national taxes per capita at 76.6%, rose to third place in per capita tax revenues after redistribution by receiving 111.8% of average government resources per capita.

Taking a step back, it’s clear that a combination of austerity tactics to cut down debt and improper tax redistribution created an environment ripe for separatism, though some analysts hold out hope that the situation can be rectified. “We continue to believe that the secessionist fervor is a response to fiscal austerity,” analysts at Credit Suisse say. “Much of it would calm down if the Madrid government re-negotiates intra-regional transfers with Catalonia and the region is allowed to have more tax autonomy.”

Catalans can point to the Basque Country and Navarre regions of Spain, as examples of fiscal policy that, if granted to Catalonia, may help settle talks of secession. Both of those regions have agreements with the central government allowing them to keep most of their tax revenues without sending them to the Spanish government. Perhaps if the central government institutes smart changes, or merely weathers the storm, then the winds of secession will die down.

Mongolia to Minegolia: The role of mining in the rise of the Mongolian economy and its uncertain future

A nomadic herder rides past a traditional ger in Northern Mongolia.

A nomadic herder rides past a traditional ger in Northern Mongolia.

Traveling outside of Mongolia’s only major city, Ulaanbaatar, can seem like traveling back in time 800 years. Among the hundreds of miles of rolling hills in which you would be hard pressed to find any permanent, man-made structure, you half expect to see Genghis Khan’s enormous army thunder down a hill aboard hardy little ponies. Nomadic herding culture has been a part of Mongolia for thousands of years and it remains a major part of Mongolian life however, Mongolia’s economy is undergoing massive transformation that could change both the cultural and natural landscape forever.

From 2009 to 2013, the Mongolian GDP nearly tripled in size from a scant $4.584 billion (US) to $12.582 billion, according to the World Bank. Yet more important than the rise of the nation’s GDP is the source of economic growth and geographic location: valuable minerals and metals and its location just north of resource hungry manufacturing powerhouse, China.

The story of Mongolia’s rise from irrelevance to noticeable actor in the Asian sphere began in 1997 when the democratic government, established after the fall of the Soviet Union, which maintained Mongolia as a buffer against China, passed the Minerals Law of Mongolia. This law established the state’s ownership of all mineral resources within its borders and reserved the right to sell mining and exploration licenses.

Mongolian GDP as reported by the World Bank. Click for the interactive graph.

Mongolian GDP from 1981 to 2015 as reported by the World Bank. Click for the interactive graph.

The goal of this law was to grow Mongolia’s economy after a dip that left their GDP below the billion-dollar mark from 1993 to 1994. If the government could sell its mining and mineral exploration rights to international mining corporations, it could dramatically increase levels of foreign direct investment, lower unemployment, and raise GDP.

For investors, abundant Mongolian reserves of copper, gold, fluorspar, and uranium were highly attractive. Especially in the early 2000s when prices for rare earth metals and minerals were climbing. In addition to natural resources, Mongolia shares a border with China, the world’s largest importer of raw materials. This presents a lucrative opportunity to sell materials to China at a lower price by minimizing transportation costs that make metals and minerals from South America more expensive.

Foreign Direct Investment in Mongolia from 1991 to 2015. Click for an interactive.

Foreign Direct Investment in Mongolia from 1991 to 2015. Click for an interactive.

Combining natural resources with its proximity to China, a country that imported $25.1 billion in refined copper and $63.9 billion in gold in 2014, Mongolia looked like the world’s premier destination for mining operations.

After a few years of exploration on the Mongolian steppes, international mining mavens concluded that there were fortunes to be made and the investments started pouring in. From 2009 to 2011, a World Bank report found over a $4 billion increase in foreign direct investment from $623 million to $4.713 billion.

GDP Growth in Mongolia from 1960 to 2015 as reported by the World Bank. Click for an interactive.

GDP Growth in Mongolia from 1960 to 2015 as reported by the World Bank. Click for an interactive.

High investment was not meant to last. Beginning in 2012, foreign direct investment plummeted just as quickly and dramatically as it shot up. Investors likely balked at copper prices that plummeted in the second quarter of 2012. As a result, between 2012 and 2015, foreign direct investments fell $4.2 billion to a mere $196 million last year.

In spite of the massive expansion and contraction of foreign investment in Mongolian businesses, private international mining company spending on their own ventures has kept the GDP from shrinking even though growth has slowed. The exponential growth that started after the 1997 Mongolian Minerals Act peaked in 2013 at $12.583 billion, a 17 percent growth rate, but was followed by a downturn in GDP with growth rates slowing to 2.3 percent in 2015.

The Oyu Tolgoi mine in the South Gobi. Photo by The Northern Miner.

One such company is Turquoise Hill Resources Ltd., a subsidiary of the Canadian Ivanhoe Mines. It announced a $4.4 billion investment in underground development at its mining sight Oyu Tolgoi on December 14, 2015. Estimated to be the world’s third largest reserve of copper, Turquoise Hill originally invested $6.2 billion in 2013, after years of exploration and analysis, to begin production.

The 2013 Mongolian GDP by Sector as reported by the Mongolian Embassy to the United States. Click to see full economic report.

The 2013 Mongolian GDP by Sector as reported by the Mongolian Embassy to the United States. Click to see full economic report.

These investments, and others like them, have helped and continue to be a vital part of the Mongolian economy. In 2013, mining made up 16 percent of the GDP and the exportation of copper, gold, and coal made up 65 percent of exports in 2012.

In spite of goals to bolster the economy, the Mongolian government has not opened the floodgates to capitalist investment in such a way that would allow foreign corporations to lay waste to the Mongolian countryside, people, and economy to benefit their bottom lines. The emphasis is on sustainable and fair growth.

In order to include Mongolian interests in mining decision making, the Mongolian government and Turquoise Hill spent five years negotiating the Oyu Tolgoi Investment Agreement. The agreement states that the state has a 34 percent equity stake in the mine with the ability to renegotiate their ownership to 50 percent as soon as initial investments have been recuperated.

Additionally, the agreement holds the investor accountable for regional economic development, adhering to national and international environmental standards, contributing to national infrastructure, maintaining a workforce that employs mostly Mongolians, and investment in the education of the Mongolian people.

Leveraging the Oyu Tolgoi mining contract with Turquoise Hill has allowed Mongolia to begin developing more evenly than some of its resource rich peers, who sold extraction permits heedless of local peoples’ needs and health, such as Ecuador. In creating stipulations that require the mine to be staffed 90 percent by Mongolians, with 50 percent of engineers being Mongolian citizens within the first five years of operation, holistic development is at the center of project.

mongolia-gdp-per-capita

Mongolian GDP per capita from 1960 to 2015. Click an image for an interactive graph.

As a result, GDP per capita increased, poverty rates decreased, and unemployment rates shrank. Since the beginning of development at the Oyu Tolgoi mine in 2011, GDP per capita has grown over 800 percent. The GINI Coefficient, a measure of income distributions in which a value of 0 represents perfect equality and 100 represents absolute inequality, Mongolia is rated a 36.5, a ranking very similar to that of China.

The strength of the Mongolian togrog declined sharply in 2016 in relation to the U.S. Dollar.

Recently, however, growth has not been as impressive as it was in 2011 and 2012 during which GDP growth was in the double digits. In 2015, growth slowed to 2.2 percent. This has in turn caused the Mongolian currency, the togrog, to plummet in value.

Many economists blame Mongolia’s economic downturn on changes in the slowing Chinese economy. China, which is the destination of 80 percent of Mongolia’s exports, has decreased its demand for commodities like copper and coal which has driven down international commodity prices significantly. This serves as a double blow to the Mongolian economy because China is not buying as much and prices are falling in the international marketplace.

Because of slow growth and a faltering Chinese economy, investors who were drawn to invest in the Mongolian government due to the profitability of mining, have quickly sold government bonds, raising the supply of the currency, and further exacerbating the devaluing of the togrog. In order to mitigate these affects, the Mongolian central bank raised interest rates to 15 percent in August. Theoretically, this will curb currency depreciation by incentivizing investors to invest again, which will increase demand for Mongolian currency. But, for now, the strength of the togrog is still a major source of concern for Mongolia.

Regardless of its economic impacts, mining has had some secondary, unintended negative affects on the Mongolian people and environment. As the economy grows, due in large part to the mining industry, there exists an unrivaled concentration of wealth and opportunities in the few cities and mining towns in Mongolia. As a result, there has been a rapid increase in levels of urbanization.

This population shift is common in developing countries because many city and mining jobs are more productive and therefore more profitable than agriculture.

A nomadic herder tends to his herd of yaks near Bulgan Soum in northern Mongolia.

A nomadic herder tends to his herd of yaks near Bulgan Soum in northern Mongolia.

While this trend is the norm in many developing nations, Mongolia’s rich cultural heritage is based in its traditions of animal husbandry and nomadism, which are increasingly viewed as economically uncertain and therefore undesirable ways of life. The increasing frequency of unusually cold winters, called “zuud,” are intensifying movement to urban areas as herds die off on the ice covered steppes. These extreme weather conditions have been attributed to pollution and its affects on climate change.

To move to the city, many families sell what remains of their herds, which have traditionally served as a source of food in the form of meat and dairy, clothing made from the wool of sheep and goats, and even fuel from manure to ward off the frigid winters. Since so many herders have relocated to Ulaanbaatar in particular, the outskirts of the city are crowded with “gers,” traditional felt tents, that lack running water and proper plumbing.

While these ger areas are difficult to manage in the summer months, it is during the winters, when low temperatures average around -28 degrees Fahrenheit, that real problems arise. In order to keep warm and cook, many former nomads living in gers burn coal and wood. Air pollution is so bad in the colder months that it exceeds the World Health Organization’s most lenient standards by 600 to 700 percent.

This creates a spiral of urbanization. As more nomadic families leave the countryside and gather in mining towns and cities, pollution increases thereby worsening and increasing the frequency of hard winters, forcing more families to trade their herds for mining or manufacturing jobs.

Mongolian boys participate in the horse race portion of Naadam, a traditional holiday that celebrates the Mongols' nomadic roots.

Mongolian boys participate in the horse race portion of Naadam, a traditional holiday that celebrates the Mongols’ nomadic roots.

Without intervention, urbanization could potentially lead to the disappearance of the nomadic traditions that have inhabited and characterized the region for over one thousand years.