Uber: Win for the riders, loss for the drivers


shutterstock_326732723-1-998x666

Uber just completed 2 billion rides on July of 2016 internationally, proving as consumers’ best friend when it comes to transportation.

To the majority of the Trojans, Uber is an excellent app.

Thanks to the recent program between USC and Uber, the Trojans have been saving money and going home safely after late excursions.

Proving how Uber is the students’ beloved smartphone app, the recent findings in Uber demand curve shows how Uber service is more beneficial to the customers than the drivers and the company itself.

uber-surge-img

Uber, Steven Levitte (author of Freakonomics), and other researchers mapped out Uber demand curve to investigate the impact Uber has brought to the consumer welfare. If the researchers were to map demand curve for regular transportation service, it could have been harder because there is more than one factor. For the transportation service like Taxi, the price may be affected by not only the supply of the drivers but also by the weather, time of the day and other competing services. Different from aforementioned factors affecting transportation demands, Uber’s metrics are unique in two folds: 1. Uber records every occasion where a customer declines the offered price with regular factors such as the time, place, price, and a surge factor; 2. Uber rounds up or down to one decimal place the surge factor it generates to determine how much to charge customers for a given trip.

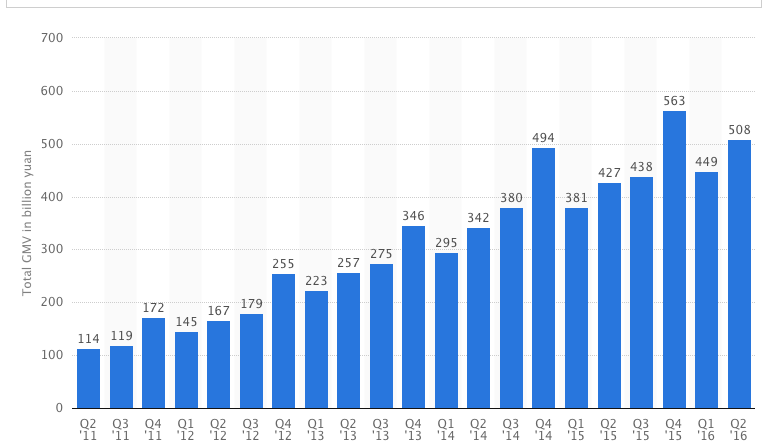
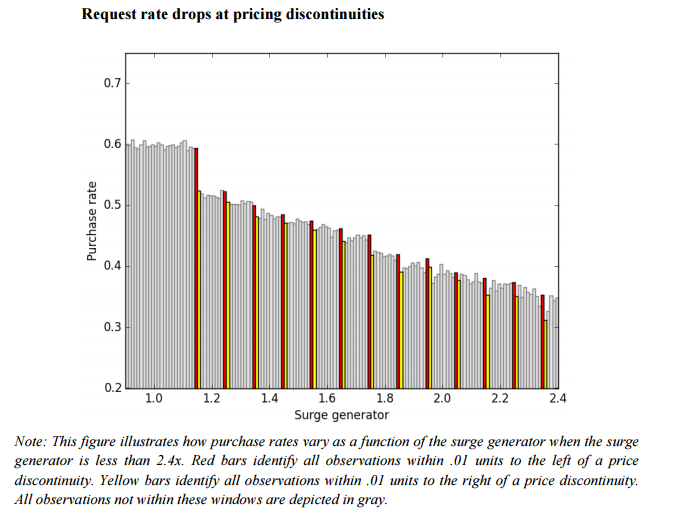
The Study looked into 48 million ride interactions over the first 24 weeks of last year from Uber’s four biggest U.S. markets: New York, San Francisco, Chicago, and Los Angeles. According to the data, the customers follow through 62% of the time without surge pricing (which is almost 80% of the time), and 39% when the surge is above 2 (3.5% of the time). The demand did not match the price. In simple economics, the demand should be high as the supply is scarce; however, the Uber data shows the opposite. As shown in the graph, the demand decreased by 40% as the price doubled.
request-rate-drop-at-pricing-discontinuitiesheat-map-of-percent-of-sessions-with-sruge

On the conclusion of the study, the authors stated that Uber demand curve is highly inelastic and made $6.8 billion consumer surplus last year alone. This surplus is twice greater than how much the drivers were paid and six times what Uber itself earned last year. This may be a good news for the college students whose goal is always to save money, but it is clearly not a great news for Uber which has lost $1.2 billion in the first half of 2016.

San Francisco and its Sleeping Bag Situation


Although it’s been called the “most expensive city in the U.S.”, San Francisco homeowners are challenged with an issue more prevalent than just the neighborhoods steep price tag — homelessness.

According to a recent study by the California Budget Center, the city ranks first in California for economic inequality. With the average household income of the top 1% ($3.6 million) reaching 44 times that of the bottom 99% ($81,094), it’s clear that there is a serious housing and wealth disparity in the city.

While San Francisco is known for its free-thinking, diverse, and innovative culture, the city has long struggled with the issue of homelessness despite spending upwards of $240 million every year to tackle it. Moreover, it is estimated that the 1,600 chronically homeless people cost the approximately $80,000 each per year, with the number rising to $150,000 for the 338 considered “most needy” in the public health database.

The irony of the situation lies in the fact that while San Francisco is deemed as being a progressive, welcoming, and moderately warm city this also means that that there continues to be a large influx of homeless people to the city each year. Which, in turn, poses major challenges to both policy makers and residents who are already battling with the cities extremely expensive housing market.

screen-shot-2016-09-20-at-4-31-41-pm


In order to tackle the issue of homelessness in San Francisco and create serious change, policy makers need to look at the issue from both the homeowner and humanitarian perspective.

On the one hand, while it is understandable that homeowners are becoming increasingly frustrated with the issues, lawmakers cannot solely listen to residents complaining about having old mattresses lying outside their $4 million dollar walkup. Similarly, increasing budgets for welfare and rehabilitation programs will not be beneficial if there is not the infrastructure and culture to do so.

Maybe what the city really needs is a change of mindset — in both how people and policy makers view and understand the issue of homelessness?

It is not as simple as just ‘creating housing and offering programs’… it will take an entire community.


References:

http://projects.sfchronicle.com/sf-homeless/civic-disgrace/

San Francisco has become one huge metaphor for economic inequality in America

http://www.sfchronicle.com/archive/item/A-decade-of-homelessness-Thousands-in-S-F-30431.php

Government and NGOs Fight Homelessness in San Francisco: Is it Working?


The Art Market is Plagued with Irrational Exuberance

640x-1

The art market is not unlike the stock market. The auction floors of Sotheby’s and Christie’s akin to the trading floor of the New York Stock Exchange, men and women gesticulating or waving paddles as prices for the commodity – the work of art being sold – rise. People speculate and they buy to sell. Buying up art has become a show of strength and capital – both monetary and cultural – for the world’s wealthiest people seeking status and future profits. The problem though is that art is not a commodity of quantifiable worth. The price of a Francis Bacon triptych – regardless of how beautiful or one of a kind it may be – is subjective and driven by what a buyer is willing to pay. Art does not have an intrinsic value like gold, oil or other traditional investments constantly being bought and sold on the market.

Speculation is ultimately the largest driver of the art market and has resulted in the distortion of art valuation, and like any market speculation leads to inflated prices and potential bubbles. The art market’s decline in 2009 is indicative of its vulnerability during times of economic turmoil; however, following the world financial crisis prices of art began to rise and inflate again with people believing art to be a safe asset to invest in when other markets are doing poorly (Segal).

102013_phonebids_600

Art is enticing because the gains that can be made in the short-term are much higher when compared to other forms of investible assets; and continued low-interest rates have made it easier for lenders to borrow more money, driving up prices as well. Since the 2008-09 global recession, the value of art has more than doubled since financial recovery (Helmore). The problem again is that art, is illiquid, it has no fundamental value and is driven by oligarchs that call themselves collectors. These so-called collectors are really just interested in turning a profit and thus the boom for art, failing to take into account issues of exposure to oversupply; because art, specifically contemporary art is essentially in endless supply, with a new Warhol or Koons or Hirst coming onto the scene. While this is all good and fine as long as people continue to be willing to pay these prices, there is no question that market has been overheated by the “irrational exuberance” of speculators.
Current trends of buying up art as an asset with the expectation that it will be worth more in the future mirror that of the dot-com bubble of the 1990s and the collapse of the housing market in 2009, the prices simply cannot continue to sustain themselves.


Referenced:


http://www.nytimes.com/2012/07/22/business/swiss-freeports-are-home-for-a-growing-treasury-of-art.html

https://news.artnet.com/market/art-market-bubble-report-409136

http://www.artbusiness.com/osoquspec.html

https://www.theguardian.com/artanddesign/2016/jan/17/art-market-mania-phase-bubble-report


How Your College Education is Paying for Touchdowns (or Lack Thereof)

The college experience is priceless. How can you put a dollar sign on meeting the most diverse, interesting, and intelligent group of people you will ever encounter, and high-fiving complete strangers when your team has 2 touchdowns by the first quarter?

We all know we’re paying too much for college. We all complain and cry a little everyday as the interest bumps up our once “small” loan debt to numbers beyond our comprehension. We pay a large sum of money for an education that sometimes feels wasted on us due to procrastination and the occasional frat party. Some even skimp out on buying textbooks to save a few bucks.

Yet, do we ever blame football? Basketball? The attractive men’s volleyball team? Of course not.

According to the Huffington Post, our greatest unknown fears are put in writing : College football is stealing our education.  The student loan debt crisis is old news but here are the current statistics. There are 43.3 million Americans with student loan debt, he total U.S student loan debt being 1.26 trillion. About 70% of college students end up with $30,000 in student loan debt. All in all, the price of tuition continues to rise and therefore so does the debt.

The issue is not that education is expensive because of course we all know that going in. The issue is that the uptick in tuition may not be going to the things that lead to our success but the athletic department instead. According to the Huffington Post, schools with strong football teams correlate with increased tuition up to 55% or in some cases 65%. Pouring more money into football at many schools leads to faculty or degree programs being cut. Ironically, the claim that athletic departments bring so much to the school has not been proven. The opposite has, that “Over 80 percent of collegiate athletic departments actually lose $11 million dollars or more for their universities yearly.

It is difficult to claim that USC as a whole has allowed academics to suffer due to football. Evidently, USC graduates do very well. However, is it really necessary to pay the equivalent of a mortgage every year? Especially when our team is realistically pretty mediocre…

Interestingly enough, the White House claims that “student loan debt is an investment in human capital that typically pays off through higher lifetime earnings and increase productivity.” They released an entire study “proving” student debt helps instead of harming the economy. The proof lies in the fact that students with the most debt have usually gone through graduate school which means higher income and opportunity in the future. However, what happens when you get zero financial aid assistance during undergrad? What do you do then?

Perhaps taking a closer look at the White House study would prove me wrong, but at the end of the day, even if high unemployment leads to higher enrollment rates at universities how is the average American expected to manage such large amounts of debt with such an unpredictable job market?

Sources:

A Look at the Shocking Student Loan Debt Statistics for 2016

http://www.huffingtonpost.com/robert-greenwald/college-football-is-steal_b_8282690.html

http://blogs.wsj.com/economics/2016/07/19/student-debt-helps-not-harms-the-u-s-economy-white-house-says/

The New iPhone and The Economy

imgres

A part of this past weekend’s happenings was the well-awaited release of the iPhone 7 on Friday.  Since the iPhone 7 and its new features were revealed on September 7th, the public has been eager to have one of their own. Like the arrivals of previous generations of the iPhone, people have ordered theirs ahead of time to be able to have it the first day it is released and many will wait in long lines outside the Apple store just to make the new gadget theirs. Even some of the color options of the new phone have temporarily sold out. There is a lot of excitement around the iPhone 7 for the sake of having it but hopefully, for economists, the iPhone 7 will affect the economy similarly to how the previous iPhone releases did.

The New York Times revealed that “Michael Feroli, chief U.S. economist for JPMorgan Chase & Co., told the New York Times Sunday that there’s evidence that iPhone sales add between one-quarter and one-third of a point to gross domestic product growth.”. Economists have found that the influx of consumer spending is very reliable in the quarter that the new iPhone generation is released. This is because consumers are spending a lot of money during that time then they would usually spend in a month, and there is high demand, it feels like everyone has an iPhone. Apple is the highest valued tech company and 60% of their revenue is from iPhone sales. The new iPhone also stimulates the sales of electronic stores and the phone carrier companies.

Fortune, CNBC and other sources have reported that the iPhone 7 sales are currently in line with the previous iPhone releases. The iPhone sales during the release weekend have increased from each new release. If the trend continues, the iPhone 7 sales during the release weekend should pass the sales of the iPhone 6s release weekend. If it does, it will impact the economy even more that the iPhone 6s release did.

150928102607-iphone-6s-opening-weekend-sales-780x439

Fortune previously said that, “Around the start of 2015, it was reported that Apple’s iPhone 6 sales were responsible for 10% of all U.S. economic growth…The claim featured a 1.9 to 2.5% growth rate for the U.S. economy between 2014 and the first quarter of 2015 ”. From information gathered about the past iPhone releases, it will be interesting to see how this iPhone release pans out and could affect the economy similarly or differently. It will take time to tell, especially after seeing the sales of the iPhone 7 during the holidays.

Another notion about the iPhone is that it represents America’s changing economy and decline of manufacturing because it is made by the largest tech company in the U.S. economy but it is manufactured outside the U.S. This video from the New York Times was very helpful for my understanding of this topic-

Although, the new iPhone stimulates consumer spending, the company overall could be affecting the economy in a negative way because of the loss of jobs due to the decline of manufacturing, a factor of the economy.


Sources:

http://www.nytimes.com/interactive/2012/01/20/business/the-iphone-economy.html?_r=0

Here’s How Well iPhone 7 Sold In its First Weekend

iPhone 7 Sales Rate Matches iPhone 6

www.nytimes.com/2014/10/26/your-money/when-iphones-ring-the-economy-listens.html

http://www.ibtimes.com/apple-iphone-6-has-measurable-impact-us-economy-1713752

http://www.investopedia.com/articles/investing/022316/economics-iphone-aapl.asp#ixzz4Kocccah2

Economics of the English Premier League

I want to talk to you about Craig Bellamy and Andrew Ayew. If you’re not a big fan of English Premier League you’re probably wondering who those two guys are, and what could possibly make them interesting enough to talk about.

ayew

NORWICH, UNITED KINGDOM - JULY 31: Craig Bellamy of West Ham United in action during the Pre Season Friendly match between Norwich City and West Ham United at Carrow Road on July 31, 2007 in Norwich, England. (Photo by Matthew Lewis/Getty Images) *** Local Caption *** Craig Bellamy

NORWICH, UNITED KINGDOM – JULY 31: (Photo by Matthew Lewis/Getty Images) *** Local Caption *** Craig Bellamy


Photo Credit: Arfa Griffiths via Getty Images


Well, they are both footballers who play the same position. Bellamy is retired, and Ayew plays currently for the London-based soccer club West Ham United where Bellamy used to play. They are interesting because they represent the effect of an insane revenue boom in the EPL, and how that has changed the economic dynamics of the one of the most popular sports leagues in the world.

In 2016, the EPL penned a new £5.13 billion broadcast rights deal which rose more than £2 billion from the previous agreement. This money is then spread amongst all the teams in the league. Imagine the EPL as a nation, and their GDP just swelled in size because the G, in this scenario the league itself, just poured a bunch of money into every team.

In past years, we have seen increases in I, or individual investment, in past years when billionaire oil magnates bought teams and injected them with loads of cash i.e. Chelsea and Manchester City, but those moves didn’t affect spending trends league wide. This time, the money has been helicoptered into small teams like Watford, as well as the giants like Manchester United. And unlike in Japan, those teams sure have spent that money.

This past summer alone teams in the EPL spent over a £1.165 billion on transfers. Trumping the gross spend from the previous summer of £870 million, and continuing an astonishing upward trend from the start of the window in 2003, in which teams outlayed a “paltry” £235 million.

screen-shot-2016-09-19-at-2-49-22-pm

Chart Source: Deloitte

Why is this happening? If we look at it through the lens of economist David Ricardo’s theory of marginal rents we can glean insight into why the trend of transfer spending has spiked so fantastically. I would point to those players and clubs on the “margin”, basically those teams that are average performers in the league, to see why spending continues to rise throughout the league.

screen-shot-2016-09-20-at-9-10-03-am screen-shot-2016-09-19-at-3-02-14-pm

Look at the number of record transfers that happened this past window, and then notice the spike in spending by the four teams in the chart on the right. The reason why those teams must spend even more now is because what the average team will pay for the average player has skyrocketed, and driven up the cost of players for those at the top of the league.

This brings me back to our old friends Andrew Ayew and Craig Bellamy. You can see Ayew’s name on that chart next to the £20.5 million he cost this past summer. Back in the summer of 2007, Bellamy, a player of a very similar skill-level and position, came to the same club for £7.5 milion. That is a huge jump in what that team would pay for that player in a mere eight years, and if we look at Ricardo we know that if the team on the “margin” can pay £20.5 million then that drives up the what the good clubs play for good players, and then what the elite clubs must pay for elite players. Thus creating the new market value for all players and the record spending for the clubs. After all, clubs still need players to sell tickets and TV rights.

This appears to be the new reality in the Premier League, and fans will have to get used to the dizzying amount of pounds spent on footballers as the trend continues to skyrocket.

Physical stores take hit on China’s e-commerce booms

If you haven’t heard of Taobao, you’ve at least heard of Alibaba. Operated by Alibaba, Taobao is the number one online marketplace in China. The founder, Jack Ma, was so ambitious that he wanted business for everybody. So he created an online platform in order to deliver C2C business (with a B2C branch called T-Mall). Taobao leads the e-commerce business in China, but also led a major battle between e-commerce and physical retails.

%e5%b1%8f%e5%b9%95%e5%bf%ab%e7%85%a7-2016-09-20-%e4%b8%8a%e5%8d%8812-55-01

Taobao was founded in 2003; it was doing alright during the first a few years, but the sales volume really started to grow massively since 2011. Its 2015 annual sales volume was ¥3 trillion, which was more than triple to 2011, and the 2011 annual volume was already larger than the first five years combined.

%e5%b1%8f%e5%b9%95%e5%bf%ab%e7%85%a7-2016-09-20-%e4%b8%8a%e5%8d%886-43-30

Source: Taobao, 2015 annual sales volume 3 trillion yuan

%e5%b1%8f%e5%b9%95%e5%bf%ab%e7%85%a7-2016-09-20-%e4%b8%8a%e5%8d%8812-25-07

Source: Statista

Take a guess. How long did it take for this online marketplace to generate ¥1 billion volume (approximately $150,000,000) on 2015’s “Singles’ Day Nov. 11th” (the Chinese version of Black Friday)? Seventy-two seconds. The sales number bumped up to $1.5 billion within 13 minutes, and by the end of that day, Taobao reported the final sales number to be $14.3 billion.

A lot of people have been criticizing Taobao, for “destroying” the physical retail business. Of course, Taobao is the inventor of this shopping culture, but this is the money people would have otherwise spent in physical stores.

But we can’t blame the consumers. One of the biggest advantages you get from shopping on Taobao, is that you can buy good value products within a very reasonable price range. We’re buying products made in China in the U.S., because they are cheaper. But surprisingly, the same products often are sometimes more expensive in China. Because although labor in China is rather inexpensive compares to western countries, the cost of housing and rent is scary. In order to remain in business, many retail stores raise the price of their products. You might find a jacket with a brand you’ve never heard of in a random street shop, and it costs more than $150, whereas you can get a very similar jacket on Taobao for less than $50. Now, more and more consumers go to the physical stores to check out the products, and then go home and shop on Taobao, or other similar sites. This leads to a lot more problems. For example, many retailers stopped renewing their leases and turned to online selling, which causes challenges for shopping malls and shopping districts.

However, can we blame Taobao for starting an unfair market competition? Not really. After all, the cost of making a product is still relatively low. Would physical stores become just a testing site for the consumers?


Terrorism does not come at a cheap price

nypd-srg-benjaminchasteen6607-20151118-676x450-1

Breaking news hit this weekend regarding five attempted bombings that threatened New York and New Jersey. As citizens fear for their safety and officers are on high alert, there is also another group of people that are scrambling for resources. In order to bounce back from the tragedy, the federal government must pour money into heightened security and begin to finance city repairs. Although the safety of the American people holds a much higher significance than the money that is use to ensure that safety, it is still an aspect of the government that must be considered.

In the last year, the 800_wg4g2jsglzk8zv0xlqp5msq2gjywbxglnumber of terrorist attacks has been at an all time high.
These attacks have taken far too many lives and often leave parts of the city
destroyed. Although it is often not considered, these tragic results have an enormous effect on the economy in two ways. One way is that, it largely affects consumption and consumer spending. The other way is that the actual costs of repairs and increased security takes a large toll on the economy.

When attacks occur, people tend to stay inside due to a lacking sense of safety. By doing this, they avoid spending on leisure, goods and travel.
In addition, during times of crisis 13-cityroom-subway-blog480
businesses often decide to close, public services, like subways, temporarily shut down and cell phone towers even stop working because of the chaos. Although these factors may not seem like they would have a considerable impact on the economy, they actually cause a major disrution in every day life and impacts the economy on a global scale.

The economic impact of global terrorism has been rising since 2010. This can be seen on the graph below, which was created by the Institute of Economics and Peace. The graph shows that over $52 billion was spent globally on terrorism in 2014. However, this number only includes direct, short-term costs, excluding economic impact, war funding, future veteran’s care and increased national security. Therefore, the actual cost of funding after terrorist attacks ends up being much more. For example, the 9/11 attacks were initially estimated to cost $27.2 billion, but after factoring the effect that it had on the economy long-term, it came out to be around $3.3 trillion.

screen-shot-2016-03-28-at-1-26-46-pm

In addition to cuts in consumer spending, a majority of the costs incurred by terrorist attacks come from increasing military and security measures. After terrorist attacks the costs of special equipment, repair and deploying thousands of officers around the clock really adds up. In New York City’s metropolitan area annual protection usually comes out to be $1 billion according to Michael Paddock, CEO of Grants Office LLC, which tracks federal spending. However, this price does not include the costs acquired when there are actual attacks. CNN Money reported that The Emergency Service Unit, which includes 500 elite counter-terrorism officers is always deployed during times of crisis and attack, and not at a cheap price. These officers usually carry Cold AR-15 weapons, which cost about $700 each with an additional $500 Glock 19 on their belt. These officers also wear an increased amount of armor, which includes $200 bullet-resistant vests and $1,000 helmets.

When all these prices add up, New York City is looking at a bill for about $540 million on anti-terrorism efforts by the ESU, police and fire departments. Thankfully, the federal government pays for $400 million of that and taxpayers come up with the rest. However, this is a small price to pay to ensure protection and safety through the United States.

slider-2

Sources:

http://money.cnn.com/2016/09/19/news/nyc-terrorism-cost/index.html?iid=hp-toplead-dom

The Cost of Terrorism Is Higher Than Ever Before

http://www.cnn.com/2016/09/19/us/new-york-explosion-investigation/

How street closures, transit delays will affect your Monday commute after Chelsea explosion

http://www.nytimes.com/interactive/2011/09/08/us/sept-11-reckoning/cost-graphic.html

Adapting Immediacy – The Fashion Industry

screen-shot-2016-09-20-at-12-21-44-am

New York Fashion Week has influenced the fashion industry and consumer tastes since 1943. It occurs twice a year in February and September, and it traditionally features styles that will be released in the following season. This has given designers and editors time to publish glossy photos and build hype for what was to come; however, as the most recent round of catwalks and glamour has come to a close, a new trend is emerging, and it is not even related to the style of the clothes themselves. What is changing the fashion industry is the idea of “see now, buy now.”

Burberry rattled the industry when it was the first to make this dramatic decision in February 2016. With the idea of “runway to retail” in mind, the products shown on the catwalk were available for purchase promptly after the show. The styles were labeled “immediate and season-less,” and the motivation for this decision was clear.

screen-shot-2016-09-20-at-12-22-59-am

Fast fashion brands such as Zara and Forever 21 can whip out new styles from sketches to the shelves within a few weeks. With the help of the Internet, this means that the items can also quickly go out of fashion because of overexposure and instant popularity, especially if online influencers feature photos of themselves wearing similar items. The brands are notorious for mimicking the styles of high-end designers, so this means that by the time Vera Wang, Marchesa, and the like release their products months after their initial catwalks, they risk their styles looking dated and having less demand than they would have six months prior.

This comes at a time when people are constantly looking for immediate gratification, so it makes complete sense that designers are having to change their business models to fit what consumers want. Since February, several brands such as Tom Ford, Michael Kors, and Proenza Schouler have adapted in order to keep up with this changing industry. This requires the brands to adjust their production and supply chain, which is difficult for companies that have been running the same timeline for decades. High fashion used to be about scarcity and standing out, but nowadays, people are able to get their hands on just about any style they so desire.

screen-shot-2016-09-20-at-12-26-00-am

In the modern era, shopping has become an addictive pastime, and according to NYU marketing professor Tom Meyvis, it elicits the most joy when consumers are able to browse, see something they want, and have it immediately. Just look at the increasingly rapid delivery times of online retailers. Fast fashion has perfectly filled this gap by shortening the delivery time, and if high-end brands want to keep up, they have no choice but to change. This cat-and-mouse cycle might actually be benefitting consumers in the end because data from the U.S. Bureau of Labor Statistics shows that even though there has been an overall increase in the price of retail goods, there has been a decrease in the price of clothing. Increased competition usually benefits the consumer, and the vast power of media and the Internet only adds ammunition.

Mattress Stores: A Look Inside America’s Comfiest Industry

It seems today that every strip mall in America has a mattress store in it. In fact, according to IBISWorld, a market research website, there are at least 9,200 stores selling mattresses in the United States. To put this in perspective, Starbucks has nearly 12,700 domestic locations and people buy more coffee then mattresses.

How did we get here? In part, mattress stores are everywhere because they are incredibly profitable. Unlike most industries where margins can be as low as a few percent, most mattresses are marked up between 40 and 100 percent according to Uptal Dholakia, a professor of marketing at Rice University.

In addition to the high margins, the uptick in mattress stores is indicative of high demand after the Great Recession when many Americans put off buying mattresses.

“People were moving much less; they were staying put in their houses,” said Dholakai in an interview with Freakonomics Radio. “During the recession, for a period of five or six years, people just stopped buying mattresses, and so there was a lot of pent-up demand.”

This demand has in turn led to major consolidation in the mattress industry as Mattress Firm has incorporated Sleepy’s, Mattress Pro, and Sleep Train into itself without closing many retail locations.

So far the demand for mattresses appears to be exceeding the supply as online direct-to-consumer mattress start ups appear. Companies such as Casper, Yogabed, Leesa, and Loom & Leaf, among others, have grown to make up 6 percent of the mattress market. Their early success has prompted investment from venture capitalists who believe that the mattress market will continue to expand to accommodate consumer demand.