Many people lost their manufacturing jobs to robots, but will the same thing happen with trucks? (Revised)

Big tech money is chasing the development of self-driving trucks. Google, Uber and Tesla are investing heavily in this technology and a new autonomous truck startup called Embark has already pulled in $17 million of series A funding.

Though Silicon Valley is pouring money into self-driving trucks, it’s hard to tell when this technology will become widespread and cause an economic dislocation for a significant part of the American workforce.

Accurately pinpointing a time frame for when this disruption will occur is important for trucking, its related industries and consumers. But there are many variables that still need to be accounted for when estimating how many years it will realistically take for these trucks to become widespread.

Because of the inherent uncertainty in self-driving trucking projections, it is unclear how immediate the labor problem is. According to an Obama-era White House report, two million trucking jobs out of 3.27 million are already threatened. Automation is going to happen, but when it does and the extent to which it will affect jobs is up in the air, said University of Pennsylvania professor of economic sociology, Steve Viscelli.

“There’s a dichotomy of it’s [automated trucks] either never going to happen,” Viscelli said, or automation could happen in the near term and create a trucking jobs crisis.

As of now, most truckers are still employed. But within three to ten years though, Viscelli says Google, Uber and Embark, along with other companies could surmount the difficulties that self-driving trucks are currently facing.

But Jerry Lake, who runs a trucking business with his son and wife out of small-town Montrose, Colorado, says the variables that he faces daily on the road are hard for a machine to predict and he thinks it’s a bad idea. He doesn’t see the complete switch to self-driving trucks happening as soon as Viscelli predicts or even happening at all.

“I don’t even know what the advantage is or what they are trying to accomplish other than the fact that they can do it,” Lake said. “Then you’re taking jobs away from people in America.”

For Lake’s local business, it doesn’t make any sense for him to switch to automation at all for his small fleet of two trucks.

First, retrofitting trucks for full automation is expensive. It costs about $23,400, according to the American Transportation Research Institute, and would not be cost effective for Lake’s business. Second, the specialized, localized trucking that Lake does requires extra knowledge of county and city roads, as most of the driving he does — 65 miles one way between Montrose and Grand Junction — aren’t on interstates.

Lake has trouble believing self-driving trucks can keep up with the monotony of long-haul trucking. “I have a problem with all the variables you run into — accidents and weather — that the truck can react in time and the drivers can’t always do that either,” he said.

Mapping roads in a way that is compatible with these trucks is another difficult variable to overcome. Google claims that they have mapped 99 percent of public roads in the United States, as of 2014; but that still leaves around 40 thousand miles of unmapped roads, or 8 round trips from L.A. to Miami.

Viscelli said basic sensor limitations hold back trucking as well. Most light detection and ranging (LIDAR) systems in use on these prototype trucks can only see three to four hundred feet in front of them. But driving at 55 miles per hour, it will take over 400 feet to stop a truck with an air brake system, according to the Department of Motor Vehicles. The automated system leaves no room for error and can pose a safety risk.

In an economic sense, the cost-benefit analysis doesn’t make sense yet. It will cost more to total a truck and possibly kill people on the road due to faulty automation programming or equipment than to deliver freight or a package without paying a driver.

At the same time, self-driving technology is making major strides in its development. Uber’s truck Otto transported 51,744 Budweiser cans for 120 miles between Fort Collins to Colorado Springs. The delivery had a police escort and a driver observed from inside the truck. Still, the proof of concept is rock solid.

https://www.youtube.com/watch?v=Qb0Kzb3haK8

The TraPac terminal in the Port of Los Angeles is completely automated; from the cranes to the four-legged trucks that load crates onto still human-operated tractor-trailers. And Long Beach isn’t too far behind. Amazon warehouses use robots instead of fork lifts and they are already working on using drones for deliveries.

The manufacturing sector has lost around 8 million jobs because of automation (which was started by General Motors in 1961), globalization and the Great Recession from 2008 to 2010. Trucking could also displace a large majority of America’s workforce with the allure of a more technologically-oriented supply chain.

Not having to pay for driver’s wages and benefits will translate to lower prices in the store for consumers, but at the expense of a large portion of the population being unemployed and failing to reach their productive capacity.

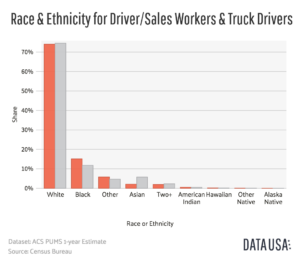
The trucking industry is dominated by white males with an average age of 45. Around 95 percent of people who work in the industry are male and 75 percent are white. That matches up surprisingly well with the rest of the U.S., which is 77 percent white. So if trucking were to ever be completely automated in any way at least 10 percent of America’s workforce will go away.

Race distribution in trucking.

Truckers have won a small battle in U.S. Congress to ban legislation on self-driving trucks and cars that are under 10,000 pounds, but as more pressure from tech companies mount, it’s unlikely to hold forever.

When self-driving trucks eventually become commonplace, the driver demographic will have trouble finding other work that requires higher level education. Most truckers don’t have college degrees, according to the Bureau of Labor Statistics. And middle-aged drivers will find that university education has skyrocketed at a rate faster than inflation. In a Bloomberg report, college tuition and fees have increased 1,120 percent since 1978.

Plenty of other professions are at risk too. An Oxford survey predicted that 47 percent of jobs around the world will be taken by robots in the coming decades. And it’s probably going to hit truckers first.


[Final]Can Natural Disaster Ever be Good to Economy?

Hurricanes, earthquakes, and wildfires … America and the world have been entangled by natural disasters recently. The natural disasters never could be considered as a positive force because of the destruction and death the bring. However, disasters also tend to make reconstruction the primary task for the government, making it easier for public money to flow into hard-hit regions. Economically, in what case would natural disasters be a boost to the regional economics? It depends the previous economic status of the affected region and the immediate assistance efficiency from the government.

In Sichuan, China, where a magnitude 8 earthquake took place in 2008, is an example how the local economy can recover and even expand during the post-disaster reconstruction. Poor infrastructure exacerbated the damage, leading to an official death toll of 87,150 and 4.8 million people homeless, according to the BBC News. The economic loss was estimated at $191 billion, the second highest in absolute number in history, according to 2013 CATDAT Damaging Earthquake Database. The noteworthy part was that the central counties in 2008 Sichuan earthquake, WenChuan and Ya’an, were neither a raw material production base nor manufacturing zone. Actually, these counties were poor. Thus, the earthquake did not hurt the Chinese exports or GDP to any great degree.

The rebuilding efforts cost the Chinese government almost $150 billion, equivalent to a fifth of its entire tax revenues for a single year, according to the state media of China in 2008. Quickly after the earthquake happened, the National Development and Reform Commission of China announced a reconstruction plan that “envisages buildings 169 hospitals and 4,432 primary and middle schools to replace collapsed structures. Another 2,600 schools that remained standing will be strengthened. More than 3 million homeless rural families will get new houses and 860,000 apartments in the city will be built.”

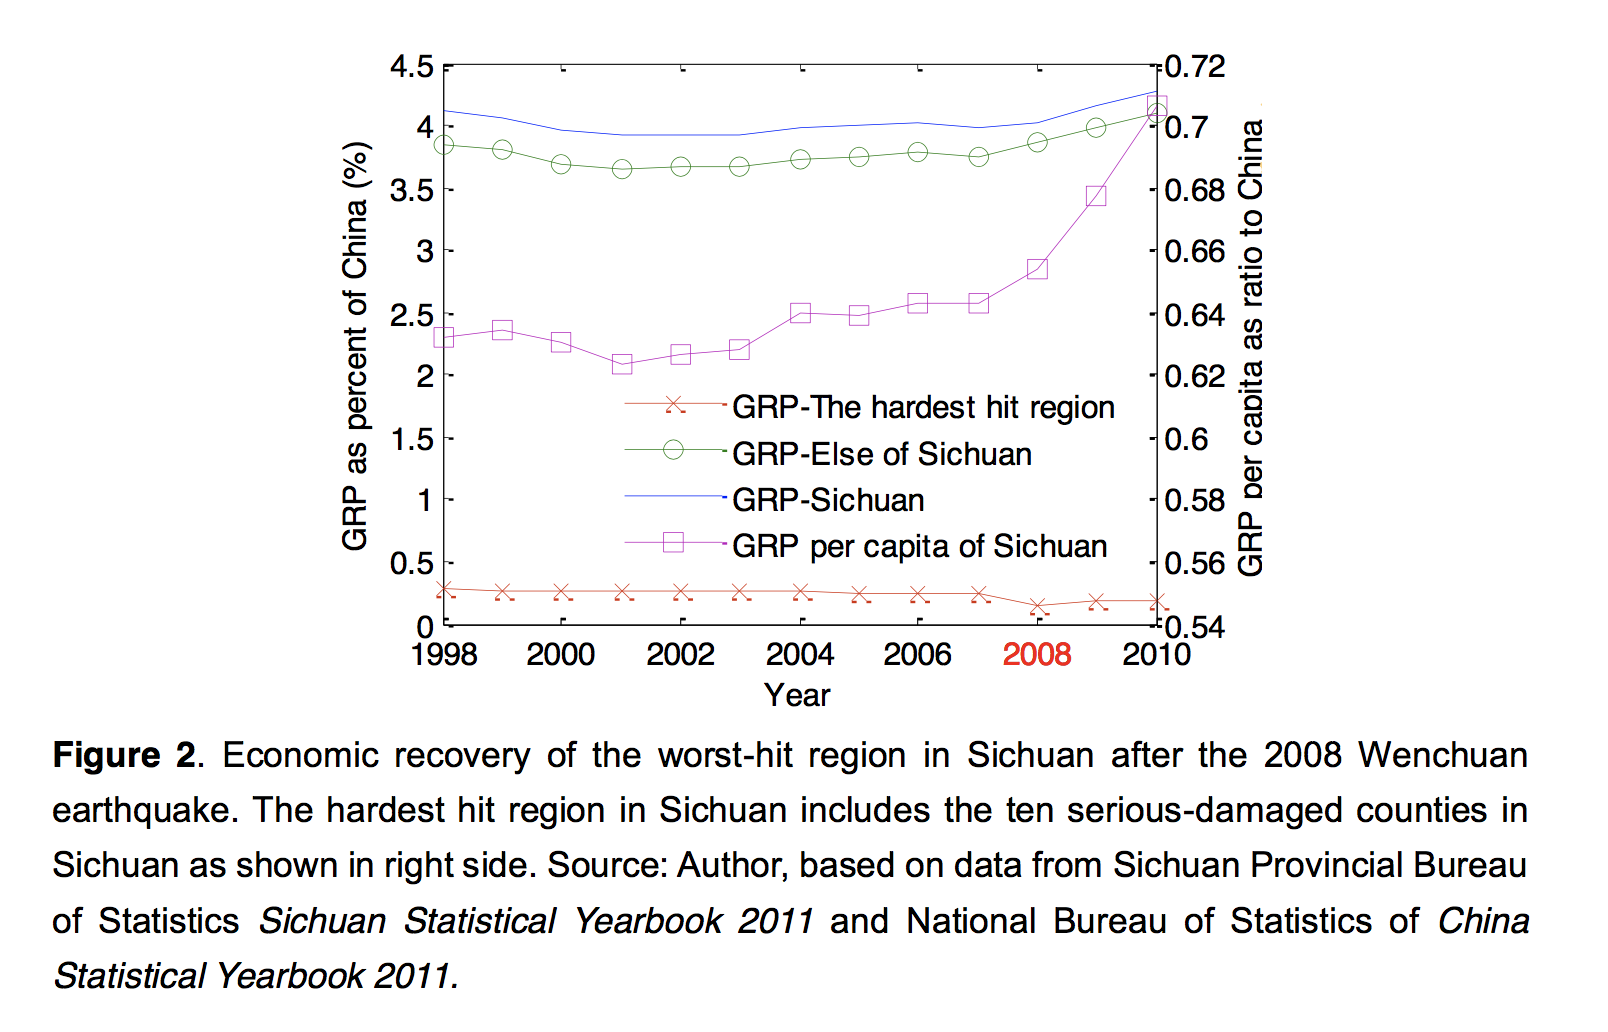
Relying on such tremendous capital investment, the regional economy of Sichuan was able to recover in an amazing speed. Here is the chart associated with the Gross Regional Product(GRP) of Sichuan from 1998 to 2010.The blue, yellow, and green line respectively indicate the GRP of Sichuan, of the hardest hit region of Sichuan in 2008 earthquake, of else of Sichuan, in the form of percent of Chinese GDP. The pinkish line represents the GRP per capital as ratio to Chinese GDP.

The graph tells that before the earthquake happened, the hardest hit region in Sichuan earthquake, which is composed of the ten serious-damaged counties, generated about 0.25% of Chinese GDP. Meanwhile, the Sichuan generated about 4.1% of Chinese total GDP.

By 2010, 2 years after the earthquake, the GRP of Sichuan and the GRP of non-central damage area of Sichuan both not only recovered but even had growth.

“The GRP level of the worst-hit area of Sichuan decreased by 35.4% in 2008 compared to the 2007 level. After three years of reconstruction, the region had still not returned to its pre-earthquake GRP level, but the GRP level of the rest of Sichuan experienced a boom in those three years because of the reconstruction demand stimulus,” according to a studies conducted by MOE Key Laboratory of Environmental Change and Natural Disaster of the Beijing Normal University.

The GRP per capital in Sichuan had a huge growth; however, it is meaningless considering the tragic death tolls.

In a article published by China Daily , by 2012 when reconstruction basically completed, the Deputy-Governor of Sichuan Gan Lin said, Sichuan was the fastest growing of the major economic provinces in China. China Daily asserts “the quake zone has seen unprecedented changes.” Governor Gan said, during the past four years, Sichuan’s GDP doubled more than 2 trillion yuan ($317 billion), enabling its per capita GDP to surpass $4,000.

*A noteworthy point for the above statement is the “go west” strategy to increase inland development formulated by the State Council in 2000 also plays an significant factor to Sichuan’s growth.

“When something is destroyed you don’t necessarily rebuild the same thing that you had,” said Mark Skidmore, an economics professor at Michigan State University. “You might use updated technology, you might do things more efficiently.” With massive amount of national resources, “the disasters allow new and more efficient infrastructure to be built, forcing the transition to a sleeker, more productive economy in the long term, a New York Times article commented on the Sichuan Earthquake in July, 2008.

More practical and explicit reflection of the benefits from 2008 earthquake to Sichuan region comes from the 7.0 magnitude Sichuan earthquake in Ya’an. According to the BBC report, “none of the buildings built since the Sichuan earthquakes collapsed.” The quality of housing for sure has improved.

However, the previous economic condition of the hardest hit region in Sichuan earthquake facilitated the recovery session. A New York Times article wrote about one month after the earthquake, “only 1 percent of China’s population lives in the hardest hit quake-affected area, in northern Sichuan Province. Those residents account for an even smaller share of China’s economic output, because many of them are impoverished farmers.” In other words, these areas might not receive this much of national investment or resources within short period of time.

The economic affects brought by Northridge earthquake in 1994 was a different story. That 6.7 magnitude quake struck an area of 2,192 square miles in the San Fernando Valley, causing 57 people killed and 11,800 injuries. It is still ranked by CNN Money as the most expensive earthquake in American history, costing $44 billion.

In the research “The Northridge Earthquake, USA and its Economic and Social Impacts” conducted by Professor William J Petak from University of Southern California and Research Fellow Shirin Elahi from University of Surrey explains the difficulty of reconstruction for Northridge area, “Northridge earthquake was a direct hit on an urban area and the scale of losses caused by the earthquake far exceeded expectations.”

Unlike regions in Sichuan, US has a large concentration of localised industries, such as the entertainment and aerospace industries in southern California, which was severely undermined by the earthquake, the research argues. Moreover, unlike most people lived in Sichuan’s affected regions were rural farmers, San Fernando Valley supports half of the city of Los Angeles’ population. “Approximately 48% of the population were homeowners – middle class and therefore not obviously insecure- yet many proved to be vulnerable to the hazard,” the Northridge Earthquake research claims.

Another important factor that determines the success of reconstruction after catastrophe is how effective and efficient the state or the federal government respond to the recovery assistance. The highly-centralized government system allowed the Chinese government to respond Sichuan Earthquake immediately, ordering national assistance and resources investment. Kevin L. Kliesen, Economist from Federal Reserve Bank of St. Louis wrote in his article “The Economics of Natural Disaster,” explains the difference in American government, “although emergency funds for food and shelter are usually disbursed immediately by Presidential directive, monies for longer-term rebuilding efforts are often appropriated by Congress with a substantial lag.” The research “The Northridge Earthquake, USA and its Economic and Social Impacts” criticizes the reaction from the government during the Northridge Earthquake. The research attacks the lack of “a desire for a recovery to reproduce a return to normalcy, and achieve the status quo of the socio-economic and built environment prior to the earthquake.” Many federal, state and local officials were not willing to sacrifice their own political, economic, social or environmental agenda to cooperate to help the affected regions, the research asserts. They were at best willing to make adjustment.

An extreme case is the Haiti’s response to earthquake. The Bernard L. Schwartz Chair in Economic Policy Development Martin Neil Baily wrote in an article for Brookings that Haiti, which is too poor to manage the immediate recover after hurricane, has to wait international aid to get basic rebuilding, leaving alone economic growth. It is so difficult for Haiti to recover.

The study of economy in disasters is not new. In 1969, Douglas Dacy and Howard Kunreuther, two young analysts at the Institute for Defense Analyses, published a book called “The Economics of Natural Disasters.”  It was probably one of the first attempts to measure the economic influence of catastrophe. The book argues that the dreadful Alaska earthquake of 1964 helped the Alaska economy by garnering government loans and grants for rebuilding.

“We got a lot of hate mail for that finding,” said Kunreuther, now a professor of business and public policy at the Wharton School of the University of Pennsylvania.

The theory of economic boom from disasters also received criticism.“Over any reasonably relevant period of time, society is not made wealthier by destroying resources,” Donald Boudreaux, an economics professor at George Mason University, said. If it were, “Beirut should be one of the wealthiest places in the world.” Economist Frédéric Bastiat labeled the disastrous economy theory as “the broken window fallacy” in his article “What is Seen and What is not Seen.” Bastiat compares the disaster reconstruction to fix a broken window. It costs $100 dollar to fix a window. The repairman and window shops got money because the window owner pays it. In the reconstruction case, the money comes from tax payers or just money printers. The natural disaster could be an economic boost to a region, but it always is an economic downturn for the whole nation.

In conclusion, the theory model of disastrous benefits for economy should be viewed as that the areas that would not receive national resources or investment during the normal time becomes privileged after suffering catastrophe. It also gives these areas more opportunity and capital to develop during the reconstruction period. The previous economic condition of the affected region and the efficiency of government assistance determine the success of the recovery. Despite to the regional growth, we should never be positive toward disasters because it never generates economy but merely redirects capital and resources to recover a definite loss of wealth.

Grameen Bank and Microfinance: Debates and Controversies

Microfinance was born in the early 1980s when an economist named Muhammad Yunus came across women in poverty from the villages of Bangladesh. In face of the widespread famine and poverty, some of these women and their families were controlled by loan sharks, and had no other resource to turn to because traditional banks considered them not creditworthy. Muhammad Yunus repaid the women’s debt and helped them get loans from the bank as a guarantor. Soon, working with the poor made him realize that lending money to the disadvantaged is a great business opportunity: they were trustworthy, hardworking people. He then created Grameen Bank, what we consider a pioneering model of social enterprise, to help break the cycle of poverty.

Muhammad Yunus has received a Nobel Peace Prize in 2006 and a US Congressional Gold Medal in 2010, among many other prizes, as recognition of his contributions to the fight against global poverty. Despite the approbation Yunus has received, the concept of microfinance has been the subject of many debates and controversies. Some critics question whether microfinance is truly an effective way to lift the poor out of poverty. Others make the claim that instead of helping the poor, microfinance institutions (MFIs) make their clients poorer, as they become victims of a vicious spiral of over-indebtedness. It is important for us to understand this debate to keep us attentive to ensuring that we remain on the right track as we’re trying to fight global poverty. However, in order to understand the debate and the truth about microfinance, we need to first understand how the model works.

For over three decades, the Grameen Bank has succeeded in reaching the poor, while traditional banks ignore this population. Grameen bank established branches and sent representatives into remote areas of developing countries, and took on many clients there. The reason why Grameen was able to do that is that borrowers do not need collateral to get a loan. This policy allows access for the disadvantaged to get loans more easily to support their small businesses and livelihood. These loans are typically made in very small amounts, averaging at $200 with an interest rate below 20%, hence the “micro” in microfinance. Grameen Bank is also different from traditional banks in that it has a financially self-reliant model. In an article published in The Round Table, Yunus explained his bank’s business model: “Grameen has funded 90 percent of its loans with interest income and deposits collected, aligning the interests of its new borrowers and depositor-shareholders since 1995.” Essentially, the bank encourages all borrowers to become savers, so that their local capital can be converted into new loans to others.

In addition to the no-collateral borrowing system, another fascinating fact about Grameen Bank’s operation is that 97% of the borrowers are women. It is a brilliant business strategy because women statistically have a much higher loan repayment rate than male, for that women tend to make more conservative investments. Yunus have recognized this, and made women his target client. In an interview with The Guardian, Yunus said that he expanded the program into the US and established 19 branches in 11 cities, including eight in New York. “We have nearly 100,000 borrowers there now and 100% women. Not a single man.”

Yunus’s decision to give microloans to women isn’t just good for business, it accomplishes so much more. In rural Bangladesh, many women are essentially confined to their husband’s family compound, and are in a rather powerless position both socially and economically. Girls are usually married by 16, sometimes as young as 11. Most of the time, there are no medical professionals in attendance when women give birth. Women are expected to keep their eyes down and their voice soft, even at home. It is not considered proper for women to go to the market, or to be seen by men outside their family. Microfinance serves and empowers these women, who are often overlooked in society by giving them access to a small amount of capital so that they can buy seeds, chickens or a cow and start and grow their small businesses. Often, this allows them to earn enough to provide three meals a day instead of two for their family and their children, of whom 40% are malnourished. It also gave them a bit of cash to pay for medicines if a family member got sick.

The main criticism microfinance face is that borrowers may face abusive interest rates and end up become overwhelmed by their debt. While some institutions like BRAC have models similar to Grameen and provide services with the goal to combat poverty, other banks that label themselves as MFIs use predatory lending and collection practices. These companies charge up to 200% for interest, and some of them employ collection methods so harsh that they had driven some borrowers to commit suicide. According to an article from The Atlantic, critics often use SKS Microfinance as an example to argue that microfinance is a plot to steal from the poor and give to the rich. The company held a public IPO in 2010 that made millions for its founder, ex-McKinsey-consultant Vikram Akula. Another example is Banco Compartamos, a Mexican bank that Compartamos charges an annual percentage rate in the range of 75-100%, and raised nearly half a billion dollars in its IPO.

However, these banks do not fit the microfinance model Yunus proposed. In fact, Yunus himself is outraged by this kind of microfinance companies that make huge profits off of the backs of the very poor. He blasted Compartamos, saying, “microfinance was created to fight the money lender, not to become the money lender.” The majority are still small or very small entities that are working hard to achieve financial self-sustainability. A BYU study found that among the 148 MFIs they interviewed, only 57 are self-sufficient, and fewer report profits. The majority of the MFIs around the world are not influenced by the predatory model mentioned above, and are operating as non-profits. For-profit MFIs that uses abusive interest rates are only a small fraction of the microfinance market, and should be a reason to motivate more effort put into regulation, instead of being used to denounce microfinance as a whole.

Moreover, Aneel Karnani, a professor of strategy in University of Michigan comma published an article in Stanford Social Innovation Review, in which he argues that microfinance is not an efficient way to alleviate poverty. He claims that instead of microfinance, best way to eradicate poverty is to create jobs and to increase worker productivity. Karnani points out that most microfinance clients are not “micro-entrepreneurs” by choice, and that these borrowers would “gladly take a factory job at reasonable wages if it were available.” Therefore, he believes by people are strying away from the real effective way to fix the economy. It is true that on a macroeconomic scale, most people agree that employment is the fundamental link to poverty reduction.

However, the problem that MFI clients face in these rural areas of Bangladesh is precisely the limited opportunities for steady employment at reasonable wages. Within the status quo, microfinance is still the best opportunity for people who seek temporary financial relive and are hoping to kick start their small business. The story of Manjira who, years before, was living in extreme poverty in Bangladesh, illustrates the impact a Grameen loan can have. She had lost a young son to a sudden illness. She told the reporter at New York Times that her most painful memory was the day before her son died. He asked her for an ice cream that cost one taka (about 2 cents), but she didn’t have the money to give him that. A few years later, she managed to get a small loan through Grameen, and had become a successful seamstress. Now, she is one of the board members of Grameen Bank, along with three government representatives and eight other village women elected by the bank’s more than 8 million members.

Over the years, many other women like Manjira have found means to provide for themselves and their family with the help of microloans. As women build up their business, overall consumption increases and its benefits also extend outward to the entire community, including those who are participating in the program. However, it is important to keep in mind that microfinance does not automatically empower women. Governments and international organizations in developing nations should tighten regulation over microfinance institutions and be sensitive to the country-specific and cultural factors that play a key role in determining how microfinance interacts with the local community.

Clouded Business Models – The Complex World Behind Electrical Vehicle Charging Stations

According to Google Maps, the Mobil gas station located at 8489 Beverly Blvd in West Hollywood is surrounded by charging stations for electrical vehicles. This isn’t surprising, because the number of EVs in California is increasing, and this particular area is ideally located at the intersection of two main arterial roads in Los Angeles: Beverly Blvd and La Cienega Blvd. This image raises an important question: are these charging stations competing with gas stations?

Bhulu Ahmed, the Mobil station’s owner, said that he hasn’t seen any change in his business over the past few years. “To be honest,” he added, “I do not see many EVs around here.” He explained that he has been working in the area for almost thirty years and, although the number of EV drivers has increased, he still serves the same number of customers as usual.

Perhaps the reason why Ahmed hasn’t experienced significant changes is related to the clouded business model behind charging stations. Indeed, it is still unknown whether EV charging stations will replicate the gas station’s business model, or whether the electricity offered for free by many plug-ins’ owners could prevent entrepreneurs from opening stations where drivers must pay to charge their vehicles. This current situation is a combination of two main factors.

On one hand, the state of California has set ambitious targets for EVs and made automakers commit to putting EVs on the market. Lisa Chiladakis, manager at Veloz, a Sacramento-based non-profit organization dedicated to increasing awareness about EVs, pointed out that the government’s goal is to have 1.5 million EV drivers by 2025. But people will not buy more EVs if they do not see an increasing number of charging stations, and the state will not provide more charging stations if the number of electrical vehicles does not increase. On the other hand, there are neighborhoods, such as Beverly Hills, that  offer power for free, as an incentive to attract shoppers. Accordingly, a new set of free-electricity providers has evolved; as stated by PlugShare’s chief executive Brian Kariger, some malls, supermarkets, and stores have chosen to offer free electricity because “some businesses install charging stations to attract customers.” This type of free-electricity business model makes it tough to see how EV charging stations could become the gas stations of the future.

Sorean Kim, a woman I interviewed at The Grove, said that she was taking advantage of the free charging station while shopping: “I found free places near my work and my home and actually my commute is not so far, so I do not have to charge my car very often.”


It’s Complicated

According to PlugShare, one of the most popular apps that allows users to find and review charging stations, none of the five charging stations close to Ahmed’s Mobil station has the same connector type or charges the same price. The closest one, at the Sofitel Hotel, has two J1772 EV plugs that cost $18 to use, once under six hours of parking is purchased. Another charging station in the area, at the Elan Hotel, has a Tesla plug type and the J1772. Unlike the Sofitel, the Elan does not require parking payment, just charging payment. Nearby, between Burton Way and La Cienega Blvd, there are also charging stations at Trader Joe’s; there, drivers do not pay for parking, but they have to pay a fee for the charge through Blink, a network of charging stations for EVs. From this, it is easy to see that all these places, within just a few miles, are assigning different values for the same product.

“The cost of the electricity is determined by the owners of the charging equipment. Some choose to charge. Some offer free charging as a customer incentive. Some fold the cost of the charge into parking or HOA fees,” stated Jennifer Allen, the supervisor of the zero-emission vehicle and infrastructure office within the California Energy Commission’s Fuels and Transportation Division. Moreover, the owners determine prices according to the type of charger level; a level 2 usually requires between $1 and $5 per session, while the DC fast-charging plug-ins require drivers to pay higher prices for the convenience of charging their cars in a very short time.

Kariger explained how payment methods work in EV charging stations: “Station owners and operators choose pricing. For example, if you own a parking lot you could choose to purchase a charger from SemaConnect, one of our partners, and once it was installed in your lot, you’d log into a website to set pricing as you see fit. Your station would then appear in PlugShare, and drivers would enter their credit card information into the app to pay and be on their way.”


Not Yet Defined

Might the free charging station model endanger the emergence of other models as well as the expansion of EVs? When I asked my interviewees if they see a potential long-term business model based on charging EVs with free electric power, each of them answered that it is unlikely.

Allen, of the California Energy Commission, stated that there are even gas stations selling electricity for electrical vehicles right now. Indeed, even though it seems that the free charging station model is still growing, “free stations aren’t always the best option.” Indeed, from its data analysis, PlugShare found that drivers are willing to pay for features like faster charging and for being able to plug in at convenient locations along the highway during a long-distance trip.

Yet business models are being developed, even though there are free charging stations available. They range from the home-model; the networking-model pursued by companies such as ChargePoint, Blink, SemaConnect, and eVgo; and the super-fast-charging-model. As Kariger pointed out, “one of the effects of having all of these less expensive, and in some cases consumer-owned, distributed energy resources is that it is opening up the energy business to more open models; for example, peer-to-peer energy trading. Electric vehicles themselves are mobile energy resources, and there are already pilot programs underway in which utilities and grid operators pay EV drivers for sending energy back into the grid. So not only will EV drivers be able to get reduced rates or free electricity, they will be able to sell energy to others as well.”

Overall, it seems that electrical vehicles are slowly reshaping the gas station business model that we are used to. We do not know yet which model will be the winning one, but surely many others are yet to come as the industry continues to evolve.


Revised: Education: A Catalyst in Gender Pay Gap


Education: A Catalyst in Gender Pay Gap

In President Barack Obama’s 2015 State of the Union Address, he stated that women “make 77 cents for every dollar a man earns.” If a woman had a dollar, or even 77 cents, for every time she heard that statistic, it would cover lunch for a week. While this statistic, a ratio of two medians for full-time, full-year workers, can be problematic in that it doesn’t account for pay for the same work, it is true that a gender pay gap still exists in the United States; the female-to-male earnings ratio in 2016 was only 80.5%, although up from 70% in 1990 (U.S. Census Bureau).

Determining the causes of the gender pay gap is not a simple task. Communication surrounding the disparity is plagued by inaccuracies, as evident in Obama’s SOTU. Media coverage tends to say that the gap is caused by discrimination. Claudia Goldin, professor of economics at Harvard University, explains that while this was once the case, it is no longer a significant cause. She also reasons that another popular argument, categorical differences such as competitiveness and negotiation skills, doesn’t go the full degree in explaining the pay gap either. When featured on the Freakonomics podcast “The True Story of the Gender Pay Gap,” she deemed that the main reason for disparity is the high cost of temporal flexibility, valued more by women than men.

Temporal flexibility is “the variation in the number of hours worked and the timing of the work” (Oxford Reference).  Women value this flexibility so highly because they disproportionately have caregiving obligations—watching the kids, looking after their parents, assisting sick family members, etc.—which require them to work differently. It is important to note that not all women desire this temporal flexibility. In fact, the National Longitudinal Survey of Youth found that in 2006, women without children or spouses earned 96 cents for every dollar a man earned. The gap between men and women who place similar amounts of importance on temporal flexibility is somewhere in the 95% range, according to Princeton Professor Anne-Marie slaughter, who was also interviewed on Freakonomics. But since many other women disproportionately dedicate time to caregiving without compensation, they are willing to pay the high costs for flexibility of hours scheduled and worked.

This high price that women pay is reflected in their salaries. Glassdoor reports that the top five jobs in which women earn less than men, four of which are the following: chef, dentist, c-suite, and psychologist, all of which have at least a 27.2% base pay difference. The costs of temporal flexibility in these types of jobs are the highest because they are so specialized.  A chef’s signature dish cannot be made by a different chef, and a patient’s wellness is dependent on his intimate relationship with his specific psychologist. These workers aren’t substitutable, so the handoffs are more costly. These handoff costs are reciprocated to costly workers, who work fewer or their own hours and thus cause more handoffs.

When women enter these types of careers, they are initially paid similar wages to their male counterparts. However, when they begin to have children, or start caring for someone else, they can no longer adhere to the requested hours set by their employers. Since they cannot devote all of the hours needed by their clients to them, they don’t receive raises, aren’t made partners, and can’t grow their careers. Women work fewer employer-requested hours and consequently notice negative effects on their salaries. The high cost of temporal flexibility is a partial cause of vertical segregation, defined by Stanford University’s Topic Report as “the overrepresentation of a clearly identifiable group of workers in occupations or sectors at the top of an ordering based on desirable attributes.” In this case, men are overrepresented as c-suite workers, dentists, etc. because they possess a desirable trait—a low value on temporal flexibility.

The difference in the value of temporal flexibility by gender also influences horizontal segregation, “the concentration of men and women in professions or sectors of economic activity” (Stanford).  In choosing occupations, men tend to choose sectors where levels of responsibility are high. The UNC Population Center published North Carolina’s largest jobs by sex, and men’s were drivers, managers, supervisors, laborers, and salespersons. The majority of these do not allow for flexibility in work hours, an adverse effect of requiring lots of responsibility. Inversely, many women go into careers that are compatible with their family lives. In North Carolina these were elementary school teachers, nurses, secretaries, and health aides. The flexibility for teachers and nurses stems from their abnormal work schedules. Teachers work shifted hours, which align with children’s school schedules. They additionally have summers off and longer holiday breaks. Nurses do not have typical 9-5 hours either. They have options to work night shifts, allowing them to be home during the day. These types of occupations offer more part time employment opportunities and have smaller penalties for career pauses, so women gravitate toward them.

There is a bright side, though. In 2012, Pew found in its analysis of the U.S. Census Bureau data that the number of women enrolled in college outnumbered men by 11%, (See Appendix A). And female earnings increased 2.7% from 2014-2015, while men’s only increased 1.5%. Hence, the gender pay gap is shrinking. Hannah Rosin, in her Atlantic feature, “The End of Men,” argues that economic success is shifting away from being determined by attributes typical of men, e.g. physical strength and stamina. More women are entering the work force. Women entering new fields are dedicating less time to unpaid domestic work, making them more valuable workers who are paid more. This also creates a new need in the labor force for domestic workers. These jobs are being filled by women.  The typical working wife earns on average 42.2% of the household annual income, which was 2-6% in 1970. Four out of ten mothers are now the primary moneymakers in their families. Wage gaps are shrinking for these ideologically normal women who have traditional families and are of high socio-economic statuses. But how can the United States shrink the gender pay gap for all of its women?

The countries with the smallest gender pay gaps are Iceland, Finland, Norway, and Sweden–all Nordic countries, whose populations combined roughly equal that of Texas. They’re all also welfare states with little population diversity. The differences between the United States and the Nordic countries are significant in explaining their differences in gender pay and illustrative of why they will continuously rank highly while the U.S. will not.

Over time, traditionally male professions are becoming increasing female-dominated. In a study on occupational feminization and pay, researchers found that when controlling for skill and education, professions with more women pay less than those with less women. This is seen in recreation, design, housekeeping, and biology. The reverse happened in computer science; when men started flocking to the field, salaries rose significantly. These changes in pay can be partially attributed to the devaluation of work done by women, a result not of temporal flexibility, but of creeping gender bias. Tangible solutions to the devaluation of women’s work lie in creating structural, systematic change, which would be a huge undertaking for the United States.

One area with huge practical potential to decrease the gender pay gap for everyone is the U.S. school systems. Primary education is an enormous hindrance on working parents, especially in the case of mothers who disproportionately handle childcare. It’s also a huge handicap for working single-mothers and other non-traditional working caregivers. Primary education reforms can reduce the amount of temporal flexibility that working women need.

Take, for example, Germany, which ranked 13th best in global gender pay in 2016 (the U.S. ranked 45th out of 144 countries). Kerri Shigo, former senior marketing manager at Microsoft, moved to Munich with her husband and four children in 2008. Shigo had previously worked part-time at Microsoft to take care of her children. Upon moving to Germany, she took a long-term break from working. In conversation, Shigo expressed that she regretted quitting work for the years that she lived abroad. A large factor that led to this regret was the pre- and primary-schooling in Germany. Her youngest child attended kindergarten, Germany’s version of pubic preschool, from age three to six. The kindergarten school week ran Monday through Friday, and days lasted from 8:00 am until 4:00 pm. Kindergarten school days are set-up so that mothers who need to drop-off and pick-up their children can still work a full eight-hour workday. Another benefit of the German school system is its calendar year, which runs on a somewhat year-round schedule; students are in class for two months, then they have a break that alternates between one and two weeks. Working mothers don’t have to worry about arranging flexibility of timing at work to care for their children during a lengthy summer vacation. Instead, their holidays align more closely with their children’s, so they can use their paid vacation for the other breaks.

Germany’s public-school system is supportive of reducing the amount of temporal flexibility that working moms need, effectively contributing to its smaller gender pay gap. It would be beneficial for the United States to reform its education system, borrowing from some of Germany’s ways. Lowering the age in which children start school would allow working-mothers to return to their jobs after childbirth earlier, if they choose to do so. Shifting the school day to more accurately reflect the work day could allow women to work on their companies’ hours instead of their own. Lastly, reforming scheduling of the school year to eliminate a lengthy summer break and instead have shorter breaks more reflective of the holidays would let mothers better align their paid time off with their children’s breaks.

There are several other approaches and combinations of approaches that would be effective in reducing the U.S. gender pay gap. One such is politics, which is currently at play in Canada, where a cabinet member is pregnant. It’ll be interesting to see how Canada decides to handle its first political pregnancy, and if they use policy change to address it. Other potential solutions are offering paternity leave, uprooting recruiting practices, or improving performance reviews and feedback. Education is merely one route to take in diminishing the U.S. gender pay gap. What is most important is that the causes of the disparity become more widely known, so that more action can be taken to help mitigate the already shrinking gender pay gap.


APPENDIX A

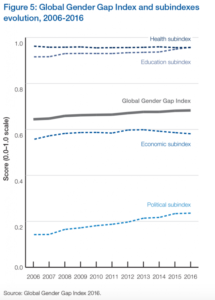
This graph, from the World Economic Forum, highlights the Global Gender Gap Index in contrast to its four subindexes, which determine its value. A Y-Axis value of zero equals inequality, and an X-Axis value of one equals equality. The Education Subindex is much higher than the Economic Subindex, as illustrated by the current environment in the United States—more women are in college than men, yet they are still earning less in their post-graduate careers. This difference indicates a need for a higher Economic Subindex to raise the Global Gender Gap Index.


As PASPA repeal begins, leagues gear up for the inevitable

After more than two decades, the Supreme Court has agreed to hear the repeal of the Professional and Amateur Sports Protection Act. PASPA, a federal law enacted in 1992, outlaws single-game sports wagering outside of Nevada. While opening arguments will commence in early December, a decision will likely not be reached until early 2018.

Still, this is the furthest that the argument for a modernized and regulated sports betting market has ever reached. A decision in favor of repealing the law, which the state of New Jersey has claimed is unconstitutional, can unlock a market worth several billion dollars.

Leagues have tried to distance themselves from gambling, however, as disruptions occur, gambling has become the newest medium for sports fans and even non-sports fans to enjoy the game.

Leagues now find themselves in unfamiliar territory and must adapt to the future while upholding the integrity of the game or be left behind. A regulated and legalized market across 50 states could prove to be the catalyst for major change and the loss or gain of billions of dollars.

Fortunately, while the Supreme Court gears up to hear opening arguments in this case, leagues across the world have begun to prepare for what is seen believed to be the inevitable. Through partnerships, changes in stances, and sponsorships, leagues have been preparing for quite some time.

PASPA was enacted to protect the sanctity of the game. Fears of point shaving and match fixing forced the public and Congress to accept a bill that would seemingly fix such problems. Prior to PASPA states such as Oregon and Delaware offered sports parlay cards through their state lottery. However, in the years since daily fantasy leagues have taken their place in American society, sports leagues have taken sponsorships from casinos, and most importantly have led way to an offshore illegal market worth $150 billion.

Take for example the popular NCAA March Madness tournament. The annual affair draws fans from across the United States to fill out tournament brackets in which they predict who will move on.

In recent years, more and more fans have turned towards wagering their picks online through various websites such as Bovada and BetUS. There can bet on individual teams, current matchups, future matchups, and the title game itself.

The American Gaming Association estimates that roughly 40 million people fill out 70 million brackets with the average bet per bracket hanging around $29. This year, the AGA estimated that Americans wagered $10.4 billion dollars on March Madness, but only 3 percent, or roughly $295 million, will have been done so legally through Nevada sportsbooks.

While the Supreme Court has agreed to hear the repeal of PASPA, it does not come on the heels of the unfounded fears against match fixing or the billions of dollars being pumped into organized crime, but rather if PASPA violated the 10th amendment and state sovereignty when it was enacted. Nonetheless, the result of this decision can lead way to ending such widespread problems.

SportRadar, a company that deals with sports data related to teams and players partnered with three of the four biggest leagues in the United States. The company provides real-time statistics for NFL, NBA, and NHL games and players. In addition to providing statistics used by broadcasters and bookies worldwide, SportRadar also monitors and reports on unusual betting trends. The company is also the parent company of BetRadar, a major player in the gambling industry.

Likewise, the MLB which represents the fourth biggest league in the United States, has a partnership with Genius Sports, which acts in the same manner as SportRadar. Its executives met with sportsbook operators in September to gain a better understanding of how the industry operates.

These partnerships with data companies provide a stark shift in stance compared to just one decade earlier, when representatives from the four major leagues filed a letter dismissing the idea of monitoring books and the data that make them up.

Apart from partnering with outside agencies, the NFL and NHL have both elected to move and create franchises in Las Vegas. The Oakland Raiders of the NFL are set to arrive in 2019, while the Las Vegas Golden Knights opened play this past month.

Attendees of Golden Knights home games will be able to readily bet within the confines of the T-Mobile Arena. The NHL had the opportunity to file a prohibition preventing sports betting from occurring as the game happens, however, elected not to.

The NFL in recent years has held games in London, where sports betting is regulated and legal. Outside of moving the Raiders to Las Vegas, the NFL has also eyed creating a franchise in London where it is set to play several games this season featuring marquee teams. Fans at these games are can bet on their phones and outside in the streets before, during, and after the game. The ability to gamble in-game without the result being compromised is a look at the potential for such a feature in the United States.

NBA commissioner Adam Silver wrote in 2014 in the New York Times, “Times have changed since PASPA was enacted,” Silver said in his piece. “I believe that sports betting should be brought out of the underground and into the sunlight where it can be appropriately monitored and regulated.”

Should PASPA be repealed, over a dozen states have already filed legislation this year that would permit wagering on sports in some way. The AGA estimates that a legal sports betting market would provide over 150,000 in jobs, a substantial estimate given that a large majority of gambling takes place online and not physically.

Steve Doty, director of media relations, says that the company is committed to moving past PASPA in favor of a legal and regulated market. “AGA is committed to overturning this failing federal ban on sports betting; once it is removed, AGA looks forward to leading the conversation in states across the country to educate local lawmakers on sports betting.

Company Eilers & Krejcik Gaming has taken a conservative approach to estimating the potential for a legal and regulated betting environment. They estimate in a base case that by 2023, if 32 states were to legalize sports betting in some form, the market will be worth approximately $6.03 billion in annual revenue.

If every state were to legalize gambling, including online wagering, the number expands to $16 billion, which comes from $245 billion taken in. While $245 billion is estimated to be taken in keep in mind that a large portion is often paid out.

All of this comes on the heels of a Washington Post poll published in September, which sees more than half of Americans supporting a legal and regulative sports betting environment. 55 percent approve of such an environment, which serves as a considerable shift from nearly 25 years ago, when PASPA was first enacted and 56 percent of Americans disproved of legalized sports gambling.

In the decades since PASPA was enacted the landscape of gambling and sports has grown closer and as with such more people are willing to accept it as a medium. While sports and the leagues that govern them did their best to distance themselves, they can’t help, but find themselves growing closer together. One factor to this close relationship is the rise of fantasy sports.

In 1988 before the dot com boom, Fantasy Sports Trade Association details that an estimated 500,000 players were engaged in weekly/daily fantasy sports.

Between 1991 and 1994 that number grew upwards to three million and now in 2017 has reached an all-time high of 59.3 million people.

Amongst leagues themselves people began to bet on individual games and between each other’s teams. This interest would lead way to companies such as DraftKings and FanDuel to sprout up and offer daily fantasy sports with the benefit of being able to bet and win money with people from across the United States.

The act of fantasy sports gambling is not inherently illegal even though it requires users to pick players from different teams and earn points based off their real-life performances.

Eventually more sophisticated gambling involving parlays and futures among other means would find its way into sports fans lives and lead way to the multi-billion-dollar industry aforementioned.

All of this begs the question: Why are leagues finally warming up to any of this? The answer is a lot simpler than most would imagine.

It’s no secret that television is a dying medium. The age of cord-cutting is fully underway and more and more people are cutting their cable bill down or outright eliminating it altogether. In some instances, people have turned their attention to online streaming services such as Hulu or Netflix and in other instances people have left television behind altogether.

This greatly impacts sports as a large majority of league revenue comes from various deals that allow channels such as ESPN and Fox the ability to broadcast games and utilize footage across their various platforms and shows.

Take for example ESPN and the NBA. In 2014, the NBA struck a deal with ESPN and Turner Sports for nine years, $24 billion, a 180 percent increase in money for the league.

With such a large deal it can be assumed that ESPN is drawing record viewers and must keep up with the demand, however, that cannot be further from the truth. Reuters reported that ESPN is losing viewers at an alarming rate. 88.4 million households carry ESPN as of December 2016. In February 2011 that number was well over 100 million.

Not only are more and more ditching cable, but their simply not tuning in. The NBA recently faced a problem in which marquee players such as Lebron James and Stephen Curry opted not to play in throwaway matchups in favor of rest, knowing full well that their teams would make it to the postseason.

While the league has done its best to limit that issue this upcoming season by working around the schedule to limit the number of back-to-back matchups, the problem remains. The Wednesday matchup that ESPN paid millions to bring to viewers between San Antonio and Golden State is now boring by default. Less viewers equals less advertisers and less advertising dollars puts companies like ESPN in the red and eventually force them to lay off staff to cope.

When the nine-year deal between the NBA and ESPN is up and the numbers are looked at, the NBA and ESPN will strike a much lower deal if any deal at all. The NBA will now be out of billions and will need to recuperate it in some way.

As with such leagues such as the NBA must pivot now more than ever to where fans are currently flowing and that is the world of gambling. Daily fantasy sports as well as gambling parlays and futures are currently dominating fans as the newest way to enjoy the games and make some money as well.

It’s highly self-contained and does not require participants to sit down and physically watch the game. In-fact many of these websites carry with them explainers on how to get involved as well as daily articles relaying information on why (X) team is expected to win over (Y) team and why player (A) is projected to hit a homerun against pitcher (B).

Utilizing factual statistics brought to participants by the various data companies outlined above is more logical than listening to hosts and commentators rant about the intangibles of the game such as why player (C) does not historically play well at sundown in Houston in October on a Tuesday. Suddenly, now even the shows on these networks become an even bigger afterthought then the games that drive the conversation.

Leagues are now in a way forced to move towards the future for fear of being left behind. At the same time, there is a lot to fear if you are a commissioner of any one of these leagues. Because the leagues themselves will not hold individualized betting websites sponsored by them, they must think of new ways to drive revenue.

The partnerships outlined above are one such example as are sponsorships such as DraftKings owning a restaurant within the Staples Center which is home to several professional sports teams.

However, partnerships and sponsorships alone are not nearly enough to make up the billions that will eventually be lost in television deals. In a potential future where television viewership is in the low millions and attendance continues to stagger, how can leagues and individual teams turn a profit.This is what makes the December opening arguments for PASPA interesting and most importantly, supremely significant for leagues.

https://www.huffingtonpost.com/entry/just-admit-the-nba-deal-is-screwing-you-espn_us_58d98250e4b0e6062d92300f

http://fsta.org/research/industry-demographics/

Poll: For first time, majority of Americans approve of legalizing sports betting – The Washington Post

Recent U.S. gambling legalization: A case study of lotteries – ScienceDirect

U.S. Sports Betting: A Sector On The Cusp Of Major Change | GamblingCompliance

Gambling – Where does sports betting legalization in the U.S. stand right now?

Sports Betting Ban Has ‘Perverse Effect,’ Says Casino Group – Poker News

NFL’s presence in UK shows how gambling can be done

March Madness Betting to Top $10 Billion | AGA


Crude Oil Prices – Contract to the Future!

Economies can rise or fall depending on the fluctuations of oil prices. Industries that are reliant on fuel costs can experience either a good or bad quarter due to these fluctuations. The volatility of oil prices always gets people thinking – “What is the price of oil going to be 6 months from now? Next year? In 2 years?” These are valid questions to consider while managing your budget at either a personal level, such as purchasing or leasing a car, or even while making important business decisions. Unfortunately, there are no analysts, experts, or commentators that will be able to decisively and accurately forecast the price of oil. However, it is certainly possible to make a well-educated guess about the short-term and long-term direction of oil prices by looking at future contracts.

According to The Options Guide, “Crude Oil futures are standardized, exchange-traded contracts in which the contract buyer agrees to take delivery, from the seller, a specific quantity of crude oil (eg. 1000 barrels) at a predetermined price on a future delivery date” (The Options Guide). In other words, a futures contract guarantees the buyer his or her commodity at the contract price, regardless of the market price at that specific date. These futures are traded in the New York Mercantile Exchange (or NYMEX) and the Intercontinental Exchange (ICE) where West Texas Intermediate (WTI) and North Sea Brent crude oil are traded respectively. Traders can buy or sell oil for delivery many months or years ahead. Historically, the majority of activity in commodity futures markets had been focused on oil for delivery in the next few months. However, in recent years, the activity has increased for more future deliveries as more investors had begun pouring money into it.

These future contracts evolved many years ago, with farmers being known as the pioneers of it all. Farmers, or sellers, and dealers, or buyers, would agree to a future exchange of grain for cash. For example, a farmer would agree to deliver 7,000 bushels of wheat to the dealer at the end of July for a set cost. This exchange would be beneficial for both the farmer and the dealer. The farmer would know how much wheat would be in demand so he would not come too short or have a surplus, as well as knowing how much he will be getting paid in advance. On the other hand, dealers were able to budget accordingly by knowing their costs in advance.

These contracts became very common and were even used as collateral for bank loans. But soon enough, the consequence we face with any contract arose; how do you back out if you are locked in? As a result, farmers and dealers began selling contracts before the delivery dates. For example, if the dealer still had a surplus of inventory as the new delivery date approached and he did not want to purchase the new wheat, he would sell the contract to someone who did. Or, if the farmer did not have the capability to produce and deliver the wheat, he would sell the contract and obligation to another farmer. This caused the prices of wheat to go up and down, depending on what was happening in the wheat market. Weather conditions would play a role in the pricing as well. If there was bad weather, the sellers of the wheat in the contract would hold more valuable contracts because the supply would be lower, and if weather conditions were ideal then the sellers’ contracts would become less valuable. Not everyone had a reason to buy and sell wheat, but saw this as a way to make money. It did not take long before people began to make side bets and trade these contracts, hoping to buy low and sell high, or sell high and buy low.

This concept, first developed by farmers, is mirrored in the oil industry today. Companies that have an interest in oil for their daily operations are known to participate in future exchanges, such as refineries or airline companies. Their intent is to reduce the risk of volatility in the price of oil, and are known as “hedgers.” Producers of crude oil can engage in a “short hedge,” which locks in a selling price for the oil they produce. This allows them to manage their operations to produce just the right amount to not experience a shortage or surplus. Also, similar to the farmers, it allows producers to know how much they will be getting paid in the future, which can impact key business and budget decisions. Businesses that require crude oil can participate in a “long hedge,” which will guarantee a purchase price for the commodity for a specific quantity at a specific date. Similar to the dealers involved with the wheat contracts, businesses that purchase oil will know exactly how much their oil costs will be in the future and can operate and budget accordingly.

So, if the wheat market attracted people to make side bets and trade contracts, shouldn’t the crude oil market do the same? The answer is yes. Crude oil futures are also traded by “speculators,” who make an assumption on the price risks that hedgers aim to avoid in efforts to gain a profit. In other words, crude oil futures allow you to make money of the fluctuations of the price per barrel, but are very different than buying oil or stocks of a gas company. The stock market involves trading investments in different publicly traded companies, and similarly, people also trade in commodities at financial markets. Speculators will purchase crude oil futures if they believe that the crude oil price will go up, and will sell the futures when they think the prices will fall.

Obviously, these investors have no desire to acquire the thousands of barrels of crude oil they are trading. Fortunately, participators in trading do not have to actually deal with physical deliveries if traded and finalized before the expiration date of the contracts. It is necessary to have a margin account with a broker and maintain a certain amount of equity in the account in case you experience a loss. According to Dan Caplinger, a writer and Director of Investment Planning for the Motley Fool, “For NYMEX crude oil futures, the current margin maintenance requirements range from $2,900 to $3,400 depending on the date of the contract” (The Motley Fool). If the losses result in a decrease of available capital below that level, more money must be deposited in order to keep the futures position.

Crude oil prices are important for investors in energy companies, even if the investor does not personally trade in futures. Energy companies that people invest in are likely to use futures for their own account. Knowing the mechanisms of how crude oil futures work gives you a better understanding of why the share prices of these companies are either going up or down as a reaction to the change in oil prices. For example, if a producer has sold a lot of futures that cover almost all if its future production, it should not experience that much of a reaction when oil prices change since it is already locked in. People that do not participate in futures markets will notice the volatility of oil prices as they increase or decrease and do not have the balance.

Crude oil futures play an essential role in how the energy industry operates. Future contracts will allow companies to manage their operations and potentially boost their profits by planning accordingly. However, futures markets can be very risky for investors to participate in. Understanding how futures work are not only important to companies and investors, but even average individual consumers that rely on different energy companies as their primary sources of energy. The price we pay at the pump is a reaction to how well the energy industry is doing.

Although these is no definite way to know which direction the price of oil will sway, it is possible to conduct an accurate forecast for both the short and long run. There is no hidden “secret” for how to predict the future price of oil. The balance of supply and demand causes the prices to fluctuate, but it is not the supply and demand for the actual oil. Instead, it is the supply and demand of the investment. The increase or decrease in demand in relation to the supply of investment will ultimately determine the price of oil. This is all apparent in the oil futures market where futures are traded. Investors will make a prediction, derived from different economic predictions, on whether to purchase futures that will reflect them, causing prices to go either up or down. Studying how much these future contracts are that are being traded for in the short run and in the long run will allow you to make a well-educated guess on what direction oil prices will be going.


https://www.fool.com/investing/2016/07/12/what-are-crude-oil-futures-and-how-do-they-work.aspx

http://www.theoptionsguide.com/crude-oil-futures.aspx

https://science.howstuffworks.com/environmental/energy/crude-oil-market3.htm

A History of Futures Trading in the United States

http://www.nasdaq.com/markets/crude-oil.aspx

“Struck Oil!” Oil Prices Are on the Rise, But How Long Will the Sunup Last?

Oil markets are positioned for yet another wild ride. With academic and Wall Street analysts predicting prices of anywhere ranging from $40 to $70 per barrel by the end of the year, oil is looking far more handsome to investors. Over the last two and a half years, the industry experienced its deepest downtown since the 1990s. When using the past as a guide, after every oil bust comes a significant recovery, if not a market boom. With much volatility surrounding pricing numbers alone, analysts and the public seem to only focus on the cost of the everyday essential commodity. This almost myopic focus leaves one resounding question unanswered: what is the future of oil demand?


According to the World Petroleum Council, Oil is one of the most important raw materials humans have access to on this planet. Every day, hundreds of goods and services are used that are either sourced from or contingent upon oil and gas. Thus, it comes as no surprise that oil and gas are also important due to the large number of jobs they provide. According to Economics Online, in 2016, the United States produced an average of approximately 8.9 million barrels of crude oil per day, which means about $3.9 million a day for U.S. citizens.  A total of 7.21 billion barrels of petroleum products were consumed that same year, reflecting significant demand for the resource.


One of the most basic, yet most important economic principles is the law of demand. This edict states that, if all alternative factors remain equal, the higher the price of a good, the less the demand for that good will be. Essentially, the higher the price, the lower the quantity demanded. With demand increasing in the advanced OECD (Organization for Economic Cooperation and Development) economies, which comprise approximately 66 percent of total global demand, one could consider the implications of the recent upturn in oil market prices. Between 1980 and 2008, world oil demand increased by 40 percent, from 60 million barrels per day to over 85 million barrels, Forbes reported.


According to the Industry Tends section of PwC’s Strategy&, recent oil price cans can be attributed to a rebalancing of supply and demand fundamentals, which were accelerated by the Organization of Petroleum Exporting Countries’ (OPEC) recent decision to cut production. Wall Street and academic analysts vocalized confidence that these price gains are expected to remain in place. According to Barclay’s latest E&P Spending Survey, oil and gas industry capital expenditures are anticipated to increase by up to seven percent by the end of 2017. Additionally, global rig counts, particularly in the United States, have been quickly on the rise since the middle of 2016, stated Baker Hughes, one of the world’s largest oil field service companies.


Yet, when delving deeper in the background surrounding demand for oil, it is evident that the demand for the resource has historically been relatively inelastic with respect to price in, given that oil has very few direct substitutes. Contrastingly, however, an obvious problem when predicting the effects of oil-price movements is that the decrease in global price could result from either an increase in global supply or decrease in global demand.


It is important to note that with a significant portion of the global economy flowing through oil, if the demand were to shift, the world power balance would follow suit. While a great deal of activity in the oil and gas sector is focused on OPEC countries and the U.S., other regions will likely play key roles in the coming years. To illustrate, the investment environment in Latin America is rapidly improving. Some domestic oil and gas industries are on an upswing, stimulating and creating jobs.


An excellent example of this is Mexico, where energy reform is currently opening the door for more nontraditional oil and gas operators to establish a presence in the country. Companies successfully bidding for acreage in the recent Deepwater auction in that country include China’s Offshore Oil Corporation, France’s Total, Australia’s BHP Billiton, Japan’s Index, and American firms Chevron and ExxonMobil, cited PwC. The geographical variation of the countries vying to get involved show just how significant oil is to the global economy.


Several countries’ economies are regarded as petroleum economies based on oil, meaning the majority of their economic success is contingent upon the success of oil. Unlike other countries, which largely finance their governments through taxation, petro-states rely on their oil and gas revenues. To provide an idea of which economies rely most heavily on oil as an export, the World Bank released data showing oil revenue as a share of each countries’ GDP. Saudi Arabia ranked third, after Libya and Kuwait, with roughly 45 percent of its GDP dependent upon oil. In terms of government income, Russia obtains about 50 percent through oil and gas, Nigeria receives a more impressive 60 percent, and Saudi Arabia weighs in at a whopping 90 percent.


Countries where fuel accounts for more than 90 percent of total exports include Venezuela, Libya, Sudan, Kuwait, Iraq, Bruni Darussalam, Algeria and Azerbaijan. Therefore, if a demand shift were to occur driving down oil prices, the petroleum-reliant economies would suffer. Additionally, if oil demand were to decrease, the countries that currently import oil would be forced to reallocate money locally. This would benefit individual country economies, but damage the global economy and international trade.


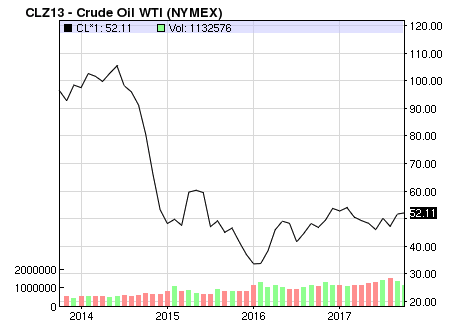
Prior to 2014, when oil was selling at approximately $100 per barrel or above, petro-state countries were able to finance lavish government projects and social welfare operations, securing widespread popular support. With oil prices dancing around a $50 per barrel value, petro-state countries find themselves curbing public spending and forced to fend off rising domestic unhappiness and even incipient revolts.


At the peak of their glory, the petro-states played a colossal role in world affairs. I 2013, members of OPEC earned an estimated $821 billion from oil exports alone. With the corresponding influx of capital, these countries were able to exercise influence over other countries through a wide variety of aid and patronage operations. For example, The Nation discussed how Venezuela sought to counter U.S. influence in Latin America through its Bolivarian Alliance for the Peoples of Our America, which is a cooperative network of mostly left-leaning governments. Additionally, Saudi Arabia spread its influence throughout the Islamic world by financing efforts of its ultra-conservative Wahhabi clergy to establish madrassas, or religious academies. Under the leadership of Vladimir Putin, Russia used prodigious oil wealth to rebuild and refurbish its military which had largely deteriorated following the collapse of the soviet union.


That influential dominance was then, of course, and this is now. While the power of these countries still matter, what currently worries their presidents and prime ministers is the increasing likelihood of civil violence or state collapse. According the The Nation, internal strife and civil disorder are likely in oil-producing states like Algeria and Nigeria, where the potential for growth in terrorist violence during times of chaos is always high.


Now that the past and present of oil demand has been established, it is important to consider what is driving the change. Petroleum is used primarily for transportation and has held more than 90 percent of the transportation market for the past 60 years. According to Forbes, to this date, there have been no scalable economic competitors in the transportation space.


During the second half of the last decade, however, biofuels made a competitive push in the U.S. as the Renewable Fuel Standard (RFS) mandated increased ethanol in the gasoline supply. This resulted in a one million barrel per day (bpd) global increase in biofuel consumption, which was a scarce drop in the bucket compared to the nearly seven million barrel a day increase in crude oil consumption during that same timeframe. Therefore, despite numerous claims that biofuels would essentially “kill” the crude oil industry, the demand growth for crude oil has been resoundingly consisted, rising by an average of one million bpd for over 30 years.


In February of 2016, Bloomberg published an article on electric vehicles (EVs) that made many similar arguments to the biofuel proponents that were being exercised over the last decade. The article, titled, “Another Oil Crash Is Coming, and There May Be No Recovery,” urged oil investors to “start taking electric cars seriously.” One side of the electric car argument is to encourage individuals to buy electric and reduce their overall environmental footprint. The devil’s advocate may argue that encouraging more people to purchase electric cars may drive them away from public transportation, like buses and trains, and may ironically aggravate environmental problems and cause traffic jams.


Yet, what would happen if public transportation too moved into the electronic sector? Demand for oil would plummet if the major “gas guzzlers” that enable efficient public transportation relied solely on electricity to run, which would throw off the entire oil-market dominance in the global economy. With areas like China, India, European Countries and even the state of California implementing policy changes to move away from gas-run transportation, this shift may be a more realistic reality than many analysts anticipate.


So, where will demand for crude oil go? There are a number of determining factors waiting in the wings, ready for their big moment. Only time will tell which factor will outperform them all.


Works Cited

Biscardini, Giorgio. “2017 Oil and Gas Trends.” Strategy&, PwC, www.strategyand.pwc.com/trend/2017-oil-and-gas-trends.


Heakal, Reem. “What Is International Trade?” Investopedia, Investopedia, 19 Apr. 2017, www.investopedia.com/articles/03/112503.asp.


Hayes, CFA Adam. “Economics Basics: Supply and Demand.”Investopedia, Investopedia, 20 Apr. 2017, www.investopedia.com/university/economics/economics3.asp.


Hutt, Rosamund. “Which Economies Are Most Heavily Reliant on Oil?”World Economic Forum, www.weforum.org/agenda/2016/05/which-economies-are-most-reliant-on-oil/.


Klare, Michael T. “As the Oil Industry Collapses, What Will Happen to the Countries That Depend On It?” The Nation, 22 June 2016, www.thenation.com/article/as-the-oil-industry-collapses-what-will-happen-to-the-countries-that-depend-on-it/.


“Oil Prices and the Global Economy: It’s Complicated.” IMF Blog, 14 Apr. 2017, blogs.imf.org/2016/03/24/oil-prices-and-the-global-economy-its-complicated/.


Randall, Tom. “Another Oil Crash Is Coming, and There May Be No Recovery.” Bloomberg.com, Bloomberg, 24 Feb. 2016, www.bloomberg.com/news/articles/2016-02-24/another-oil-crash-is-coming-and-there-may-be-no-recovery.


Rapier, Robert. “Is The Electric Vehicle A Crude Oil Killer?” Forbes, Forbes Magazine, 25 Feb. 2016, www.forbes.com/sites/rrapier/2016/02/25/is-the-electric-vehicle-a-crude-oil-killer/2/#ece4db819f90.


Rapier, Robert. “Peak Oil Demand Is Millions Of Barrels Away.” Forbes, Forbes Magazine, 19 June 2017, www.forbes.com/sites/rrapier/2017/06/19/peak-oil-demand-is-millions-of-barrels-away/#36d8fe876940.


“The Oil Market.” Economics Online, Economics Online, www.economicsonline.co.uk/Competitive_markets/The_market_for_oil.html.


“U.S. Energy Information Administration – EIA – Independent Statistics and Analysis.” How Much Oil Is Consumed in the United States? – FAQ – U.S. Energy Information Administration (EIA), EIA, www.eia.gov/tools/faqs/faq.php?id=33&t=6.


“Why Are Oil and Gas Important?” Why Are Oil and Gas Important?, World Petroleum Council , www.world-petroleum.org/edu/221-why-are-oil-and-gas-important.


California’s market-based response to climate change tries to avoid the problems with markets

A layer of smog rests over the Los Angeles Basin in Sept. 2007. (Flickr user vlasta2, CC BY-NC-ND 2.0)

When California Gov. Jerry Brown signed major climate legislation in June, he returned to the spot where his predecessor, Arnold Schwarzenegger, signed his own climate law more than ten years earlier: Treasure Island.

It was an apt location. The artificial island in the San Francisco Bay was created in the 1930s to showcase California’s grandeur for the World’s Fair. Likewise, these climate bills are intended largely to demonstrate to the world that California is leading on climate change.

Schwarzenegger signed Assembly Bill 32 into law in 2006, setting the stage for the creation of California’s cap-and-trade program. A concept that’s been around for only a few decades, cap-and-trade aims to create financial incentives for polluters to adopt more eco-friendly technologies and reduce their greenhouse gas emissions. Brown extended the program to 2030 on Treasure Island and created more ambitious targets.

The state’s goal is to reach 1990 levels of greenhouse gas emissions by 2020, despite a projected population increase of nearly 37 percent over 1990. In 2017, that goal was toughened to reach 40 percent below 1990 levels by 2030.

But so far, it’s been hard to measure the cap-and-trade program’s success, and market-based approaches to the environment can have many of the same flaws and failures found in other kinds of markets. The state’s efforts to address these flaws led to redundant “complementary” policies, meaning that the centerpiece of California’s climate policy actually only plays a small part in its emissions reductions.

A modern cap-and-trade system is designed to reduce greenhouse gas emissions through a flexible market rather than one-size-fits-all regulation. By putting a price on greenhouse gases and creating a market to trade them, the system creates economic incentives for firms to reduce their emissions in the way that’s most cost-effective. To reach the state’s 2020 goal, emissions will need to be about 15 percent below a “business as usual” scenario.

The California Air Resources Board keeps track of the state’s greenhouse gas emissions. This chart from CARB’s 2017 Scoping Plan shows emissions from 2000 to 2014.

To illustrate how this works in practice, let’s imagine you run a natural gas power plant and you produce 100 tons of CO2-equivalent in a year (in reality, this figure would be much higher). Knowing that you emit 100 tons, the California Air Resources Board would issue you 100 carbon credits. You’d get most of them for free, but a few would need to be purchased on the market, either from the state or from other polluters. The idea is that you would save money by taking steps to reduce your emissions rather than purchasing credits, and then if you use fewer than what you’re given for free, you can sell the rest and make a profit. The total number of credits given by the state decreases every year to encourage emissions reductions.

California’s cap-and-trade system began on Jan. 1, 2013, with large power plants and industrial facilities. It was expanded to fuel distributors in 2015, meaning that cap-and-trade now affects about 85 percent of greenhouse gas emissions in the state. Some major companies in the state, like electric utility Pacific Gas and Electric, which serves nearly two-thirds of California’s geographic area, have said they support the program as the best way to address climate change.

In the United States, California has the most extensive cap-and-trade system, which affects all companies emitting more than 25,000 tons of CO2-equivalent in a year. By 2018, its market will be linked to both the Quebec and Ontario emissions markets (more on this later). There’s also a regional cap-and-trade system for electric utilities in New England, and there have been others in the past, such as one created in the 1990s to reduce acid rain-causing emissions. But no nationwide emissions trading system exists today in the U.S. The last big effort to create one, the Waxman–Markey bill in 2009, passed in the House but fell through in the Senate after facing opposition from senators from coal-reliant states.

So far, emissions auctions in California have raised nearly $5 billion for the state, according to the state Legislative Analyst’s Office. State law requires this money to be spent on projects that further reduce greenhouse gas emissions. More than $1.3 billion has been spent on the state’s high-speed rail project, and nearly $700 million each has been spent on low carbon vehicle incentives and affordable housing programs.

Critics of cap-and-trade policy say it’s burdensome for businesses and have pointed to high-profile companies like Toyota moving their operations out of California. But USC environmental economist Kate Svyatets said the state has been successful in balancing competing interests: economic freedom and environmental protection.

“A lot of businesses, instead of being overburdened, they make money,” Svyatets said. “It’s possible to have both a cleaner environment and economic growth, and California shows how to achieve it.”

For most economists, cap-and-trade is the “preferred solution” for regulating greenhouse gas emissions, UCLA researcher Ann E. Carlson wrote in the Harvard Journal on Legislation. Other methods of emissions control, like a carbon tax or mitigation rules, require direct government enforcement and are not as economically efficient as a market system can be — they impose a price on carbon on the state rather than letting one emerge through economic activity.

“It’s hard for the government to decide exactly how many carbon credits to allow,” Svyatets said. “The carbon experts say it’s not expensive enough yet. It’s still better than nothing, but it’s not expensive enough for some companies to switch to clean technology.”

But though California’s cap-and-trade system is designed to create price incentives to reduce emissions, it has not been very instrumental in doing so. The emissions cap each year has been higher than actual emissions in the state, meaning that the emissions trading system does not have the chance to seriously affect how polluters behave. Prices on the emissions market also fell precipitously in 2016 as a court case made the program’s future uncertain. They’ve since rebounded but remain near the state-mandated price floor.

When emission credits don’t cost enough, it becomes cheaper for firms to pollute than to invest in methods that would reduce their emissions in the long term. The European Union is an example of this. It started its cap-and-trade system in 2005, but the European Commission allowed too many credits in the market. Prices fell to ineffective levels by 2008, and companies were profiting off the EU’s mistake by selling the extra credits.

As in California, the prices have since stabilized. At the time of writing, the allowance to emit a ton of greenhouse gases costs roughly $7 in the EU, compared to $13 on California’s market. The 2017 price floor in California is $13.57.

This chart from the European Commission of the European Union shows how the EU’s greenhouse gas emissions have changed since 1990. The data are shown as an index, with 100 being the 1990 level.

Carlson said that when emissions trading systems don’t work, “policymakers may need to enact complementary policies to address those market failures.” California has supplemental requirements like the Renewable Portfolio Standard, which requires an increasing portion of electricity sold in the state to come from renewable and emissions-free sources, and the Low Carbon Fuel Standard, which requires gasoline and diesel fuels to be less “carbon-intensive.”

These policies are perhaps the greatest limit to cap-and-trade’s effectiveness. The complementary policies are responsible for about 80 percent of emissions reductions, with cap-and-trade in place to “sweep up remaining cuts,” according to MIT researchers’ interviews with California officials.

All three policies were created together in what the researchers have called an “insurance” policy to “create a mechanism that could make up emission reduction efforts that were lost if any of the major complementary policies were to fail.” In a way, this means that cap-and-trade in California is intended to be largely a backup plan in case the state’s other policies are not enough. This limits the role that the market has and therefore the incentive for polluters to reduce emissions in the most cost-effective way.

One common issue in many markets is a lack of competition or the monopolization of resources, but despite some speculative activities in emissions trading, anti-competitive behavior hasn’t been a problem in large markets like the European Union or California. German researchers found that those kinds of issues only arise in small trading pools, such as the RECLAIM market for nitrous oxide and sulfur oxide emissions in Southern California.

“Firms within the same industry do not want to sell allowances to buyers with whom they [otherwise] compete,” the researchers wrote. But in large cap-and-trade systems with diverse stakeholders, this has not been a problem.

To make emissions trading systems even more competitive, governments have sought to link their markets with others, allowing credits to be sold across them. More buyers and sellers of emissions means more competition and less room for market abuse.

“If you have a very small market, what if nobody wants to buy your allowances? Just imagine you want to sell a used car or your cell phone or something,” Svyatets said. “If it’s just you and I in this market and nobody else, what if I don’t want your cell phone? What if I don’t want your car?”

But linkages introduce a problem seen in other cases of cross-jurisdictional common markets, like the European Union. When the Greek debt crisis struck that country in 2008, leaders at the European Central Bank found their hands tied when it came to monetary policy to relieve the nation’s ensuing recession. According to UCLA researcher Juliet Howland, linked emissions trading systems could face a similar problem in which one government “may not be able to regulate the price of carbon credits in order to prevent serious damage to [its] economy.” The MIT researchers found through their interviews that California’s system was intended to be flexible for linkages with other western states (which later abandoned their cap-and-trade ambitions), but were concerned that it could be hurt by linkages to weaker cap-and-trade markets.

Linked emissions systems don’t even have to be geographically close — California’s market is linked to the province of Quebec and soon to Ontario, while the European Union has started the process of linking its system to Australia’s. The thought is that in tackling a global problem, it doesn’t matter where greenhouse gas emission reductions happen as long as they happen somewhere.

But California has taken steps to ensure local benefits for its cap-and-trade program. Twenty-five percent of funds are automatically earmarked for high-speed rail, plus 20 percent go to affordable housing and 10 percent to transit systems. All revenues from the sales of emission credits on auction go toward programs that the state says promote public health, and by law, one-quarter of revenues must benefit “the state’s most disadvantaged and burdened communities.”

Those communities, it turns out, are some of the most affected by climate change.

California’s cap-and-trade system aims to reverse course on greenhouse gas emissions to help protect all communities from the harmful effects of global climate change. But despite its large potential impact, the program in practice is only secondary to the state’s more heavy-handed regulations.

This chart from the California Air Resources Board’s 2017 Scoping Plan shows that potential statewide greenhouse gas emissions reductions under the continuation of planned policies would exceed those required under the governor’s executive orders.

That could change. The California Legislative Analyst’s Office found in 2017 that the state was on track to meet its 2020 emissions goal, but the 2030 target is much more ambitious and will require much more severe greenhouse gas reductions.

The cap-and-trade program will likely become more essential over time as the cap becomes increasingly tighter, but this will increase the burden on polluters too and potentially increase costs for consumers. The analysts estimated that some policies needed to reach the 2030 target could cost $300 per ton of carbon dioxide equivalent — or more than 20 times the current price for one allowance on the cap-and-trade market.

Who will be hit hardest by the cost of these reductions remains to be seen, and the impact on the economy is unclear. The analysts said long-term carbon prices depend on factors that are “highly uncertain,” and the state Department of Finance does not provide economic growth projections past 2020.

For now, the California Air Resources Board is working on a plan to reach its 2030 emissions goals. What comes out of those meetings will determine the future of California’s climate policy.