Increased Auto Repair Service Sales Could Indicate Recession

It is often said that the decisions of one impact the lives of many. Decisions on what to spend money on and when to spend accumulate into a collective force that dictates the growth or decay of the economy. This means that, behaviorally, the confidence the individual has in the continuation of their income will dictate whether or not they decide to spend money at that point in time in the first place. 

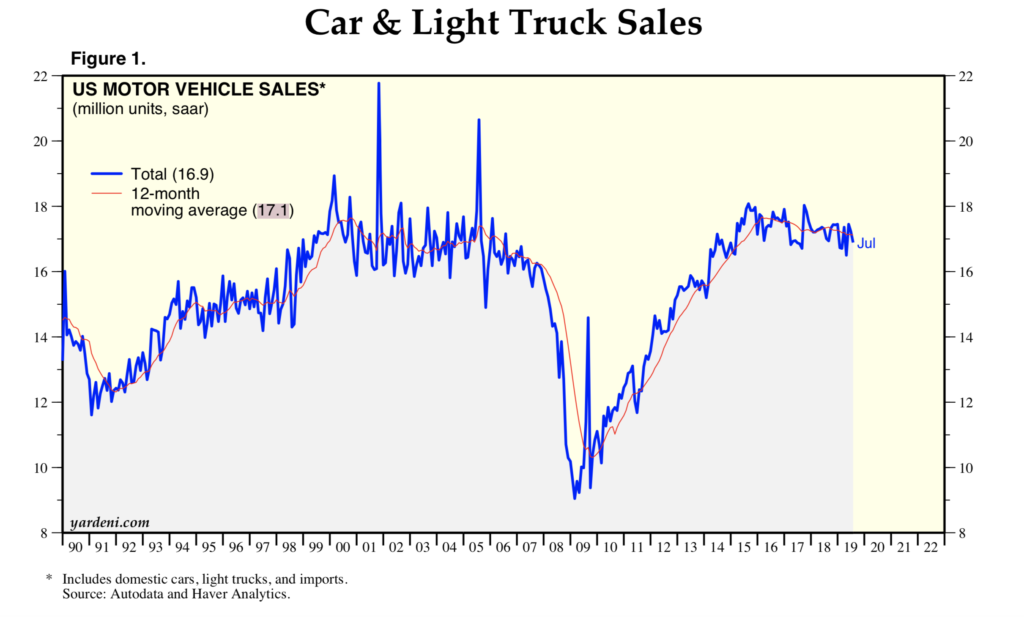
Large investments such as cars and property have been used as a means of measuring the confidence of that consumers have on their economic future. Because of the size of the cost, money is often borrowed for such purchases and these goods are often used as equity for other loans. When the economy is doing well, people are more inclined to purchase homes and cars (both old and new) with the assurance that they will be able to pay off the debt of their mortgage or car loan. On the flip side, during a recession, sales tend to slow as consumers become more reluctant to make such risky purchases due to the chances of defaulting and high interest rates. Overall, consumers tend to withhold their spending in most markets when their confidence in the growth of the economy, and their spending money, is low. 

Motor vehicle sales are often used as an indicator of economic health. During the Great Recession, auto sales dropped significantly. Source: Yardeni Research Inc.

While it is often thought that all business tends to slow during a recession, there is one particular enterprise that actually benefits from an economic downturn: auto repair shops. 

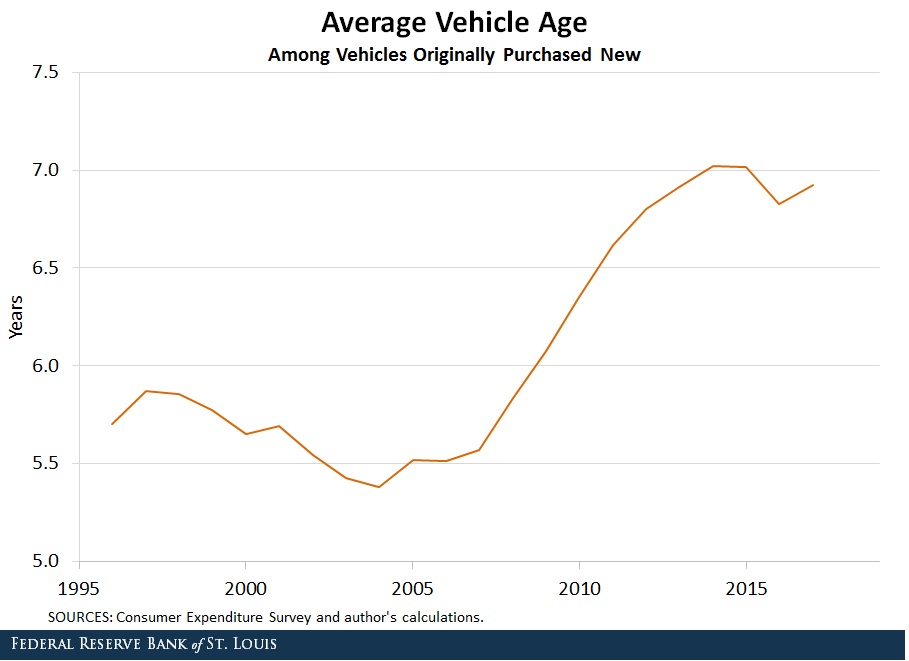
The heavy investment in vehicles makes commodities like cars precious. They endure regular wear and tear or collision damage, which inevitably leads to the end of the car’s use. Historically, car owners were more willing to trade their car in for a new model after every two years to avoid dealing with repair bills while enjoying the upgrades in fuel efficiency and better manufacturing. 

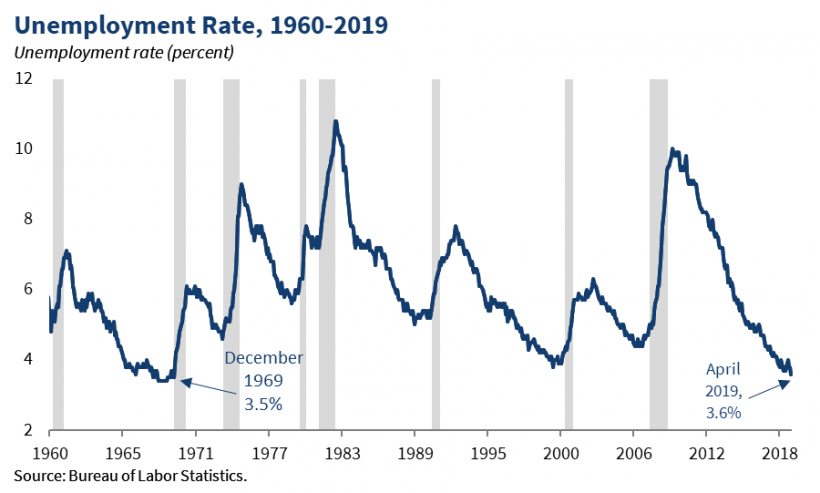
During the Great Recession in 2007-2008, people divorced themselves from that habit to save money. As cars aged and began to break down, car owners had to invest in auto servicing, increasing auto repair sales by 10.5% from 2007 to 2011.

Between the Great Recession and the eventual recovery of the economy in 2015, car owners refrained from buying new cars, resulting in an increase in the average age of cars that were not purchased in a “used” condition.

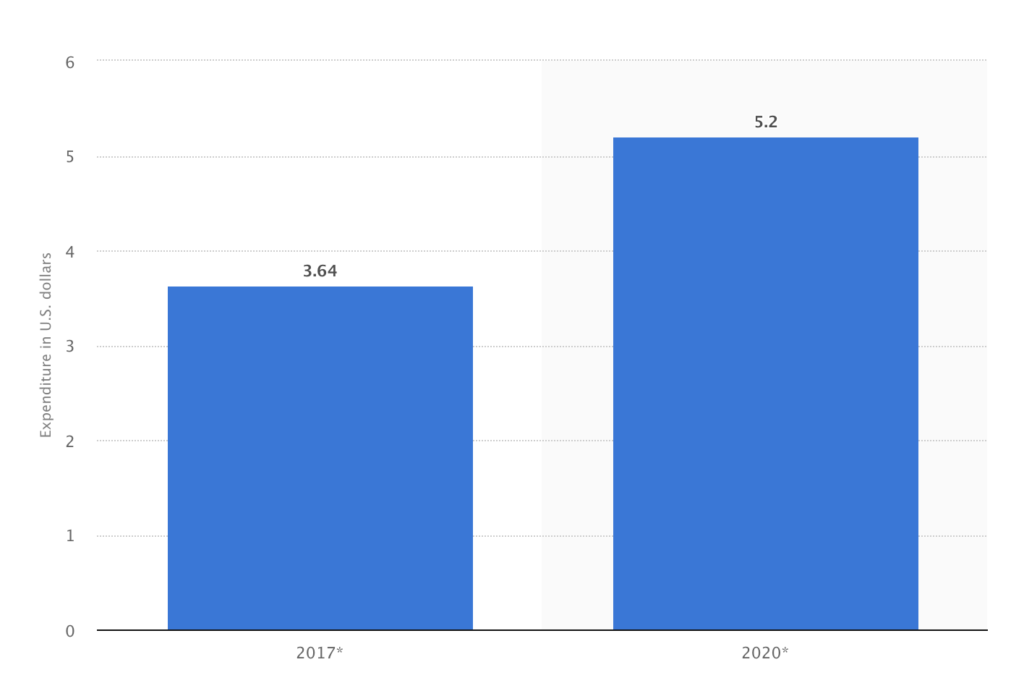
As with all indicators, there are a few factors to consider when analyzing the economy through auto repair sales. For one, it is important to note the rising cost of both cars and car parts due to new automotive technology such as self-driving and improved collision safety engineering, which can factor into the overall increase in consumer expenditure in that market. US-based insurers Travelers reports that the cost of repairing a 2018 sedan is up to three times higher than a 2017 model. These increased costs are projected to be an investment in driving safety, which could ultimately be offset by reduced frequency and intensity of vehicle accidents in the future, which means less-frequent spending on auto repairs. 

On the 125th Labor Day, unemployment rate helps indicate a robust American economy

Summer of 1894 marked the first official celebration of Labor Day in the United States; President Grover Cleveland signed a bill creating a national holiday across the country when reconciliation with the labor movement became a top political priority.  

Illustration of the first Labor Day in New York City.

Since the original Labor Day, the U.S. labor market has been affected by economic upturns and downturns, governmental policies, changes in cultural values, and countless other factors. One significant statistic from the labor market, the unemployment rate, gives the percentage of unemployed workers in the total labor force. The rate reveals how many people are out of work or seeking a job, which affects the American economy as a whole. When one becomes unemployed, an individual or family loses its wages. In turn, the national economy loses the consumption of goods and services that the individual or family would be spending with earned wages. The purchasing power of the unemployed consumer declines and eventually puts other workers out of a job. The fact that unemployment affects purchasing power makes it an economic indicator: a means to gauge future trends in the economy. A low unemployment rate indicates a strong economy usually tied with high consumer spending; a high unemployment rate usually occurs during a time of economic downtown and causes low consumer spending.

During the year of the first Labor Day, the unemployment rate was 7.73%. The Panic of 1893 has just occurred due to international crop failures and other shocks that weakened the economy. Four million people were unemployed during what became a major depression in the business cycle. The unemployment rate confirmed the pattern of economic downtown in several sectors of the economy at the time.

Last month, July numbers showed a present-day unemployment rate of 3.7%, one-tenth of a point up from the record low rate of 3.6% reported in April. The rate has not hit that low of a percentage since December of 1969, indicating a robust labor market in the current U.S. economy. Consumer spending is high, building good business, and in turn, generating more jobs.

The unemployment rate, a trailing indicator, confirms the growth that the American economy is experiencing in the present day. Workers earning wages stimulate economic growth with spending.

The unemployment rate rose one-tenth of a percent between the first and second quarter of 2019. However, the small fraction of growth is not alarming on a month to month basis. If the unemployment rate were to rise 0.5% over a short period of time, there may be reason to worry about economic downturn.

125 years after the first official Labor Day and Panic of 1893, the U.S. sees a robust economy confirmed by a low unemployment rate. Although other indicators such as an inverted yield curve and slowing global growth may suggest an imminent recession, the unemployment rate confirms economic growth and stability in the present day.

Sources:

https://www.investopedia.com/news/history-labor-day/
https://ig.ft.com/sites/numbers/economies/us/
https://www.forbes.com/sites/simonmoore/2019/08/20/what-key-recession-indicators-are-telling-us-today/#6ee71bd12156

What does the bombing growth of eSports tell us

ESports, standing for “electronic sports,” are a form of online competition using video games. The first eSports competition was held at Stanford University in 1972, when players were invited to compete in a game called Spacewar. Since then, eSports industry has developed together with the surge of internet access and video game technologies. However, it has not become full-fledged until recent years. 

Visitors cheer for international teams during the tournament of the computer game ‘League of Legends’ on May 8, 2014 in Paris.
Lionel Bonaventure | AFP | Getty Images

The explosive growth of eSports shows that people (especially youth) are adjusting their ways of daily interaction and socialization in the fast-paced world of constant techonological breakthroughs. eSports is going to be the first global sport, predicted by many experts. 

In 2018, eSports market revenue worldwide was 865 million dollars. Experiencing “phenomenal” year-over-year growth, the revenue is expected to double in 2022, reaching 1.79 billion dollars.

eSports market revenue worldwide from 2012 to 2022 (in million U.S. dollars)

2019 is a landmark for eSports as the market surpasses 1 billion for the first timeAccording to Newzoo, eSports revenues will reach an impressive $1.1 billion in 2019, a year-on-year growth of +26.7%. 

Sponsorship is currently the main source of eSports revenue, generating $456.7 million in 2019. But media rights remain the fastest-growing segment, increasing by 81.5% in 2017.

eSports market revenue worldwide in 2019, by segment (in million U.S. dollars)

“When I look at 2018, I feel like it was the year that eSports really started cracking into the mainstream,” Jack Etienne, owner of North American eSports team Cloud9, told CNBC.

While the booming growth of eSports indicts infinite business opportunities across industries, retailers – who are experts on capitalizing opportunities – are eyeing on the gold mine eSports bring in. 

Of course, game retailers can look towards pushing higher-quality hardware as models with more features are being brought to market. But they are also making profit by manufacturing and adding production – such as physical stores.

https://digiday.com/marketing/game-digital-looking-esports-turn-around-retail-sales/

Game Digital, a British video game company nearly bankrupted in 2012, launched physical stores called “Belong”, where gamers can pay to play together, participate in fan events and test new technologies like VR. 

With the rising of eSports, Game Digital seeks for its future not by just selling games but also by creating a mutual space for gaming, which shares the same idea of eSport competitions. In 2017, for the 12 weeks that ended on mid-March, physical game sales grew 0.5 percent in the U.K., according to Kantar Worldpanel.

Meanwhile, some retailers are dealing with a unique group of audiences – teenagers, also called Gen Zers.

Tilly’s, a Southern California-based accessories retailer focused on teenage customers, started a partnership with the High School Esports League (HSEL) and invited students across the country to win prizes by competing in augmented reality (AR) mobile game. The contest adds to the gross of revenue of Tilly’s physical stores. 

Another trending and lucrative direction for eSports giants is holding world championship events. The 2018 “League of Legends” World Finals had early 100 million viewers – more than the Super Bowl viewers. World Championship like this creates a perfect ecosystem for brands to get involved. As mentioned, over a third of $1 billion industry revenue stream comes from sponsorships, which have been a big driver for “League of Legends” franchise. The publisher announced Mastercard as a global sponsor last year, and the Chinese branch of “League of Legends” signed a partnership deal with Nike months ago.

A child plays Chinese version of ‘League of Legends’, which has 295 million downloads and earned 4.5 billion to date. (Photo by VCG/VCG via Getty Images)

On the consumer’s side, annual spending on eSports-related accessories increased 33 percent from 2017 to 2018, to a record $4.5 billion. The 2018 Entertainment Software Association report found that 64 percent of households own a video game device and 60 percent play video games every day.

Statista shows that the estimated average per capita spending on eSports will increase by two-fifths from 2017 to 2020.

Estimated average per capita spending on eSports related content worldwide in 2017 and 2020 (in U.S. dollars)

Both the industrial production(manufacturing) and consumer spending are swelling, indicating a big upsurge in eSports’ demand and supply. In fact, there is hardly any economic indicator shows the declining trend of Esports. With more and more eyes locked on this industry and more event held (i.e. The eSports Business summit to this month), this is definitely a golden era for eSports – with challenges ahead.

Sources:

  1. Desjardins, Jeff. “The Business of ESports.” Visual Capitalist, 29 May 2018, https://www.visualcapitalist.com/business-of-esports/.
  2. Goslin, Austen. “The 2018 League of Legends World Finals Had Nearly 100 Million Viewers.” The Rift Herald, The Rift Herald, 11 Dec. 2018, https://www.riftherald.com/2018/12/11/18136237/riot-2018-league-of-legends-world-finals-viewers-prize-pool.
  3. Gough, Christina. “Global ESports Market Revenue 2022.” Statista, https://www.statista.com/statistics/490522/global-esports-market-revenue/.
  4. Gough, Christina. “Global Consumer Spend on ESports 2020.” Statista, https://www.statista.com/statistics/691794/consumer-esports-spend/.
  5. Joseph, Seb. “Game Digital Is Looking to Esports to Turn around Retail Sales.” Digiday, 29 Aug. 2017, https://digiday.com/marketing/game-digital-looking-esports-turn-around-retail-sales/.
  6. Pannekeet, Jurre. “Global Esports Economy Will Top $1 Billion for the First Time in 2019.” Newzoo, https://newzoo.com/insights/articles/newzoo-global-esports-economy-will-top-1-billion-for-the-first-time-in-2019/.
  7. Pei, Annie. “Here’s Why Esports Can Become a Billion-Dollar Industry in 2019.” CNBC, CNBC, 23 Jan. 2019, https://www.cnbc.com/2019/01/20/heres-why-esports-can-become-a-billion-dollar-industry-in-2019.html.

Brexit: Why we’re still stressing out about it

(Courtesy: Pixabay)

Some background

Brexit is coming – and if Game of Thrones was still “in” right now, I would make a cheesy, poorly thought out “Winter is coming” joke. However, perhaps there is more in common with Brexit and the hit fantasy series, whose anticipated final season drummed up more controversy than acclaim, than meets the eye. 

Like Game of Thrones’s final season, Brexit – referring to the United Kingdom’s decision to leave the European Union, a political and economic coalition – has been a long-time coming, stressful, messy, controversial and disillusioning. Ever since the 2016 referendum where Brexiters narrowly between the “Bremain” crowd 52% to 46%, the United Kingdom has not actually managed to leave the United Kingdom, delaying their departure date twice due to an inability to strike and approve a satisfactory deal with the European Union. 

The United Kingdom is currently salted to leave the EU on Oct. 31, 2019. There is still no departure deal. Britain’s current prime minister, Boris Johnson – a controversial figure who has drawn comparisons to Trump for his hair and speech patterns – has stated that, if it comes down to it, the UK will leave the EU on Halloween without a deal

With the battle for Brexit getting more heated and members of Johnson’s own party rebelling against him and working with the opposition to draft a bill that would prevent a no-deal departure, Johnson has threatened to call for an election, potentially reshuffling the lines of power. 

What a no-deal Brexit could mean for the UK’s economy

A no-deal Brexit could impact not only the United Kingdom’s economy, but the economy of significant trading partners, such as the United States. In 2018, the Federal Reserve worried that a no-deal Brexit would make London subsidiaries of US banks make the costly relocation to another EU country in order to keep EU clientele and that it could become less profitable for US banks to loan to UK citizens.

Leaving without a deal would mean that the UK would leave a customs union and single market overnight. As a member of the EU, the UK’s goods were not taxed by other member countries. After going cold turkey on the organization, Britain will lose that privilege and the EU would start taxing their goods

According to the BBC, “This could lead to delays at ports, such as Dover, Some fear that this could lead to traffic bottlenecks, disrupting supply routes and damaging the economy.” With almost one-third of food in the UK coming from the EU, food shortages are another concern.

Source: https://www.bbc.com/news/uk-politics-32810887

In the weeks following the initial referendum, the value of the pound fell a little over 10% against the euro from €1.3017 to €1.1663, according to the Brexit currency fallout engagement rate tracker. The original vote also caused the Dow to drop 610.32 points. While Capital Economics’ Senior U.S. Economist Andrew Hunter points out for CNBC that the market volatility “unwound” itself in the weeks following the vote, and suspects the same could happen following Brexit.

What does the economic future of a country leaving the EU look like?

No one knows for certain. The United Kingdom would be the first nation to leave the European Union. There is no precedent. In many ways, it is a shot in the dark. A shot in the dark that has been making headlines for a little over three years and no satisfactory resolution in sight, creating a sense of anxiety for consumers. In August 2019, British consumer confidence fell to a seven-month low, with many attributing that to Brexit worries.

Source: tradingeconomics.com

According to The Guardian’s Sean Farrell, Britain’s economy has been treading water because of consumer spending amidst manufacturing and constructing shrinking and the unwillingness of companies to invest. However, the UK’s decreasing consumer confidence could encourage people to save rather than spend, putting a dent in that part of the economy.

What exactly is Brexit an economic indicator for? It’s unclear. It could be nothing. Or, it could help push the nation into a recession. Only time will tell, but as the prospect of a no-deal Brexit becomes closer to a reality, the UK and the EU’s economic futures may be the scariest thing on Halloween.

Sources:

Premium Gas Says a Lot About Our Economy

In his book “Misbehaving,” behavioral economist Richard Thaler analyzed a 2011 study by Justine Hastings and Jesse Shapiro which explored the relationship on spending and gas prices. The study found that during the 2008 financial crisis, when gas prices fell 50 percent from $4 a gallon to $2 a gallon, the money that was saved on buying regular gasoline ended up being spent on premium gasoline instead. Instead of pocketing the money in case of an emergency or allocating the extra cash elsewhere, car drivers viewed their decision to upgrade gas as a splurge. 

If households view premium gasoline as a splurge, then gas may be seen as an economic indicator. By definition, an economic indicator is used to predict investment possibilities and assess the economy’s overall health. In the same way that women view cosmetics like lipstick as an affordable splurge during hard times, an increase in buying premium gasoline can be an indicator of an economic fall. 

Gas is a frequent and telling purchase. 85 percent of Americans either drive alone or carpool to work each day, according to American Community Service data, and there are over 115 million cars on the roads each day. 

Although it may seem counterintuitive to be spending more on a higher grade of gasduring a recession, Thaler attributes this seemingly irrational behavior to a concept he termed “mental accounting,” meaning that consumers all have mental spending “buckets” that are largely separate and unchangeable. For example, the study found that a save in filling up a driver’s gas tank did not readily translate to a consumer using the extra money to upgrade their orange juice or milk choices.

Mental accounting visualized / Twisha Shah-Brandenburg

Another study conducted by the American Automobile Association found that 16.5 million motorists in the United States purchase premium gas. However, 70 percent of cars driven in the U.S. require only regular gas. The study estimates that purchasing premium gas wasted $2.1 billion in 2016 because motorists perceive premium gas as better for their engines when in reality, it is an unnecessary purchase. Despite the state of the global financial crisis in 2008, spending on premium grade gasoline rose by 14 times the usual amount even more so than normal, according to the Hasting and Shapiro study.

In April of this year, the L.A. Times reported that gas prices rose to over $4 a gallon for the first time in four years. While the price of gas itself may be seen as an economic indicator, the amount of spending on premium grade gasoline can also chart economic changes. When gas prices go down during periods of economic recession, the purchase of premium grade fuel may go up due to its now-affordability as a splurge item, signaling an economic downturn. As gas prices rise, more consumers have forgone splurging on premium and have settled for regular due its lower cost because in their minds, they don’t have any discretionary funds from their gas money “bucket” to pay for better quality fuel. 

Why Argentina’s inflation rate could continue to grow!

Argentina’s inflation rate has risen to as high as 57 percent this year and has stayed at around 55 percent since its peak in May of 2019.

President of Argentina, Mauricio Macri, (Right) in a meeting with President Trump(Left)


In recent memory, Argentina has been known for two things: Really good homegrown beef and an extremely high inflation rate. Thank god for the high-quality beef, a key trade asset that has kept some value in the economy. However, even the best beef in the world can’t save the economy from an inevitable crash or crisis. Argentina’s inflation rate at the end of 2017 was only 24 percent, still unbearable, but nowhere near as bad as 57 percent. So the question is, what is the reason behind their 30 percentage point spike in inflation and how do we fix it?


The spike in Argentina’s Inflation rate over the past year (The Trading Economist)

Background information on how we got to this point

The Central bank has tried to control the Argentinian inflation rates in the past, but has proven unsuccessful. The Argentinian peso lost almost 51 percent of its value in 2018, and this year has lost 15 more percent of its value compared to the U.S. Dollar. The disesteemed peso has caused an extreme recession in Argentina, where poverty rates have gone up tremendously. The economy contracted 5.8 percent in the first quarter of 2019. This has left foreigners skeptical to invest in the Argentinian peso, but many continued their investments due to confidence in a turnaround. The spike in inflation in 2019 has not only driven most investors to stay away from the Peso, but has also forced banks to ease limits on foreign exchange interventions. The President of Argentina, Mauricio Macri, has been under a lot of pressure to fix the inflation rate or at least make the economy emerge in the right direction. But with election day coming in October, Macri’s chances of being re-elected are diminishing. Macri was elected as a moderate that would be fiscally conservative, a polar opposite to the “free-spending” 2015 president Cristina Fernandez, who originally started the extreme spike in inflation.

The Inflation Spike!

When Macri was elected into office in 2015, he started off with major budget cuts to offset the “free-spending” of Fernandez. Macri was furious with the free public subsidies given to families to get back on their feet from the 1998-2002 Argentine Great Depression that left millions impoverished. He believed that these subsidies caused an extreme spike in inflation and when Macri became elected, he got rid of the subsidies right away. People had relied on many of these subsidies to help provide for their family, and when these were taken away, they were not prepared to pay for things that had previously been taken care of by those subsidies. Once the budget cut kicked in, “Every time a water, electricity, or home heating gas subsidy was reduced, people’s monthly utility bills went up”(PRI.org), which caused consumer spending to go down dramatically. Business’s also had to pay off the utility bills which raised prices on goods and services. The people could not afford the goods and services anymore. The central bank then raised interest rates tremendously, thinking it was a good decision since the safe United States economy among other safe economies were doing it as well. Instead, private investment went down even more, and the recession got worse as inflation skyrocketed.


Lowering the inflation rate and Argentina’s big decision in October!


Former president of Argentina Cristina Fernandez

People put Macri at fault for the whole situation and blame his moderately conservative policies as the leading indicator for the spike in inflation. However, those policies did not spike inflation on their own as Private investors staying away from the devalued peso helped skyrocket inflation as not enough money was coming into the economy. Many are so angry with Macri that they want to venture back to “free-spending” and vote for the ultra-liberal and former president Cristina Fernandez. Citizens believe that Fernandez will at least lower the inflation rates back to 25 percent from 56 percent, since it hovered around there for part of her presidency. However, many of these citizens are uninformed and there are many lurking variables behind the spike in inflation and what caused it. Yes, Macri made the spike in inflation worse with his policies driving investors away, but this crisis could have been avoided if Macri implemented his policies at a slower rate, rather than drastically changing the economy right away which he did. Fernandez will make drastic changes as her free-spending agenda will raise inflation even more, ultimately making Argentina unlivable. Argentina needs a moderate with a fiscal agenda to take over. Macri was not the right fit, but someone who can read economies better than him, use similar fiscal policies, and implement those policies at a slower rate will make the economy better. If the people of Argentina decide to go ultra-liberal with their inflation rates at 56 percent, then an even bigger crisis is inevitable.

Sources:

Main source: https://www.pri.org/stories/2019-05-06/how-argentina-crept-threshold-crisis-again

Source 2: https://tradingeconomics.com/argentina/inflation-cpi

Source 3: https://www.forbes.com/sites/stevehanke/2019/03/16/argentinas-peso-nothing-but-trouble/#1f5a1d262a9a

Pop the bubbly on this unique economic indicator

By Sarah Montgomery

Photo from reservebar.com,

Champagne was discovered by Dom Pérignon, a monk who lived in the Champagne region of France in the 17th century. Upon the creation of this new concoction, he said to his peers, “Come quickly, I am tasting the stars!” Beyond being a delightfully bubbly beverage, champagne also serves as an economic indicator. Because the consumption of champagne often goes hand-in-hand with celebrations, the sales of champagne mirror the ambiance of the market. This relationship offers analysts insight into how the economy is doing. As put by Pascal Férat, the president of a Champagne-producer’s union, “When people are down in the dumps, they don’t feel like drinking [C]hampagne.” 

When people are down in the dumps, they don’t feel like drinking [C]hampagne. 

PASCAL FÉRAT
Image result for champagne pouring
Photo from vinegar.com.

When people are spending money on champagne, it indicates that not only do people have enough money for necessities, but they have enough disposable income to splurge on luxuries—times are good. 

NPR’s Planet Money searched for the most interesting economic indicators. They found that Champagne sales are about 90% accurate in, one year later, anticipating the average American income. The theory is that while good times are ahead, bad times will soon follow. Davidson offered the peak of the Internet and Housing bubbles as examples of times when champagne sales were high in 1999 and 2007 respectively; famously, the years following those were those of a weaker economy. 

Graph from The New York Times Company.

In its annual report, the Comité Champagne, a French community that represents champagne makers, notes an increase of global champagne sales while also having a 1.8% fall in shipments. An interesting place where champagne sales fell was in the U.K, historically the largest export market for the fizzy refreshment.; some suggest that Brexit is the reason. Shipments to the following countries grew: the US, Japan, China, Hong Kong, Russia, and South Africa. 

Graph from the Comité Champagne.

The U.S. Champagne Bureau, a representative of the Comité Champagne, echoed these findings and announced in March that an increase of sales champagne bottles occurred between now and 2017. And according to Beverage Wholesaler, “overall consumption [of champagne and sparkling wine] is up 56% in the past decade, and shows no sign of slowing.” Furthermore, more people are drinking champagne year-round. These are significant developments signaling prosperity, so perhaps the economy will falter in the near future. 

Geographic Location and Entrepreneurial Opportunity

Silicon Valley acts as the entrepreneurial hub and home to major tech companies and start-ups on the west coast. TV series and movies depict this culture of wealth and fame. But this San Fransisco tech hub is not the only city in the United States that fosters this type of creative and financially flourishing environment. Over the past 10 years, start-up culture has spread throughout the United States and is flourishing in cities like Boulder, Colorado and Austin, Texas. Boulder has a population of approximately 100,000 people and in a study done in 2010 by the Kauffman Foundation, Boulder has six times more high-tech start-up’s per capita than the nation’s average and twice as many per capita than San Jose-Sunnyvale in California.

Normalizing this start-up culture has helped Boulders economy flourish, but not all metropolitan cities have the financial backing and culture that could support this shift. Though the majority of millennials in metropolitan areas understand the benefits of integrating small businesses and technology into their city, older generations and individuals with a traditional mindset have difficulty coming to terms with this non-traditional shift in career trajectory. But what makes a city a successful hub for start-up and venture capital culture, is the willingness to explore opportunity and advancement for your environment. Start-up culture is fostered by problem-solving, so is it possible that down the line more cities will become tech hubs and how will this affect entry-level jobs and cities economic development? The cities economic and social structure needs to be supported by the infringement that incorporating entrepreneurial opportunities will bring. Automation, data analysis and other forms of technology will continue to grow and change the systems placed by standard job structures, and the infrastructure of the city around it must be prepared for the change it will bring as well. 

Innovation impacts socio-economic objectives.

Incorporating new practices and innovative efficiencies into a new market will have a positive effect on the socio-economic objectives of a city because incentivising an entrepreneurial culture will ultimately resolve unmet needs. Unmet needs meaning desired services, tangible inventions and reforms to existing systems. Opening small businesses and branches of larger corporations and remote offices also mean that there will be more employment opportunities in a city. Whether the level of entry is higher than a cashier or waiter type position, the market will continue to grow and change with an influx of jobs being introduced either way. This incentivizes people to relocate to these cities, like Boulder or Austin, where the market is rapidly increasing with more complex executive positions, that require a form of expertise. For the past 30 years, the resident population in Boulder County has been steadily increasing, which proves that the growing economy is attracting more people every year.

Unmet needs meaning desired services, tangible inventions and reforms to existing systems. Openings of new businesses and corporations also mean that there are more employment opportunities. Whether the level of entry is high, the industries market will continue to grow and change with an influx of jobs being introduced either way. This is a very positive trend in these metropolitan areas because the demand for jobs, while the price o rent, insurance, tuition, etc. all seem to be increasing as well, therefore unemployment rates have been at a steady decrease since the financial crisis in Colorado.

Brad Feld, the author of “Startup Communities: Building an Entrepreneurial Ecosystem in Your City and Co-founder,” the co-founder of TechStars and managing director of Foundry Group, a VC fund focused on early-stage investments, developed the concept called the “Boulder Theory.” This theory is based on breaking down the four major components essential to how start-up communications start and evolve. Noah Horton, CEO, and Co-Founder of Unsupervised, an AI data analysis tool that is used to automatically detect trends and draw insights from a companies data in a much shorter time span, spoke with me about his take on the “Boulder Theory.” Horton chose to relocate to Boulder, CO from the infamous Silicon Valley for a better quality of life. In a phone interview with Horton, he said that, “It just makes more sense to save money and live some place where I will be surrounded by nature and still be able to find incredible talent to come work with us.” Horton has been in Boulder for the past three years and has seen a continual increase in people moving to the city, and finding talent that is leaving the bay area to come to what National Geographic has deemed The Happiest City in the United States.


Commerce and regional economic integration.

What is important to note is that emerging tech and transportation make it possible for small businesses to export and do business on a national and global scale. Therefore working in cities that are not coastal or main financial hubs, make it possible to still be successful. The selling of local goods contributes directly to that particular region’s earnings and productivity which strengthens the economy and supports the ecosystem and local economy. Having increased investment and entrepreneurial activity is extremely beneficial for an interconnected global economy. The trend of starting new businesses and endeavors in a city gives hope, inspiration and motivation to people living in the city to conceptualize the new sense of opportunity in their area. Entrepreneurs finding solutions to market needs and providing new goods and services proves that cities throughout the United States are capable of pursuing similar endeavors that will enrich their local and the nation’s economy. Articles and lists have been published regularly as well highlighting Colorado’s success in businesses thus far. Built in Colorado focused on promoting the “Top 50 start-ups in Colorado” with the first five companies including autonomous vehicle engineers, educational technology, security data analysis, and a virtual reality house realtor, so you can walk through a house without making an appointment to physically go there. These are just some examples in which the city is advancing and growing their infrastructure. 

The proof of growth

What makes projects and change like this so exciting in a city, is that this does not mean that Silicon Valley and New York City are ever going to go away. What this now means is that you do not have to pay to live in one of those cities to have a successful and well-paying job at one of the same companies, there are growing businesses and tech start-ups that are fostering the same environment as they would in any other city. According to BuiltInColorado tech companies in Colorado raised $780 million in funding in 2017 and $35 billion in exits alone in that year. The volume of capital raised is significantly small in comparison to New York raising $4.227 billion in funding during the third quarter of 2017 and the Bay Area raising $4.117 billion as well during that quarter in local start-ups. But, having $35 billion in exits alone means that outside investors are willing to invest and foster the growth of companies out of Colorado because a are aquiring majority of them. In 2017 alone, tech companies, according to CompTIA, made up “9.7% of the workforce in Colorado and contributed $43.4 billion to Colorado’s economy, representing a 14% share in the state’s total economic landscape.” These statistics provide the city with quantitative reason to believe that this direction of Colorado’s investments in start-up culture is benefitting the economy in a positive manner. Honing the ability to create a template or potentially franchisable ideologies and systems to support similar growth in cities across the United States could have a very positive effect on the nation’s economy overall.

Sources:

https://www.cyberstates.org/pdf/CompTIA_Cyberstates_2018.pdf

https://www.nationalgeographic.com/travel/destinations/north-america/united-states/colorado/happiest-city-united-states-boulder-colorado-2017/

https://unsupervised.com/team/

https://www.businessinsider.com/new-york-beat-out-san-francisco-as-a-venture-capital-powerhouse-2017-10

https://www.inc.com/magazine/201312/boulder-colorado-fast-growing-business.html

https://powderkeg.com/the-denver-boulder-startup-scene-a-guide-to-the-front-ranges-givefirst-tech-cultur

https://www.builtincolorado.com/

https://www.builtincolorado.com/2017/10/24/top-100-digital-companies-colorado-2017

Affordable Housing is Not So Affordable Anymore

As a student graduating with some debt, I empathize with the approximately 44 million borrowers who begin their adult lives feeling financially behind. This is an issue that does not only hinder Americans throughout their lives but especially in the first 10-20 years after they graduate from college. Some of the first steps to becoming financially independent come from getting your own credit card, purchasing high-value items like your first car, groceries, insurance, and then putting money down on your first house. All of these transactions require you to have a certain amount of credit in order to do so, which is difficult when you have upwards of $100,000 of debt to your name before people even apply for their first credit card in their name. Though most importantly, understanding the debt that I will have, along with a lot of my friends, makes me feel nervous about future investments such as purchasing a house. But I am not alone in that concern. The housing market is only decreasing while student debt is skyrocketing, and the long-term effects of this situation are yet to be determined as the debt continues to accumulate. 


Millennials between the age of 24-34 are around 8 percentage points lower than baby boomers and Gen Xers when they were that age in homeownership, according to a report by the Urban Institute, a policy research group. Only 37% of millennials born between 1981 and 1997 are homeowners, which does not show a lot of promise moving forward as the housing and entrepreneurial markets have presented solutions to avoid taking out loans and mortgages. A main factor is also the regressing age of marriage. Societal norms are changing and evolving, normalizing the concept of getting married later and women completely joining the workforce, which was not the case, to the same extent, 30 years ago. The more single people in their 20’s the less people will be willing to invest in property because are not assuming that that will be their permanent residence. This is all very important information because as a borderline millennial and Gen Z individual myself, I believe it is important for us to understand the greater effect these changes are having on the economy and how it will affect the market down the line.


According to the graphs created by the Federal Reserve Flow of Funds on Market Watch’s Capital Report, home prices since 2010 have only gone up at a steady rate, making it increasingly more difficult for the skyrocketing amount of student loan debt. Economists are worried about what this challenge will present for future homeowners. The New York Fed shows that the there is approximately $1.4 trillion of student debt accumulated in the United States, while the GDP is $19.4 trillion. Which means that the student loan debt makes up approximately 7% of the total GDP. With that being said, the amount of people investing in the housing market is decreasing which is a strong contributing factor of why housing prices are high. It also makes it difficult that the millennial generation is so keen on leases and rentals rather than making long term investments.


With new companies such as Airbnb entering the space, and co-ops providing short term housing, they are effectively changing the perception and future of the housing market. Conceptually, it will be very challenging to reverse a generation’s perception of long and short term goals with investing, marriage, and daily spending habits. So it will be interesting to see how the value of the housing market shifts and if reforms will be made to help appease the student debt crisis at the whole.


Sources:

https://www.marketwatch.com/story/the-surge-in-student-debt-may-be-linked-to-the-wreckage-in-the-housing-market-2018-01-26 

https://www.nar.realtor/sites/default/files/documents/2017-student-loan-debt-and-housing-09-26-2017.pdf

https://www.cnbc.com/2018/03/29/these-are-the-ways-student-loans-stop-people-from-buying-a-house.html


Sports media rights battle, streaming may end reign of the broadcasters

As with essentially every industry, the ways in which we consume sports are consistently refined by technological innovation. Radio, as well as broadcast, satellite and high-definition TV have raised the profiles of baseball, football (both kinds) and basketball. The Internet, too, modified the ways we watch sports, with the ability to analyze information no longer through merely a television screen or that morning’s newspaper. With the web fully entrenched in basic society, new streaming services offer consumers real-time information essentially whenever and wherever they want it, decreasing the need to be in front of the television for a particular program — except for sports, live content’s last bastion. These changing dynamics in streaming, doubtlessly, will further upend the model of sports consumption and threaten the viability of broadcast networks in favor of newer technology companies.  

The standard over the past few decades has been for sports leagues to sign “media rights deals” with content providers, who pay to broadcast their games and content throughout the nation and the world, primarily on television [source]. Technological advancements and the practice of economic globalization have enlarged the population of sports consumers; the “rapid rise in sports costs is consistent with supply/demand theory,” creating a “constant imbalance in favor of the … nearly permanent supply shortage of top talent [while] … there are more potential bidders for their services” and content featuring the minuscule number of superstars [source]. So, the value of the sports leagues’ content has leapt and will continue to leap, because the “number of competitors is relatively large … generating continuous high demand” [source]. To date, the majority of these sports media rights deals have been with television companies, which broadcast the sporting events and highlights into homes. As Mark Leibovich, author of the book “Big Game: The NFL in Dangerous Times,” notes: “60 percent of [NFL] revenues [come] from TV over most of their history, and the ratings are going down” [source]. The leagues are paid handsomely for their content, now at the level of billions of dollars per year. To illustrate, the NBA signed its most recent national TV deal in 2014, a $24 billion, nine-year contract with Disney (through its media networks ESPN/ABC) and Turner Sports, which took effect in 2016 at a rate of $2.667 billion per year [source]. To make revenues and account for the rising costs of producing live events such as sporting events, the operators charge a fee to consumers for the channels that show it.

The research firm SNL Kagan has estimated that in 2017, “$18.37 out of the typical cable subscribers’ [$103] monthly bill was allocated just to sports networks like ESPN and Fox Sports” [source]. Sports – live content – is king. Where pay-TV providers charge more for regional sports networks, it is even higher, as much as “$20 to $25” per month. This is a raise of over five hundred percent since the start of the millenium [source].

However, simultaneous with rising fees over that time period to help pay for the increasing sports rights came the new streaming services and technological advancements that have allowed people to access content, such as movies on Netflix or sports, in a mobile manner. Young people especially are not watching cable anymore; according to Pew, 61% of adults ages 18-29 use streaming services as their primary way to watch content traditionally only available on a television [source]. Choice is king for the people who are going to be consuming content for the next generation. These “a la carte” services, claims NBA Commissioner Adam Silver, are the future of how the majority of people will watch sports [source]. This season the league has started selling not just slices of the 82-game season on a game-by-game basis but also parts of games as well, in order to provide more “customized experiences to meet the needs of NBA fans” [source]. A la carte offerings are perfectly suited for the mobile-first methods of the digital natives, who will come to dominate the consumer base of the media industry.

As a result, they are the main “target in the push to increase TV-anywhere options. Unlike older viewers, they were brought up in the internet age. For them, spending a significant monthly fee on cable TV isn’t a necessity,” especially when they are paying for dozens of channels they never watch [source]. Paying as much as $25 monthly just for sports deters many from shelling out their hard-earned money, because they could pay that much to watch just the shows they want [source]. Why pay $100 for a buffet if out of three dozen items, you are only going to eat two, which cost a fraction of the buffet?  

As an executive at a top streaming service company said, the industry is changing rapidly [personal conversation]. Streaming and a la carte choice options are revolutionizing how we watch content and as a result the traditional cable and network companies need to adapt.

Because the “typical cable TV regional sports network (RSN) recoups less than 30% of its total revenue from advertising” they are desperate to retain as many subscribers as possible, who account for “the vast majority of revenue” [source]. National TV providers take in a similar level of revenue from subscriber fees, according to the FCC as well as an ESPN executive [personal conversation].

As sports rights rise, the companies charge more in fees to help break even; at $7.21 per subscriber, ESPN is now the most expensive single cable network available in one’s cable/satellite bill [source]. While the total subscribers is indeed falling, demand is not: because it is the one place live content still rules, where advertisers can be sure that people will tune in during the event, ESPN can afford to charge that much (to people who want to pay for it). For the people who want to buy the cable buffet because that is the only way they can watch their local teams or get blacked out, it is presently worth it [source]. As Rich Greenfield of BTIG wrote, “Sports is … the only content that is holding its audience viewership-wise and in turn supporting the $70 billion TV ad industry” [source]. However, the number of homes paying for ESPN declined over ten percent in the last five years, from 100 million in 2012 to just 87 million last year.

As 23 percent of U.S. households have either cancelled cable or never signed up in the first place, according to a 2016 PwC survey, the trend ESPN is facing should only continue [source]. Now more than ever, cable networks must extend or renew their TV rights to attractive sports programming. As PwC’s sports industry outlook notes, sports are essentially “the only thing keeping the lights on at the networks” [source], especially at ESPN, whose business model is solely based on 24-hours-per-day sports content. They literally cannot function without the content that has made them a behemoth in the industry.  

So, cable networks are jumping headfirst into the over-the-top and streaming game, threatened by new media’s rise and the decline of their own subscriber base. To survive and continue to have success in this changing media landscape, they cannot be satisfied with their current subscribers. Like Ariel in The Little Mermaid, the networks need to be “part of that world … where the people are” [source] — which in this case is streaming and “pay-anywhere TV.” Disney is spending millions of dollars on “ESPN+”, CBS on “CBS All-Access”, Turner on “B/R Live” – their attempts at creating streaming services. It remains to be seen whether the promulgation of streaming services (along with another Disney service to be launched next year, HBO, Amazon, Hulu, Netflix…) will cause a glut of menu items for consumers, which may be where we are heading in the near future as companies look to hoard their own intellectual property and control sports rights [source]. However, in sports, the possibility of a large media or technology conglomerate claiming access to a near-entirety of a league’s offerings could lower consumer angst. NBA Commissioner Emeritus David Stern wonders about the “unique possibility to have one buyer on a global basis. It could be Apple, Amazon, Hulu, Facebook, Google, AT&T—could be almost anything” [source]. The current battle over regional sports networks will perhaps be a test case.

In 2002, the New York Yankees developed the Yankee Entertainment and Sports (YES) regional sports network to strengthen the value of its content for local consumers and develop new revenue streams. Major networks such as ABC or FOX had only broadcast select numbers of games per season to people around the country; regional networks proffered the opportunity for viewers to watch nearly all their home team’s games. The Bronx Bombers’ enterprise introduced the RSN epoch: many teams in MLB and the NBA now have launched their own networks to take advantage of local revenues; in the MLB, these contracts are worth anywhere from $1.5 billion (Arizona Diamondbacks) to $3 billion (Los Angeles Angels) over twenty years [source]. Markets like Los Angeles or New York have greater demand and numbers of viewers for the same content as Arizona, therefore those media rights deals rake in as much as double the revenues (and is a key reason why the Angels changed their city name from “Anaheim” to “Los Angeles”) [source]. These dramatically different local media rights deals also affect competitive balance and league health: The Los Angeles Lakers’ local media deal dwarfs any other NBA franchise’s by about $25 million; they were the most profitable team in the league despite missing the playoffs for five consecutive years [source]. Moreover, in MLB, owning significant portions of these extra revenue streams has helped teams like the Red Sox and Yankees dominate free agency and acquire the “star talent”, like Alex Rodriguez, who drive content values high [source].

Over the last two decades, Fox acquired in exchange for a “yearly licensing check” majority stakes in 22 RSNs, the value of which has now ballooned to $44 billion due to all the exclusive premium sports content, according to Guggenheim Securities [source] [source]. And so it goes that Disney’s recent acquisition of 21st Century Fox will reshape not just the movie industry (decreasing the number of major studios from six to five) but also sports content [source]. Fox’s regional channels serve around 61 million subscribers around the country, a godsend to cable operators and a would-be boon to technology companies looking to seize market share and eyeballs from one another. The 22 RSNs that Fox owned will have to be divested as a result of the deal, to prevent “cable television subscription prices from rising even higher … and ensure that sports programming competition is preserved in the local markets,” according to Makan Delrahim, assistant attorney general and head of the Justice Department’s Antitrust Division. “American consumers have benefitted from head-to-head competition between Disney and Fox’s cable sports programming” [source].

The competition will only get fiercer, as more players enter to gain direct consumer attention, arguably the most valuable market good there is. The forthcoming battle for sports media rights will truly be the “ultimate test of the supply/demand equation, an underlying principle of the free enterprise system and free market economy” [source]. Fox’s 22 MLB regional sports networks is now up for grabs, and who is bidding for them will be a harbinger of the coming battle for sports content come the next decade once deals expire for the major leagues — and for viewers in the future of the 21st century. Consistent with supply and demand economics, the values of sports rights will rise, with the same amount of content, the escalating emphasis of live programming for advertisements, and more possible buyers. This could drive vicissitudes of fortune for traditional broadcasters. A Defcon 1 scenario would be if a traditional broadcaster loses out entirely on a sports rights deal. Amazon, Twitter, Alphabet’s YouTube, and Facebook have each already made forays into paying for live sports, streaming NFL Thursday Night Football, NBA games, and MLB games, respectively, via their over-the-top services. The Financial Times notes that these moves are “part of a wider shift toward so-called “skinny bundles”, whereby consumers are offered a smaller range of channels for a fraction of the price of a full cable package” [source]. Amazon has already put in a bid for the RSNs, if not merely to drive up the cost for another winner, then to implement them into Amazon Prime services similar to their actions with Thursday Night Football on the chance they end up claiming the networks. “It [would increase] digital advertising opportunities for Amazon, which is growing its market share against Facebook and Google. Perhaps most importantly, it brings even more people into the Amazon tent, exposing them to all of the products and services Amazon offers,” according to CNBC [source]. On another front, no less than Fox chief Rupert Murdoch has said that “Facebook is coming for sports;” Dan Reed, a Facebook executive, says that “sports is a natural fit” [source]. Having dipped toes into the water, the large technology companies are going to dive wholeheartedly into the sports media business in the near future. Even if tech companies do not win this RSN test run, they will no doubt be major players in the bidding for the future sports rights, 16 major auctions of which are coming worldwide over the next half-decade, according to GroupM [source]. Claiming some if not all of those rights and shoring up their relatively nascent streaming services will reshape media offerings.

The tech giants’ enormous capital reserves [source] that could drive up the bidding to an exorbitant level ($4 billion for the NFL? $2 billion per NBA season?) probably won’t destroy the financials of some traditional broadcasters by the early 2020s, but that combined with growing rate of subscriber drop-off (could only 50 million homes be cable subscribers in five years?) will hamper networks’ abilities to spend as much on rights the next time around. It is quite a possibility that there could be an internecine battle between broadcasters, resulting in a pyrrhic victory for the winner. Already, rights have gotten so expensive that ESPN could not win the bidding for the Champions League and accentuate its investment in MLB rights [source]. Come the second wave of these types of deals in the late 2020s, the costs could deter some broadcasters from seriously bidding for them. Perversely, over the long term, rights deal valuations may fall as broadcasters drop out, although other technology companies could enter the fray and stabilize or even drive up pricing. As David Stern literally said today, “you have to look to the future or you die” [source]. Because broadcasters are slowly coming around to reality out of dire necessity, they may survive in the short term. In another decade, in 2030, though, we may all be watching sports through the services of our Amazon or Alphabet overlords, ironically with more customizable options.


Sources:

http://home.bt.com/tech-gadgets/internet/streaming-explained-what-is-it-and-how-does-it-work-11363860639261

https://business.comcast.com/about-us/our-history

https://www.crunchbase.com/organization/yes-network#section-overview

https://digiday.com/media/what-is-over-the-top-ott/

https://money.cnn.com/2017/07/19/investing/apple-google-microsoft-cash/index.html 

https://www.digitaltrends.com/movies/too-many-streaming-services-netflix-amazon-disney-att/

https://www.cnbc.com/2018/11/20/amazon-threat-to-buy-sports-rights-should-freak-out-media-companies.html  

https://adage.com/article/media/pwc-report-sports-m/311578/

https://mashable.com/2015/07/23/nba-league-pass-new-deal/#pRXrKXEIJgqz

https://www.washingtonpost.com/business/2018/12/06/david-stern-built-modern-nba-now-he-wants-change-how-we-consume-sports/?utm_term=.0ffeb77a5167

https://www.forbes.com/sites/bobbymcmahon/2017/08/18/turner-sports-uefa-champions-league-strategy-a-nod-to-the-long-tail/#5738b00d4594

https://variety.com/2018/digital/features/olympics-rights-streaming-nbc-winter-games-1202680323/

https://www.businessinsider.com/sports-media-rights-revenue-poised-to-grow-2017-12

https://www.forbes.com/sites/barrymbloom/2018/08/28/yankees-intend-to-buy-back-yes-network-after-fox-sale-to-disney/#5b70b9db161d

https://www.21cf.com/news/21st-century-fox/2014/21st-century-fox-acquire-majority-stake-yes-network/

https://www.ocregister.com/2015/01/07/los-angeles-angels-of-anaheim-10-years-later-how-big-of-a-deal-was-the-name-change/

https://www.theatlantic.com/business/archive/2017/05/espn-layoffs-future/524922/

https://www.youtube.com/watch?v=SXKlJuO07eM

https://variety.com/2018/biz/news/disney-21st-century-fox-justice-department-approval-1202859241/

https://www.forbes.com/sites/maurybrown/2017/05/08/why-espn-hemorrhaging-subscribers-will-impact-the-next-wave-of-national-tv-deals/#54aad835bf4f

https://finance.yahoo.com/news/youtube-amazon-fighting-sports-streaming-supremacy-114738861.html

https://www.theguardian.com/media/2018/may/14/streaming-service-dazn-netflix-sport-us-boxing-eddie-hearn

https://www.latimes.com/business/hollywood/la-fi-ct-disney-fox-sports-nets-espn-20171206-story.html

https://www.si.com/tech-media/2018/07/12/fox-regional-sports-networks-potential-buyers-comcast-disney

https://www.theatlantic.com/entertainment/archive/2011/09/the-many-problems-with-moneyball/245769/

http://time.com/money/4590614/cable-bill-sports-cord-cutting-streaming/

http://www.snl.com/Sectors/Media/

https://www.recode.net/2018/9/10/17838688/mark-leibovich-big-game-nfl-dangerous-times-book-drug-lord-crack-kara-swisher-recode-decode-podcast

https://www.amazon.com/dp/B078LTFG52/ref=dp-kindle-redirect?_encoding=UTF8&btkr=1

http://www.pewresearch.org/fact-tank/2017/09/13/about-6-in-10-young-adults-in-u-s-primarily-use-online-streaming-to-watch-tv/

https://www.businessinsider.com/espn-losing-subscribers-not-ratings-viewers-2017-9

http://time.com/money/4590614/cable-bill-sports-cord-cutting-streaming/

https://www.chicagotribune.com/sports/columnists/ct-sports-tv-future-spt-0828-20160826-column.html

https://www.washingtonpost.com/sports/2018/09/27/nba-fans-will-be-able-purchase-ends-games-streaming-services/?utm_term=.22f10653c3fc

http://www.pewresearch.org/fact-tank/2017/09/13/about-6-in-10-young-adults-in-u-s-primarily-use-online-streaming-to-watch-tv/  

http://www.nba.com/2014/news/10/06/nba-media-deal-disney-turner-sports/

https://beonair.com/history-of-sports-broadcasting/

https://transition.fcc.gov/enbanc/121897/anshand.pdf

https://www.ft.com/content/2234f4da-3ef8-11e7-82b6-896b95f30f58

https://www.latimes.com/business/hollywood/la-fi-ct-disney-fox-sports-nets-espn-20171206-story.html

http://www.pewinternet.org/2015/12/21/4-one-in-seven-americans-are-television-cord-cutters/

http://www.espn.com/mlb/news/story?id=1735937

http://www.espn.com/nba/story/_/id/20747413/a-confidential-report-shows-nearly-half-nba-lost-money-last-season-now-what

Personal interview/lecture, ESPN executive, Spring 2017

Personal interview/lecture, Professor Jeff Fellenzer, USC, February 2017

Personal interview, Professor Jeff Fellenzer, USC, November 2018

Personal interview/conversation, Perform Group executive, summer 2018