The Skyscraper Curse

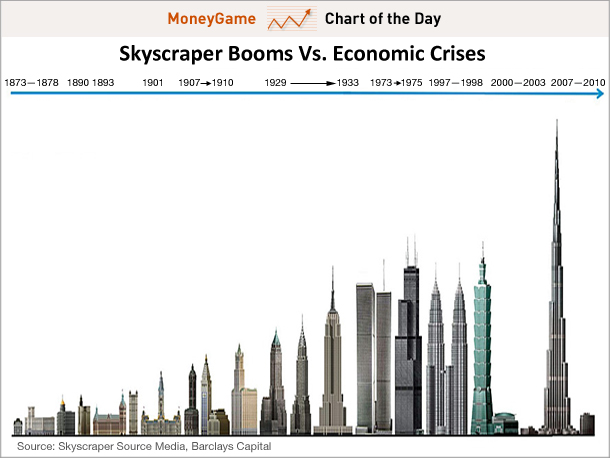
Real estate development has always and still does account for a fairly large proportion of GDP of every sizeable economy. The development of tall skyscrapers has historically been offset during times of economic expansion and booms when funds and monetary resources are more easily accessible, and there is assurance of profitability, naturally. Also, skyscrapers are fairly lucrative by nature because they create more space horizontally in the same plot of land. However, skyscrapers are often just conjectural development projects that are built without any concrete plans relating to usage of the space being created. However, the completions of tall skyscraper buildings seem to have formed a recurring pattern, in the past century or so, of often being pre-cursors to economic recession or financial crises. This correlation between the construction of tall skyscrapers and economic business cycles that ended in recession was first studied in the 1930s, around the time of the Great Depression in the United States. Historical examples of this from the past century include the completion of the Empire State Building in the 1931 when the Great Depression had just started, the completion of the Petrnoas Twin Towers in Malaysia in 1996, which was when the Asian financial crisis began, and of course, the completion of the Burj Khalifa in Dubai in 2010 which was right after the 2008 worldwide financial crisis. Another key example would be the construction of the Sears Towers and the World Trade Center Towers that were built in 1973, during both the 1973 stock market crash and the 1973 oil crisis. According to substantial research done by economists, and there are conflicting opinions about weather there seems to be a correlation between skyscrapers and economic business cycles. While there are some rational explanations as to why the constructions of skyscrapers began during economic booms and ended during major financial crises, opposing research has also shown that there is almost no correlation between construction of skyscrapers and economic conditions, and that past events have been, to an extent, coincidence. Economists who concur with the fact that there is an important association between constructions of skyscrapers reinforce the Skyscraper Index, which was created by Andrew Lawrence in 1999. It states that tall skyscrapers have escalated right before or after serious economic downturns. It is self-evident that large projects like building one of the tallest skyscrapers in the world would get investment during an economic boom, due to lower interest rates, higher demands and easier access to monetary resources. However what’s interesting is that all of these components reach a peak during the growth or construction period of the building of a skyscraper, and this right when the economy has already reached its peak and is about to go into a recession. On the other hand, there are also exceptions to this and there are many economists who would agree that the skyscraper index is not a good enough economic indicator. But it is still an intriguing concept. There are numerous skyscraper projects coming up in the world’s fastest growing and high potential economies, India and China and it would be gripping to see how the completion of the new structures could be correlated to economic conditions in the future.


chart-skyscraper-booms-vs-economic-crises-jan-11-2012


The Happy Meal Indicator

We often search to find indicators to help us prepare for the good and the bad. An economic indicator is defined as a statistic used to gauge future trends in a nation’s economy. Reports on these indicators are released monthly, quarterly, and annually to help the public understand how things are going within our country. Gross Domestic Product (GDP), personal income, and retail sales are among the more popular indicators we analyze.

However, there are many other markers that people have come up with to predict the economy. Notoriously known by its slogan “i’m lovin’ it” and its clown mascot, McDonald’s has contributed to create affordable meals during times of need. While most people are nervous and sad when the economy is falling or acting poorly, the Happy Meal Indicator reacts in direct correlation with the economy.

Happy Meal

At McDonald’s and other restaurants around the globe, the Happy Meal Indicator works such that “in an effort to protect profit margins, restaurants downsize free offerings to kids like crayons and toys” (Platt). This measure allows us to see how big corporations are adjusting to the poor economic activity and loss in revenue. During the 2009 recession, gourmet burger chain Red Robin halved the amount of crayons they gave to kids to color at their tables. I would assume many children were upset that green was no longer when they were given blue and red crayons.

REd Robin

There are no actual numbers that can be calculated from the Happy Meal Indicator, other than alerting us how the hospitality industry is reacting. By analyzing the expense cuts on things such as toys, crayons, and other freebies we are able to predict that corporations have less free cash on their balance sheet and spending is becoming a concern. Another example of this is that many hotels held back from leaving chocolates on their guests’ pillows during the recession as a means to save money.

Although restaurants like McDonald’s and Red Robin look to cut costs during these hard times, they have a better survival rate than others. People want to find the cheapest alternatives to feed their family and support a “normal” lifestyle, so they turn to the dollar menu and cheap food options.

We may or may not notice when our favorite brands have left out a toy in our happy meal, but economists do. There are reasons behind this madness, the themes of toys always coincide with the latest hit film or a major event going on. It is a way to attract people to spend more money; however, the companies can sometimes no longer afford this marketing stunt. Now understanding the Happy Meal Indicator, we will be one step ahead of our colleagues only by knowing whether or not we receive a toy or if our Red Robin no longer has crayons.

Movie Theater Popcorn Index

6a00d834518cc969e20120a6b6ef5b970b

Patterns in consumer spending, which account for more than two-thirds of the economy, are most often the principal influence on both the stock and bonds markets. In times of economic downturn, both consumer confidence and consumer spending become diminished as people tighten their belts.

The 2008 US and world financial crisis that spurred economic recession resulted in a dip in consumer spending between a period of two years [2008-2010], according to the Bureau of Economic Analysis.

In 2009 US consumers spent 2.8 percent less, on average, than they did in the previous year. Expenditures essentially decreased across the board and entertainment decreased by 5.0 percent from the Bureau of Labor Statistics report from 2008. In spite of the overall decreases in spending U.S. box office sales hit an all-time high in 2009 at the height of the recession.

box office

Short-term enjoyment as a means of forgetting economic despair is not uncommon consumer behavior. In fact, after the crash of 1929 that led to the Great Depression consumers flocked to their local theaters. This sort of escapist mentality was mirrored again during the Great Recession, with films like James Cameron’s record-breaking Avatar producing 2.788 billion USD in ticket sales.

imgres

ODEON Cinemas, the largest cinema chain in the United Kingdom by market share took this traditional consumer response a step further by observing trends in the company’s concession sales. Though not a perfect science the chart [below] indicates that while economic downturn may lead to more box office sales, dips in the FTSE – an indicator of consumer confidence – correlate to a decline in the consumption of concessions, more specifically popcorn for U.K. cinemagoers. The cause of these trends is obviously debatable but likely do to the fact that while people may be running to the cinema during periods of economic downturn, they are not necessarily buying up concessions.


odeon popcorn index

The Odeon popcorn index of economic confidence compares average popcorn sales per ODEON cinemagoer with the Financial Times Stock Exchange 100 Index (FTSE 100 Index) of companies on the London Stock Exchange with the highest market value.

Rupert Gavin, chief executive of Odeon, tracked week-by-week popcorn sales and observed that sales of popcorn and the FTSE were not only correlated. At one point sales of popcorn were leading the FTSE.

Between June and July of 2009, popcorn sales continued to rise while the FTSE took a short drop, spiking up again by mid-July. This was significant because it meant that popcorn sales had the potential to predict future economic climates, while also reflecting current climates.

There is no way of knowing for sure whether or not movie theater popcorn sales will remain an economic indicator; however, at least for now they appear to hold a certain level of credibility for gauging the market and consumer confidence and spending.

http://www.thisismoney.co.uk/money/news/article-1679109/Popcorn-index-shows-economy-on-mend.html


Coffee as a leading economic indicator

A recessive economy is no match against the steaming morning luxury that fuels the pulse of the city. Consumers pinch their pockets for the morning Cup O’ Joe, even during economic strife, but the foam-topped coffee can get expensive overtime.

Barista-Jobs-760x450

Folks that are willing to spend as much as $6 a day on a morning beverage is a curious concept in a struggling economy. Spending habits on coffee are inextricably linked to an established morning routine. Coffee drinkers are creatures of habit. The coffee drinker views the cup as an inseparable part of the daily ebb and flow of life. Coffee sales outside of the home skyrocketed in 2004, likely due to the success and popularity of popular corporate coffee houses. Coffee transformed from an in-home treat to a fast food experience.

Over the past decade coffee consumption outside the home has shown some reaction the the nation’s economy. In 2001, coffee consumption outside the home was in the low 30% range as the nation entered the economic recession. Ryan Sweet, a U.S. economist for Moody’s Analytics alludes that a low coffee consumption percent is directly correlated to a high unemployment rate. In 2004, when the U.S. unemployment picture turned around for the better, outside home coffee sales soared from 29% to 40%.


Coffee Consumption Outside of the Home

YEAR 2001 2002 2003 2004 2005
           
Outside Home 32% 34% 29% 40% 39%
Unemployment 4.7% 5.8% 6.0% 5.5% 5.1%
Economic Climate Backdrop Recession “Jobless Recovery” ” “ “Unemployment Improves” ” “
YEAR 2006 2007 2008 2009 2010 2011
             
Outside Home 40% 33% 36% 35% 30% 27%
Unemployment 4.6% 4.6% 5.8% 9.3% 9.6% *9.1%
Economic Climate Backdrop ” “ Recession ” “ ” “ “Jobless Recovery” ” “

*Seasonally adjusted unemployment rate for month of July from Bureau of Labor Statistics

Source: National Coffee Association of USA for coffee consumption in the home and outside of the home; Bureau of Labor Statistics for annual average unemployment rate figures; Economic climate backdrop Moody’s Analytics.

Via aol.news

According to one economist, however, coffee will only suffer in the most serious times, and is considered as necessary as the utility bills and automobile gas. Most coffee houses are doing as well as they ever have, and according to Verner Earls of Chauvin Coffee Company, some coffee houses have reported record sales. “People aren’t going to give up the latte,” claims Verner. “Bigger expenses will go first.” The mindset behind the consumption of coffee allows coffee houses to weather recessions well.

This general trend for coffee consumption does not leave all coffee houses safe. Many local shops struggle with a crunched economy, as well as corporate coffee chains being forced to close down stores. In 2008, during the heat of the recession, Starbucks Coffee announced it will close 600 stores across the United States, according to the New York Times. This move by Starbucks cost over 12,000 employees their jobs, the most in its history (via the New York Times).

The fall of Starbucks in 2008 reveals that java sales are a hot economic indicator of the state of the economy. As the dollar collapses, so does the average American’s spending power.

Coffee has become a fast food luxury treat, all of which its raw materials: sugar, coffee, milk, wheat, and chocolate are all skyrocketing in price due primarily to the fall of the dollar, according the the Huffington Post. This hike in prices causes the cup cost to steadily rise.

Coffee sales, specifically using the example of Starbucks Coffee establishments is a prime example of how a falling dollar will make something like coffee, an item that Americans gorge on, daily for that matter, too expensive to include in the morning ritual.

Speaking from experience, a trip to a coffee shop is an absolute treat that I enjoy frequently with my mom. So much so, that we budget our social coffee hour into our weekly expenses tough economy or not.


Sources:

http://www.riverfronttimes.com/foodblog/2009/04/01/java-enabled-is-coffee-recession-proof

http://archive.boston.com/lifestyle/food/articles/2011/12/14/in_a_weak_economy_buying_morning_coffee_is_a_small_reward/

http://www.aol.com/article/2011/08/11/is-coffee-the-new-leading-economic-indicator/20015519/

http://www.nytimes.com/2008/07/02/business/02sbux.html?_r=0

Global Green Economy Index (GGEI)

After years of discussions about issues such as climate change, air pollution and resource shortage, sustainable development has become a popular concept that many countries want to improve. Some countries really are trying hard. Germany, for example, has been working everywhere from enhancing sustainable transportation to increasing citizens’ involvement in green policy. But there are also countries which think they are doing enough, yet actions don’t come close to making up for the damage that their economy does to the environment.

It’s interesting that our countries never get tired of competing with others. Imagine a flock of children are trying to prove to their mother, that who’s the one that loves her the most. Some make a lot of money; some take good care of her. In this case, the mother (the earth) doesn’t speak, so we need judges.

屏幕快照 2016-09-01 下午12.21.32

The Global Green Economy Index (GGEI) by Dual Citizen LLC is designed to measure and rank countries’ performances in the green economy. In other words, this is a real indicator of how well countries are treating the environment. GGEI was first published in 2010, and has been acknowledged as one of the main indexes to rank national performances of green economy.

There are two sets of ranking: perception and actual performance.

The perception survey is conducted based on the respondents’ assessment on their own green economy performance. The actual performance is evaluated by expert practitioners. Both results were based on the same set of indicators which lie under four main categories: Leadership & Climate Change, Efficiency Sectors, Markets & Investment and Environment & Natural Capital.

屏幕快照 2016-08-31 下午6.16.02

The latest 2014 GGEI report evaluated 60 countries’ performance based on the above categories. Sweden, Norway and Costa Rica are winners of the first three places.

屏幕快照 2016-09-01 上午1.17.04       屏幕快照 2016-09-01 上午1.17.28


While most of the nations have similar ranking between the two, there are countries that show significant difference. For example, United States is 6th in perception and 28th in actual performance. China’s perception ranking is 13th yet its actual performance ranking is 55th.

Obviously, the fastest growing economy did not reach its expectation at all. What went wrong? If we break down the four categories, China is investing heavily on the green market, but its efficiency definitely needs to be improved. Environment & Natural Capital is China’s weakest categories, everybody in and away from China wonders when people would be able to breath in Beijing without worrying getting sick. What can the government do to bring this score up? Perhaps that’s what China will get inspired by reading this report.

屏幕快照 2016-09-01 上午3.13.08


GGEI is an important communications tool for policy makers and international organizations, because it is a good reference point. While most countries share a common goal of maintaining a healthy environment, GGEI provides criticism and reflection on different aspects. It helps countries to realize what is working out and what more needs to be done.

The 2016 GGEI report will be available in the fall, according to the Dual Citizen website.

Economic Indicators: Beer

Economic Indicators: Beer

Image result for beer

The world’s economy is constantly changing and while people commonly use economic indicators such as GDP, unemployment rates, etc. to gauge the economy, other surprising measures can be decently accurate. One interesting economic indicator is beer. When the economy is good beer consumption at restaurants and bars are relatively stable/high. However when the economy is slower, beer consumption also slows down. The reason for this shift is that when people have less spending money they generally go out to eat less and even when they do eat out they are less inclined to purchase drinks at dinner. Similarly people may frequent the bar less and if they do go to the bar they might drink before hand or purchase less drinks at the bar to save money. Instead they might purchase beer at a grocery store and drink it at home or forego drinking entirely. People are less likely to spend money are items that are not considered necessities. The consequences of declined beer consumption affects more than just bars and restaurants. It affects the waiters and waitresses at the bar and the breweries themselves. The waiters make less money and tips, which affects their purchasing power. The breweries may also earn less revenue due to decreased consumption. As a result they may slow down production and produce less beer. This could also have a domino effect on their employees if they no longer need as many workers to sustain the demand on their products. All these consequences also affect tax revenues. The government will not be able to collect as much tax revenues if less product/money is being earned.

26928822890_9a5d12e55e_o


Mosquito Bites: Painful For The Economy as Well

No one likes mosquitoes. They act as irritants and leaches, using individuals and animals to survive. Now, there might be an even greater reason to dislike them; they also hurt the bottom line. Recent studies have indicated a correlation between the incidences of mosquito bites and a straggling economy. The greater number of mosquito bites, the worse shape the economy is in.

The theory behind this concept is exemplified in the great recession. Since real estate was at the forefront of the economic plunge, many individuals lost their homes or failed to maintain them. All of these foreclosures left thousands and thousands of abandoned or ill maintained properties. Without anyone to maintain the homes, and more importantly the pools,  the water turned stagnant in various locations. Combine that with certain humid climates, and these pools became nesting sites for mosquito breeding.

A Green Pool in Las Vegas

For instance, in Maricopa County, Arizona the unattended ponds and pools have become “green pools, according to authorities.” These pools are the ones where water has gone stagnant due to various levels of negligence, a lack of care driven by market forces. In 2009, 4,000 “green” pools were attended to by crews treating the stagnation. By comparison, only two years earlier the number was closer to 2500. This almost 60% jump correlated closely with an area that was hit extremely hard during the recession.

In areas where building was in a boom, many new developments placed pools in the backyards of individual homes. When people could no longer afford to maintain these pools, and for some, even live in the homes, mosquitoes swarmed.

In short, when the economy is bad, and people have to make hard financial choices, giving up pool maintenance is a necessary cut. The more pools across the country that go untreated, the worst shape the economy is in and the more homes mosquitoes find. So, if you hear more buzzing and see more bites, it is not just those small red dots you have to worry about. It could be a sign of great economic struggle on the way.


Cleaning up the mess


Sources:


http://www.theatlantic.com/business/archive/2009/06/the-5-strangest-economic-indicators/19669/

http://www.kiplinger.com/article/business/T019-C000-S001-10-quirky-economic-indicators.html

Unexpected Indicators


And The Gold Medal Goes To… The Economy

rio-image

Every two years a country from anywhere in the world is strategically chosen to host the Olympics. I say strategically because being given the honor to host the Olympics greatly effects a country’s reputation, residents, and, most importantly, its economy. Therefore, to account for this major event, economists at Bespoke Investment Group came up with the Olympic Indicator to measure the state of the economy during this exciting time.

The Olympic Indicator shows that markets tend to prosper during the Olympic games. Bespoke Investment Group explains this by saying that the excitement of the USAs-Simone-Biles-poses-with-her-gold-medal
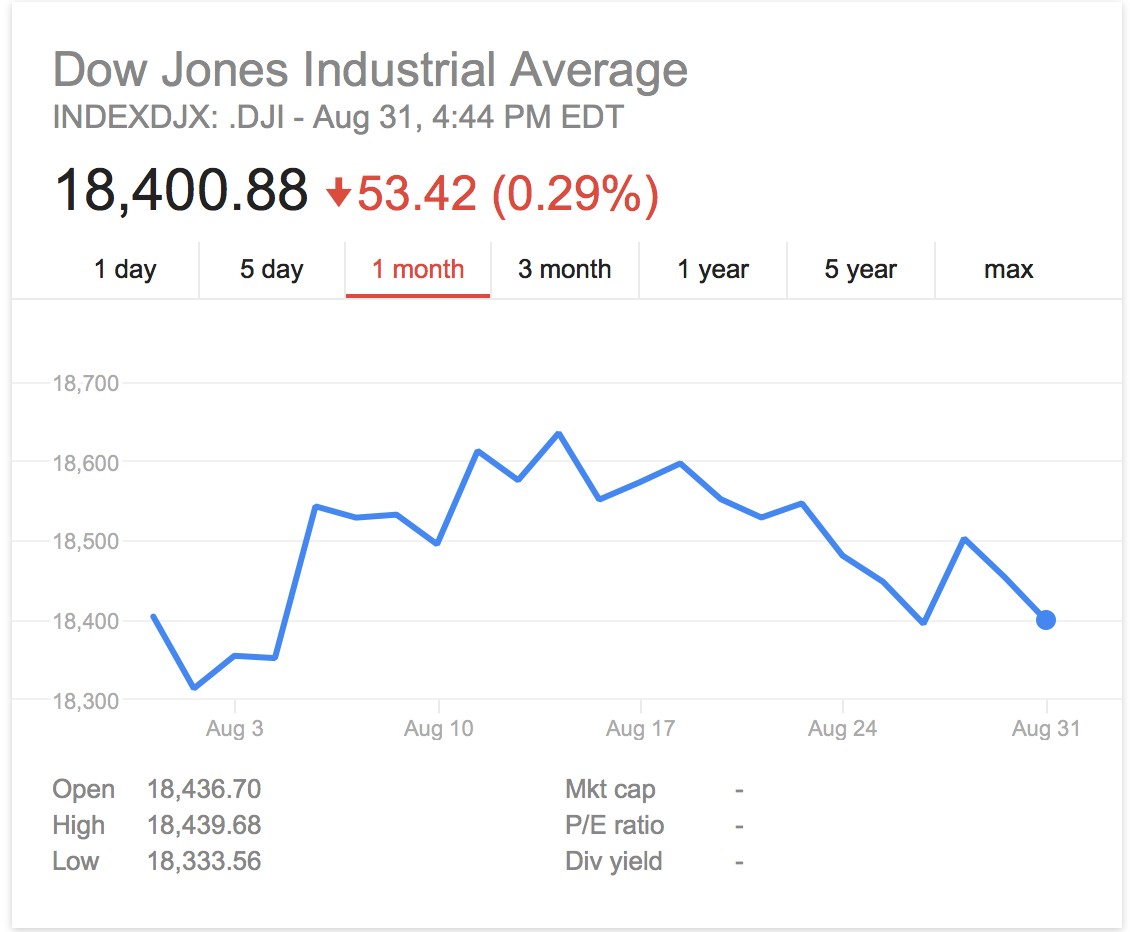
games distracts investors from problematic economic data and headlines. Bespoke confirmed this notion by tracking the Dow Jones performance during the Summer Olympics between the opening and closing ceremonies since 1900. Their results; positive returns in 18 of the last 26 games.

This summer in Rio de Janeiro marked the 31st Summer Olympics. However, ct-zika-virus-olympics-rio-20160128there were a lot of concerns leading up to the games on whether Rio could afford the Olympics, issues with their government and city safety, the presence of the Zika Virus, issues with severe water pollution and if the Olympic buildings were even going to be finished on time.

However, with all these problems, the U.S. economy still seemed to benefit from the games. By looking at the chart below it is evident that the Dow Jones Average spiked from 18.352.05 on August 4 to 18.543.53 on August 5, which was the day of the Opening Ceremonies in Rio. Although the average fluctuated during the Olympics, ever since August 21, the date of the Closing Ceremonies, the average is almost back at where it started on August 4.

Screen Shot 2016-09-01 at 1.30.14 AM

Although the Dow Jones Average shows that the American stock market did improve during the 3 weeks of the Olympics, the Olympic Indicator does not actually prove that the games distract investors. Therefore, the economic growth that occurs during the Olympics can also be explained by looking at the money that is entering markets around the world. For example, NBC Universal paid $1.2 billion for the right to broadcast the Olympics in Rio, which is chump change to Rio’s estimated $12-20 billion they spent on hosting the games. All of this money promotes consumer spending and puts money into the economy that was not there before, which in turn, betters the economy.

Rio-olympics

Sources:

http://www.marketplace.org/2016/08/05/world/let-s-do-numbers-what-has-been-spent-rio-olympics

http://www.usatoday.com/story/sports/olympics/rio-2016/2016/05/12/impeachment-trial-set-rio-olympics/84275984/

http://www.marketplace.org/2016/08/05/world/let-s-do-numbers-what-has-been-spent-rio-olympics


Commiserating Financial Pain: Online Dating as an Economic Indicator

DateTix-01

As people become vulnerable with their pocketbooks, do they become vulnerable to loneliness as well? Statistics from online dating sites demonstrate that tough financial times correlates with higher numbers of people surfing the web for someone to commiserate their pain with.

These findings are supported by various online dating sight’s financial and user data. Match.com’s website traffic and quarterly results reported having the busiest site traffic during 2008’s turbulent financial crisis. They additionally reported their best fourth quarter in seven years during 2008, the same time as the Dow Jones reported a five-year low (HCPLive). This data differs from previous Novembers, which are notorious for being a particularly slow month for online dating sites.

According t0 Perfectmatch CEO Duane Dahl, the turbulent economic period after 9/11 and the end of the dotcom bubble led to a 200 percent membership increase. Dahl credits this hike in numbers to the public’s desire to find comfort in a partner, either to console their financial stresses or solve them. The poll, sponsored by eHarmony, shows that respondents those who said they felt stressed by the current economy were 14 percent more likely to aim to be in a long-term relationship within a year, compared with those who were not stressed by the economy (Time Magazine).

Though there are numerous potential explanations for this phenomena, off site dating experts have contributed them to 1) more time spent online and 2) loneliness heightened by stress. Theoretically, tougher economic times results in people staying home more often. This inevitably results in people spending more time on their computers, clicking away at their potential matches on online dating platforms. At only $35 a month, online dating is cheaper than blind dates as well, making it a more viable option for those on a budget. Whilst the public turns to online dating to find their next relationship, economists can turn to their membership numbers to determine the status of the economy.

Sources:

http://cityroom.blogs.nytimes.com/2009/05/04/how-has-the-recession-affected-your-dating-life/?_r=0

http://www.nytimes.com/2009/02/12/fashion/12dating.html?scp=1&sq=dating%20recession&st=cse

http://www.hcplive.com/physicians-money-digest/investing/bizarre-but-used-economic-indicators#sthash.MvcAoGhx.dpuf

http://content.time.com/time/business/article/0,8599,1868694,00.html


Marine Advertisement Intensity Index

blog 1.2It’s a bad economy. Job searches have not been successful. Young people are running out of options.

What can they do?

Perhaps joining the military is not a bad idea.

This may have been a thinking process for the youth during recession in the U.S.. In 2011, non-profit research organization National Priority Project (NPP) has published a military recruitment research for 2010. According to the NPP research, there was not enough data to prove a correlation between unemployment rate and recruitment rate. However, it does infer how the poor economy may drive youths to think of military as a career option.

According to NPP, the accession rate increased from FY2009 to FY2010, which indicates how more people wanted to join the military. By the FY2011 recruitment period, the US military already fulfilled the whole year’s recruitment demand and the half of FY2012’s recruitment goal. Comparing NPP’s analysis and the U.S. unemployment rate from U.S. Bureau of Labor Statistics, the correlation between the unemployment rate and demand for youth to join the military seems to make more sense. Looking at the unemployment rate trend from the end of 2009 to the beginning of 2011, the unemployment rate fluctuate between 10% and 9%. Considering the recruitment dates starting on September-October period, the unemployed youth may have felt hopelessness on looking for jobs; consecutively, they thought of enlisting.

united-states-unemployment-rate-1948-2016-data-chart-calendar

bizarre-economic-indicators-8-728

As mentioned above, the recruitment goal for FY2011 overfilled the government’s demand. Consecutively, the government would want less recruits on next recruitment period. Of course, there the other factors influencing the military recruitment. For instance, 9/11 incident inspired many young Americans due to the rising patriotism. Yet, the recruitment goals by the year of 2005 supports correlation between unemployment rate and enlisting rate because the goal “had fallen short of its 80,000-person” according to New York Times.

To meet the recruitment goal, the U.S. military needs either inspire or scare to influence the American youth so the recruitment goal is met. There is a myriad ways to influence the public, but Business Insider and New York times theorized how Marine Corps advertisements may be the economic indicator that speaks about the correlation between unemployment rate and enlisting rate.

Business Insider and New York Times suggest that the intensity of Marine recruitment advertisements can be a measure of economy. The general concept goes something like this: when people cannot find suitable jobs due to bad economy, the Marine Corps terrifies the potential recruits with intense imagery in the advertisements because the Marine Corps does not want too many recruits. Though there is no easy to measure the intensity of the advertisements due to its qualitative nature, it is certainly interesting to look at in the light of communication.

Marine Corps The Climb YouTube3

“The Climb”

The proof Business Insider and New York Times provides is the comparison of advertisements after and before the year of 2002. In 2002, the Marine Corps released an advertisement called “The Climb”. The advertisement showcased a man rock-climbing on a cliff. As the man ascends, the imagery of deployment, courageous Marines, American flag, troops helping people in needs, and many patriotic symbols appear on the cliff. At the end of the climbing, the man sees himself in the Marine uniform. The man gets picked up by himself in the uniform and they emerge into a proud Marine with a halo his back. Watching “The Climb”, being a Marine does not seem to be a bad idea. After watching the advertisement, it does not seem to matter how hard the training is because being a Marine looks like the most worthwhile occupation in the world. This advertisement highlights the slogan of Marine Corps “The Few, The Proud” because the advertisement sends powerful imagery to state how every recruit can become a proud Marine after a rigorous training and self-development.

The advertisement on the 2002 definitely seems to attract many recruits. On the year of 2008, however, the advertisement changed the look of military. Preparing the next fiscal year, the Marine Corps released “America’s Few” advertisement. The advertisement starts with young men from different backgrounds. They rally at the same location and the scene shifts to the series of hardcore training the cadets go through. The commercial shows the images of very intense training such as rope climbing, diving into the water with full battle gears , getting exposed to tear gas, training in the mud, getting thrown into the hand to hand combat with no protective gears, war simulations, and rigorous combat practices.

United States Marine Corps America s Few YouTube

“America’s Few”

Towards the end of the commercial, the narrator says that only a few can earn the title of proud Marines. Compare to the 2002 commercial, the advertisement on 2008 highlights how selective the Marine Corps is on picking its candidates. The images of trainees in pain from the training were repeating throughout the commercial. If the 2002 commercial was about the glory of becoming a Marine to attract many candidates, the 2008 commercial was definitely about influencing potential candidates to be hesitant on enlisting. On the year of 2009, the unemployment rate was 9.8% on September. In other words, there may have been a need to reduce the number of candidates to the Marine Corps as the unemployment rate rose; hence, “The Few” was more emphasized in the commercial than “The Proud”.


Of course it is not an accurate measure because the intensity can be subjective; however, the Marine Corps advertisement intensity index certainly has a value of studying. It definitely reflect on how the government communicates with people for the supply and demand. Just as other economic indicators influence how people feel about economy, Marine Corps advertisement intensity index influence how people feel about the government’s demand and supply.