Trump’s Economic Policy: Make America Poor Again


trump

One of the most compelling storylines of the election is whether Republican candidate Donald Trump can make good on his promise to make America’s economy great again. A review of his economic plan shows this is wishful thinking if Trump’s current ideas become American fiscal policy.

The focus of Trump’s plan is growing the American economy by deregulating, shifting trade policy and slashing taxes. In a recent speech at the Economic Club of New York, Trump vowed to cut taxes by a total of $4.4 trillion by lowering the top individual rate to 33% from 39.6% along with raising the standard deduction to close tax loopholes (Reuters). Trump claims his plan would not add to the federal deficit. To help compensate for the tax cuts, he would use a “Penny Plan” that would shrink all government programs outside of defense and entitlement programs by 1% each year (Reuters).

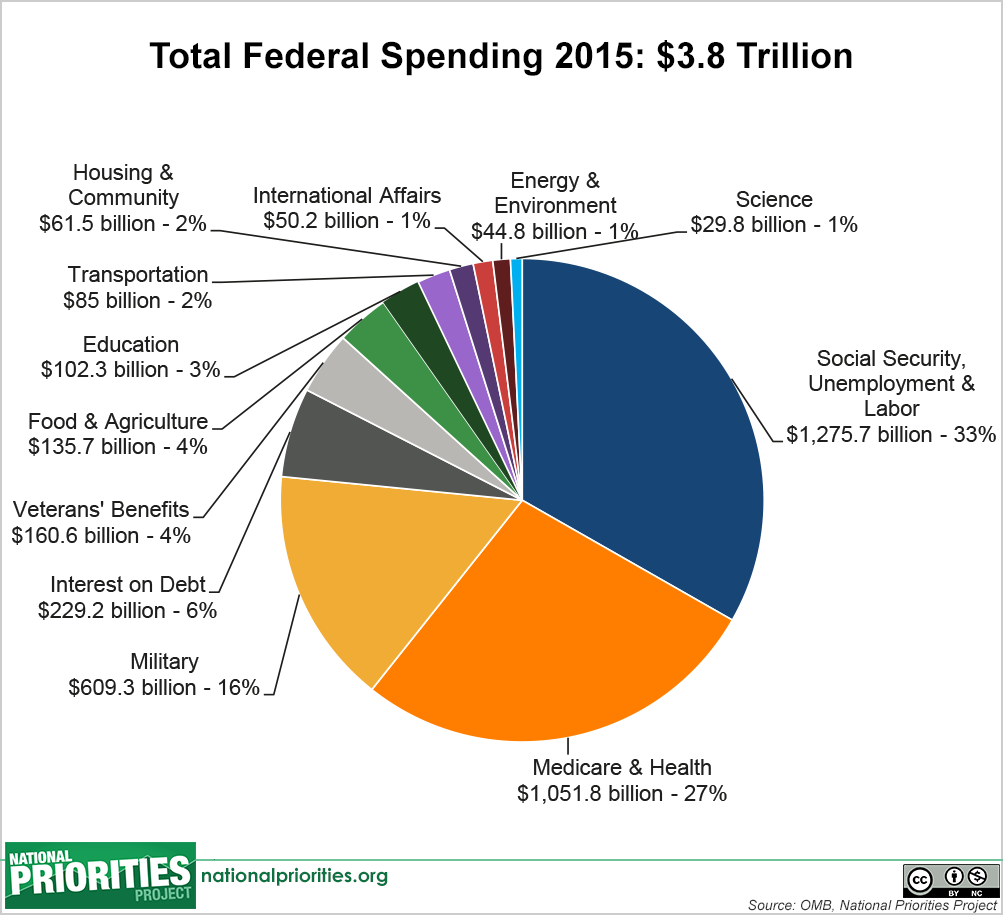
Trump claims the tax cuts would stimulate consumer spending. More realistically, the tax cuts would result in a deficit. The 2015 Fiscal Budget spent about $2.94 trillion of its $3.8 trillion on entitlement and military spending that would not be touchable under Trump’s plan (National Priorities). If 1% of the remaining $860 billion was cut, it would result in a $8.6 billion decrease in spending. This is a fraction of what Trump would need to fund his tax cuts. This means he will either not be able to execute planned government projects, such as his infamous wall, or incur a huge deficit.

pie-chart

From his sweeping immigration reform to his “Americanist” economic policy, Trump’s overall campaign has had an isolationist theme. Combined, they could have a drastic effect on the global economy. Trump plans on making net trade a positive part of the GDP by renegotiating or eliminating trade agreements such as NAFTA and the not-yet ratified Trans Pacific Partnership (CNN Money). This would include high tariffs on major trade partners such as China and Mexico, two of Trump’s favorite bogeymen. Trump promises to make up for lost imports with American products, saying, “We are going to put American steel and aluminum back into the backbone of our country.” (Time)

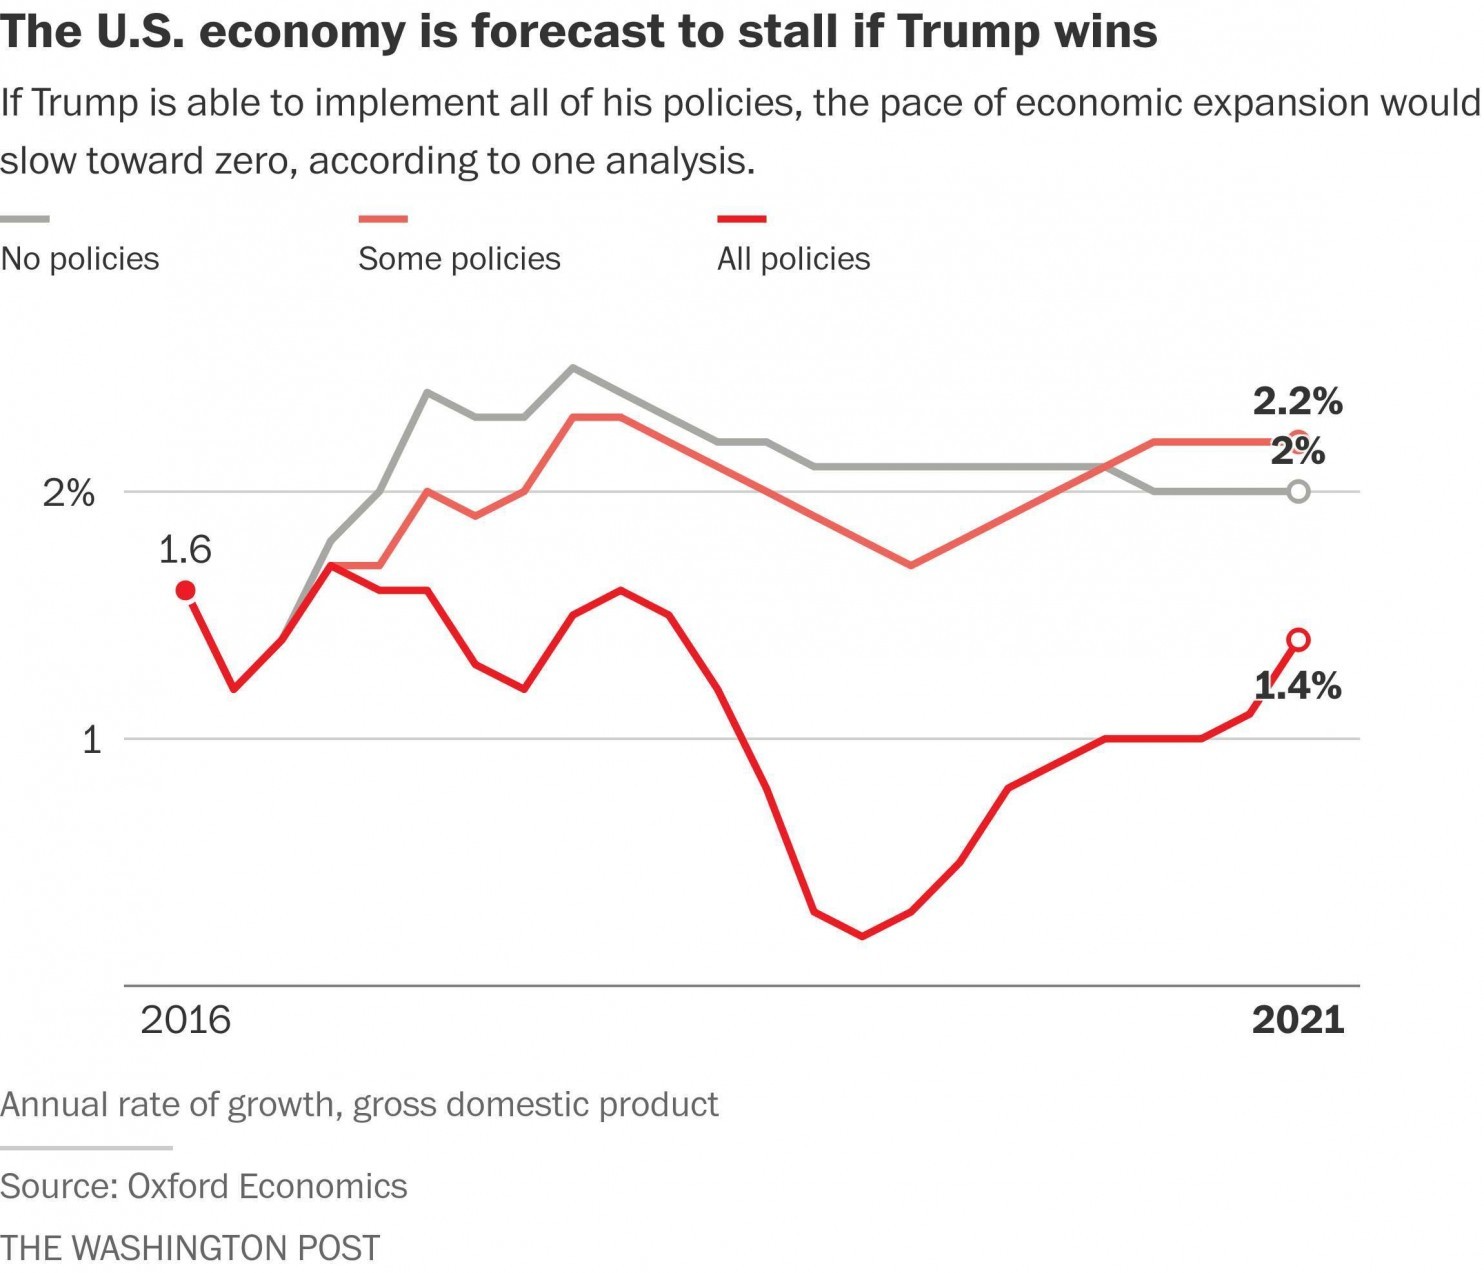
Trump predicts that his economic plan would result in a growth rate of 3.5% and create 25 million American jobs (CNN Money). These figures sound too good to be true, most likely because they are. Analyses by Oxford Economics and The University of Pennsylvania’s Wharton Budget Model estimate Trump’s policies would result in 4 million jobs lost, sharp declines in consumer spending, a global trade war and a total loss of $1 trillion in U.S. GDP by 2021 (CNN Money). His economic advisors have brushed off criticisms of his policies. “One thing we know about economists is that they never get it right,” said Trump economic advisor David Barrack (CNN Money).

In this case, the economists are right. If Donald Trump influences the U.S. economy, America will take a huge leap backwards. Trump’s plans to increase domestic manufacturing are not compatible with today’s global economy. Many of the parts in Mexican and Chinese goods originate in America. For example, Rich Turner and his 2700 worker denim plant in South Carolina would be out of business because they send most of their denim to Mexico to be sewed into jeans (CNN Money). Trade with Mexico and China helps all parties. Donald Trump’s misunderstanding of today’s economy could make America the opposite of great if he is elected.

Works Cited

http://www.reuters.com/article/us-usa-election-trump-economy-idUSKCN11L27G

http://money.cnn.com/2016/09/14/news/economy/donald-trump-economic-plan-1-trillion/

http://time.com/4386335/donald-trump-trade-speech-transcript/

https://www.nationalpriorities.org/budget-basics/federal-budget-101/spending/

Are Group Exercise Classes Causing More Harm Than Good?

For many people, exercise is a part of their everyday routine.  And for others, it is always something that looms over them, as something they should do to improve their health.  Everyone finds themselves thinking “I should work out more,” or “I should really go the gym,” once in a while.

For those fitness fanatics and the casual user trying to get into the habit of exercise, fitness classes are a popular option for motivation and training.  However, they can be very expensive – ranging from $15 to $40 for a single class.

ClassPass is a start-up that offers a subscription-based model for fitness classes in over 20 cities all over the country.  The service offers 5, 10, or unlimited classes per month and the subscriptions range from $50-$200 per month. cdwn11-e1422601940511

Since their launch in 2013, the company has booked over 18 million class reservations and has raised $84 million in funding.

The company has been hailed as the next Uber, as many other companies are using the ClassPass business plan as a model for other types of subscription services, like blowouts.

While this service has become very successful over the past few years, many fitness studio owners have criticized the company for their low payments to the studios and the detraction of business from these boutique studio owners.

Each month, ClassPass pays out an undisclosed sum to their studio partners, depending on how many people booked a class reservation through their system.  Although the exact number is not released by ClassPass, many sources say that ClassPass pays about fifty percent of the retail price.  So, if a class is typically priced at $30, ClassPass will pay only $15 for their customer to attend the same class.

This elastic pricing between customers is what is both the most intriguing and what has caused the most problems in ClassPass’s brief history. card_5_282

Many studio owners feel very contradicted in regards to ClassPass.  On one hand, by using ClassPass, they are filling their classes and receiving revenue that they would have otherwise not been generating.  However, many regular studio goers get fed up with the ClassPass users who are paying a discounted rate and make the classes much more crowded.

So, which is more important?  Having bodies in the room or having loyal customers who are willing to pay the full rate, which for some classes can be up to $40 per class, for the same class?

While many studios have chosen to participate in ClassPass and chose to limit the number of spots and the time of day that the classes are available to ClassPass users, there are some studios that have chosen to forgo the ClassPass option.

For example, SoulCycle, an always popular option especially in Los Angeles, refuses to join ClassPass and instead charges $34 a class.  Their classes are almost always full and people are willing to pay full price.

While the idea is that ClassPass will encourage their users to become loyal followers of a certain fitness class and instead book through them, many stay ClassPass users and bounce around each week from studio to studio.

As ClassPass matures and expands, will the benefits outweigh the costs for studios around the country and will studios continue to use their service?  And, as prices increase for customers, will customers still view the service as a value?

The 20th Century Gold Rush: Real Estate in California

Most Americans know that to live on the coast, either East or West, is generally more expensive than the middle of the country. While admittedly a generalization, this discrepancy is even more pronounced when looking at prime locations like Los Angeles, Manhattan, and San Francisco. The difference is also apparent in other expensive territories like San Diego and Orange County. However, it hasn’t always been this way.

While California generally outpaced the market, the difference became more pronounced in the 1970’s, and since then the schism has grown tremendously. According to the California Legislative Analyst’s office, between 1970 and 1980 California’s prices went from outpacing the market by 30% to 80%. This tremendous jump in just 10 years has been followed up by even more extensive growth. According to the office, “today an average California home costs $440,000, about two–and–a–half times the average national home price ($180,000). Also, California’s average monthly rent is about $1,240, 50 percent higher than the rest of the country ($840 per month).”

These numbers are propped up by a meteoric climb in real estate values in Northern California as the tech boom continues, but the rest of the state also contributes to the sizable difference.

There are a lot of competing theories regarding the reasons for the high prices. For one, demand outpaces supply. While an incredible amount of people want to live in California, the amount of building that is taking place cannot keep pace.

The catalyst is that living on the coast means living in an incredibly desirable location. With geographic and physical limits on how much one can build, people then look to the interior of California. An influx of individuals to the inland, props up prices to higher levels than that of similar terrain makeups in other parts of the country. The proximity to the coast contributes to this significantly.

California’s meteoric rise in a chart

The weather is another contributing factor. Some deem this the Rose Bowl effect, individuals all across the country tune into the Rose Bowl on New Years Day and see sunny Los Angeles poking out from behind the stadium in Pasadena. Compared to relatively dreary surroundings in inclement areas of the United States, California looks even more appealing in the middle of winter. Studies on this phenomenon lack, and it might be more anecdotal and urban legend than statistically valid, but it encapsulates the feeling regarding California.

The lore is further built up by Hollywood and the movie and music industry as well as Northern California’s incredible technology hub. All of these features are added perks of living in California and such traits help drive up prices and demand. No one individual factor may be the reason, but combining beachfront property and years of reverence for “California Dreamin,” seems to be a potent recipe for sky high prices.

This begs the question if California real estate will ever fall back to earth. By simple supply and demand, it doesn’t seem to be the case. Of course, individuals’ tastes and preferences may always change, but it doesn’t seem that this type of house will go out of style anytime soon.

What Would Trump’s Presidency Cost the U.S. Economy?

Donald Trump says that his economic vision is that “all economic policy must be geared towards making it easier to hire, invest, build, grow and produce in America – creating a level playing field for our workers and businesses in global competition, and creating jobs here, not overseas.” He puts this into five categories, very briefly summarized below:

  1. Tax reform- lowering taxes for everyone
  2. Regulatory reform- repeal many business regulations and pause any new regulations
  3. Trade reform- narrow the U.S. trade deficit and place high tariffs “to countries that cheat”
  4. Energy reform- lift restrictions on American energy
  5. Other reforms- repeal Obamacare, increase infrastructure, childcare, reduce homicides

According to a recent report by Oxford Economics, if all of Trump’s proposed policies are implemented, it could erase as much as $1 trillion off of the forecasted U.S. economy in 2021. After two years of his policies, economic growth would slow to about 0.3 percent annually. That would be the worst pace since the recession ended.

economic-forecast

Trump’s trade reform policy includes imposing tariffs on goods from China and Mexico. Additionally he wants to remove large numbers of undocumented immigrants from the United States. By imposing high tariffs on Chinese and Mexican goods, it could also have large impacts on other countries. Jamie Thompson, head of macro scenarios at Oxford Economics, argues that Trump could likely hurt the workers that he says he is going to help in the manufacturing sector. A 35% tariff on Mexican goods, like cars and air conditioners, would negatively impact the American economy because almost half of the parts in those cars and air conditioners come from U.S. suppliers. Therefore, U.S. manufacturers could lose customers if the U.S. imposes a tariff on the Mexican products that they contribute to.

Similar stories came from denim manufacturers in South Carolina. They send a significant amount of denim to Mexico to be manufactured into jeans that are then sold in America. NAFTA, which Trump wants to renegotiate, is critical to keeping these types of manufacturers in business. These manufacturers are also large employers. The denim plant, run by Rich Turner, in South Carolina alone employs 2,700 people. Oxford Economics forecasts consumer spending to decline by 4.4% over four years in Trump’s plans are initiated. Even the price of groceries, a basic necessity for all Americans, rich or poor, would increase with tariffs placed on other countries goods.

In addition to Trump’s specific economic policies that could slow or even reverse economic growth, the mere shock of him winning the presidency would affect confidence in the United States worldwide. Confidence and communication about the economy have a huge influence. Even countries and businesses that are not directly impacted by Trump’s policies would react. Weakened confidence in the U.S. economy “would most likely result in the scaling back of business investment plans, accompanied by the postponement of major household purchases,” according to Oxford economists. A Trump victory would likely result in economic turbulence that would be felt worldwide.


Sources:

https://www.donaldjtrump.com/positions/economic-vision

http://money.cnn.com/2016/09/14/news/economy/donald-trump-economic-plan-1-trillion/

http://www.cnbc.com/2016/09/14/us-economy-could-lose-up-to-5-pct-if-donald-trump-beats-hillary-clinton-in-presidential-election.html

https://www.washingtonpost.com/news/wonk/wp/2016/09/16/what-a-donald-trump-presidency-would-do-to-the-global-economy/


Millennials, The Renter Generation

Millennials are the largest generation in America’s history with over 92 million people and coined as the “renter generation.” With this influx of people, more Millennials are staying home and if they leave, they are renting not buying houses. So what components make up the Millennial generation and what does this mean for the housing market?

Let’s break down the Millennials and see what makes them stay home longer and why. From 2005 to 2010 there has been a three percent increase in Millennials living at home. Some of them graduated during the recession and the housing crash and their perspectives have shifted. Pew Research cites that they are more burdened with student debt than any other generation but are excited about their financial futures. They want to be mobile, save money and start the large life decisions at a later age than previous generations. For example, Millennials are waiting to get married. The median marriage age was 30 in 2010. Often times, this means that buying a house and starting a family is also a priority later in life. However, buying a house isn’t the only thing Millennials are putting off.

millennials-at-home

Image from Goldman Sachs

Car ownership and purchasing high-ticket luxury goods have also slowed. With the enhancements of technology such as Uber and rideshare programs, there is less of a need to buy cars. Millennials believe that if they can rent something or use a service, they can save more money.

Sharing not owning is the tagline for this generation. Over 60 percent of all Millennials are interested in renting over owning—this applies to all goods and services from clothing, music and homes. This type of “sharing economy” has caused companies like Rent the Runway, Spotify and Airbnb to rise to success. Seen as yet another opportunity to save, renting is clearly the answer for everything for this generation. Not only does it give them an opportunity to try new things, but they are also not tied to those items and have more freedom in the future. This is the key to why they rent— it allows for more mobility.

With all the new technology in place, mounting student debt and a need for freedom, it’s no wonder the housing market is seeing a loss. According to a new report, home ownership has fallen since the financial crisis in 2009 with a huge drop in the Millennial generation alone. Homeownership has drastically dropped since 2004. More recently, CNBC stated that home ownership rates for Americans under 35 have dropped from 39 percent in 2010 to 34.1 percent in 2016. This could be bleak for the future of housing because peak home buying years are 25 to 45-years-old. However, the mere size of the generation and aspirations to settle down at a later date could mean a delay in the surge of housing.

cnbc-millennials

Image from CNBC

Many wonder if Millennials are a renter generation, will they ever buy a house? Right now, it’s unclear. According to a study by Trulia, 93 percent of Millennials are interested in purchasing a home some day. With a premium on freedom, they want to live in trendy cities where home are often out of reach financially. So where do we go from here? Financial institutions need to work with Millennials and engage them in the importance of saving money. Banks also need to talk about the importance of credit and work to make mortgages more accessible to younger borrowers who might have a smaller credit history. Hopefully one day they will invest in a home but for right now, the number of Millennials will only rise.

future-home-millennials

Image from Goldman Sachs

Ants in The Prosperous Era

Last week, an article titled “Ants in The Prosperous Era” went viral on WeChat and Microblog, China’s most popular social platforms. All of a sudden, we all know that a woman named Gailan Yang killed her four young children behind her small, mud-brick house in a poor northwestern Chinese village in Gansu Province with an ax and the woman drank pesticide to kill herself later. Gailan’s husband who earned a life hardly outside the village with no more than $20 a day of income committed suicide after learning what happened.

1  2

      (Gailan’s bedroom)


Over half of the population is under the poverty line in the village where Gailan struggled to live since she got married at the age of 19. According to the article, qualified as exceptionally poor, Gailan spent her days working in the fields “hopelessly.” Gailan took care of her four children in this 10-square-meter wind-blown dangerous house. What’s worse, all of her four children could not be registered with a “Hukou,” official residential permit in China, which means the children could not enjoy the country’s social welfare benefit.

“If there’s no incident like Gailan Yang killing her whole family, who would believe that these disadvantaged people and groups still exist in this prosperous era?” questioned the author, a well-known commentator.

As the world’s second-largest economy, China is among the world’s worst in income inequality. The country’s poverty rate dropped from 88 percent in 1981 to 11 percent in 2014, according to the World Bank.

3

Yet more than 70 million people in China still live below the poverty line, according to the National Bureau of Statistics, and income inequality is becoming larger and larger. The richest 1 percent of China’s households own a third of the country’s wealth, according to a recent report by Peking University. The poorest 25 percent of Chinese households own just 1 percent of the country’s total wealth, the study found.

4

Gini coefficient is a widely acknowledged measure of inequality that takes into account income distribution among residents of a country. The higher the Gini coefficient, the greater the inequality is. 40 or 0.4 is the warning level set by the United Nations. As it shown in the graph, China’s Gini coefficient rose to 49 in 2009, from 32 in 1990(the number varies among official statistics and organizational statistics). According to China’s official statement, China has made a great progress in combating inequality, making the lowest number of Gini Index in 2015. However, the number is still expected to be larger in reality.

5

Among Asian countries, China has ranked the first in earning Gini points speedily according to IMF. This May, IMF warns of growing inequality in India and China. IMF points to the problem with redistribution of incomes as high growth rates are not reducing inequality.

6

“When a person commits a crime for bread, then society is to blame,” one user wrote on Weibo, China’s version of Twitter. Although it’s discriminating to call people ants in the article, the family killing does shock the whole China’s society and raise an alarm to the abnormal economic development in current China.

Economics and the airline industry

The airline industry is tied to the economy in virtually every single way. It is influenced by people’s disposable income, leisure time, business travel, etc. When people have more disposable income, it allows them to be more flexible in traveling. Furthermore they are more inclined to spend money when they arrive at their destinations. Travel is increased by business. As the economy is increasingly global, it requires more travel between countries. As a result, companies must send their employees across the globe. This creates a benefit on all ends because the airlines benefit from increased travel, while the economy is benefited because of increasing business. According to Airlines for America, the airline business creates $1.5 trillion of economic activity in the United States and supports upwards of 11 million jobs. The number of flights and flight prices are also affected by season meaning there are peaks seasons of travel such as spring break, Christmas, and summer. When the economy is good, airlines flourish raking in more profits and as a result they can increase their investments and give good returns to their shareholders. Another factors that influences air fare is oil prices. One of the largest costs an airline has is the cost of fuel. However they have to be strategic in the way they change their prices because of the competition they face with other airlines. If they increase their prices too much they can put themselves at a disadvantage because other airlines may be more conservative with their price jumps. At the same time, airlines need to be conscious of their profit margins and ensuring that they are making enough profit after they deduct the overhead costs involved such as employee wages and benefits, air plane maintenance, and airline space.

The Skyscraper Curse: An economic indicator?

Could it be true that the taller the skyscraper the harder the fall? The correlation between completions of tall skyscraper buildings and economic is a fairly familiar concept. The Skyscraper Index was created by Andrew Lawrence in 1999 and explained that constructions of tall skyscrapers were representative of beginning of economic downturns. This trend of correlation between the construction of tall skyscrapers and economic business cycles that ended in recession was first studied in the 1930s, which was around the time of the Great Depression in the United States.

Historical examples of this phenomenon from the past century include the completion of the Empire State Building in the 1931 when the Great Depression had just started, the completion of the Petronas Twin Towers in Malaysia in 1996, which was when the Asian financial crisis began, and of course, the completion of the Burj Khalifa in Dubai in 2010 which was right after the 2008 worldwide financial crisis. Another key example would be the construction of the Sears Towers and the World Trade Center Towers that were built in 1973, during both the 1973 stock market crash and the 1973 oil crisis. Andrew Lawrence hence argued that almost all major skyscraper construction initiatives were pre-cursors to financial busts. The theory suggested that the building of skyscrapers generally started during the later phase or the peak of the economic boom when employment is usually high and the economy is growing, which is followed by economic downturns and low unemployment rates. So even though all economies go through business cycles, skyscrapers especially tend to be constructed in the last or peak phase of an economic boom and finish in a recession.

The skyscraper index might not seem legitimate and it could be possible that the aforementioned examples could be coincidences, because correlation does not always mean causation: and one may think why would impactful structures like skyscrapers that could be highly profitable be destructive to the economy? However, the Barclays Skyscraper Index Report shows that not only is there correlation between the construction of tall buildings and recession, the report also proposes that the rate of increase in the height of the skyscraper could indicate the extent of the financial crisis. The report tracks the building of new skyscrapers and their increase in height in comparison to the following recession that occurred from 1873-1878 until 2007-2010. There seems to be a trend in the study that the rate of increase in record-breaking skyscrapers is directly related to the magnitude of the economic downturn that occurred after.

chart-skyscraper-booms-vs-economic-crises-jan-11-2012

Nevertheless, there have been some recessions that occurred in the past century that were not preceded by the construction of a tall skyscraper. For example the skyscraper index failed to predict economic downturn in Japan, which had a recession in 1990, and it also did not provide any indication of the economic recessions of 1920-1921, 1937-1938, and 1980-1981. An economist Mark Thorton commented, “both the causes of skyscrapers reaching new heights and severe business cycles are related to instability in debt financing”. Of course, economic indicator can predict perfectly, but the skyscraper index could be a basis to predicting some form of crisis rather than specifically speculating the severity of economic business cycles. It would be interesting to see what this could mean for the world’s fastest growing economies, India and China, which have multiple large scale skyscraper projects lined up for construction within the next few years.


Playing ‘Footsie’ with the Economy

As Coco Chanel once said, the number one rule for a lady is to “keep your heels, head, and standards high.”

…. but which ‘standard’ was she talking about?

Photo of a 1kg gold bar isolated on a white background with clipping path

Using fashion trends as economic indicators is not a new concept. In fact, economists have been using them in conjunction with the ‘retail sales index’ for many years. It began in the 1920s with George Taylor’s hemline theory, as he speculated that women wore shorter skirts as way to show confidence during strong economic periods. The trend then transitioned to lipsticks, when after 9/11 Estee Lauder suggested that the sharp increase in their sales was a direct response from women who were using impulse spending as a way to cope and grieve. More recently, however, economists have been using the “high heel index” as a way to measure consumers confidence in the economy.

While measuring the height of a heel may seem ridiculous, a recent recent study by IBM suggests that there is a strong correlation between the height of one’s shoe and the success of the economy. Their report comes as a result of an in-depth social media analysis, where researchers tracked trends and posts about shoes across the internet to understand what types of heels women were wearing and how high they were.


6351154517_74baa80950_b

According to the report, heel heights have traditionally increased during harsh economic times, as fashion is used as a form of escapism and expression. However, more recent data indicates that this trend may be “last season”. In 2009, shoe manufacturers and retailers were reporting that they were selling more lower height heels and flats in their store. Since this was still during the recession, IBM analysts theorized that there must be a shift taking place with consumers. By wearing lower heels, were women saying that no longer felt the need to be showy or ostentatious? Or were they just trying to be more comfortable on their walk to work?

Although there is no perfect answer or way to measure the index, it is clear that economists can gain tremendous insight about our economy and consumer confidence by looking at even the most commonplace things.


The Floral Industry- In Sync with the Economy

1s1a0535-2-1200x1200-1

When thinking about the economy and the spending habits of Americans, the floral industry came to my mind because it is a product that Americans shift from feeling obligated to buy (for holidays, special occasions like weddings or funerals) or buy on a whim, and this interested me. Gifting a bouquet of flowers may just seem like a kind gesture, but the state of the floral industry can be an economic indicator.

Although the floral industry is a growing industry now (its total retail sales in the U.S. in 2015 was $31.3 billion, it’s highest sales yet) it’s growth and movement typically mirrors the economy. From this list of floral sales over the years, it is revealed that when the recession hit, the sales fell by $1.4 billion. Since the recession, the floral industry has been able to recover and grow by $2.4 billion in sales. This is $1.3 billion more than the industry’s previous peak in sales before the recession.

screen-shot-2016-09-13-at-9-30-06-am

From my research, I have found that the floral industry’s state moves alongside the economy’s state, or in other words, the floral industry is in correlation with the U.S. economy. As U.S. consumer spending increases overall, floral sales increase. The average U.S. consumer spending monthly average in September in 2008 before the stock market crashed and the recession began, was $97. From then on after that number fell down to being in the $60-$70 from 2009-2012. Now in 2016, that consumer spending is back to an average of $90 a month. An interesting finding though is that the floral sales biggest time of growth in 2012 was much more extreme than the growth of consumer spending, and the sales have continued at this rate. The alignment of U.S. consumption and floral sales yearly are further depicted in the charts attached.

screen-shot-2016-09-15-at-8-55-05-amscreen-shot-2016-09-15-at-8-55-24-amscreen-shot-2016-09-15-at-9-05-18-am

feb6_nrfflowers

Average Holiday Expenditure on Flowers in the United States from 2004 to 2015 in U.S. Dollars

Average Holiday Expenditure on Flowers in the United States from 2004 to 2015 in U.S. Dollars

When consumers have more money Buying flowers to give to someone as a thoughtful gesture or buying flowers for yourself to enjoy can be thought of as being frivolous, this is because the flowers are bound to die shortly after purchasing and are just to be looked at. to spend, and they already typically purchase flowers, they will buy fancier and more expensive flowers. When the floral industry is doing well the economy is as well. But, you can also tell that Americans have less readily available money when they stop spending on floral gifts for loved ones. If floral sales during one of the big bouquet gifting holidays, such as Valentine’s Day or Mother’s Day, isn’t at a similar rate to previous years, this can show that the economy isn’t doing well. This is because people do not have the money to spend on flowers on days that they traditionally buy flowers on. Or those sales can be down because people are buying less expensive flowers than they typically would when the economy is well. The types of flowers being bought and the amount of flowers being bought by consumers can show the economy’s state of being. This makes sense for the floral industry especially since it is a luxury business; people will not buy luxury goods when they think they need to save money or are not financially comfortable.

An interesting note about the floral industry is that demand for flowers has not changed much over time even when the industry has gone through many changes, besides during times of economic instability. The floral industry shifted when America went from an agricultural society to an industrial society. The farming of flowers in the floral market shifted from being grown in the United States to being grown elsewhere and are now imported. Even more recently, the floral industry for the producer took a toll when the 1991 Andean Trade Preference Act was enacted. This act was to motivate South American countries from being involved in drug trafficking to being a part of legal industries, such as growing flowers. This continued to take away from the dwindling amount of flower farms in the U.S. because it has made it more difficult for them to compete with the prices of the South American-grown flowers; now 70% of retail flowers in the U.S. are grown in Colombia. Even local flower farms and retailers have attempted to start movements for consumers to buy locally grown flowers but it has not picked up and the amount of floral imports for American floral companies and retailers has remained.

Like the stable demand for florals, predictions of the floral industry in the future includes the continued growth of the industry due to the shift from Baby Boomers’s spending habits on florals and luxury good to the Millennial’s spending habits for on these goods. From the Retail Feedback Group survey in September 2015, Baby Boomers are more likely than other generations to purchase flowers once a week or every two weeks whereas Millennials buy flowers less often and spend more. As Millennials continue to grow up they will be spending more on florals for events such as weddings, parties, work events and funerals than any generation has before. These occasions are better business for the flower industry, and they will increase alongside the economy’s continued recovery from the recession, since the amount of these events decreased during that time. If the floral industry’s correlation with the economy continues as it has been and if this prediction is correct, the economy can be predicted to grow as well.


https://safnow.org/floral-industry-members-look-ahead-to-2016-with-some-hesitation/

http://www.pma.com/content/articles/2015/11/floral-consumer-trends

https://smartasset.com/insights/the-economics-of-flowers

http://www.aboutflowers.com/about-the-flower-industry/industry-overview.html

http://superfloralretailing.com/january2010/StateIndustry.html

http://www.bls.gov/oes/current/oes271023.htm

https://safnow.org/new-study-provides-insights-three-generations-flower-buyers/