The Curse of the New HQ

And then he said…”we’re moving!”

In America, the taller the skyscraper, the more successful you are. As companies blossom, it is not unusual for CEO’s to announce moving on to bigger and better things. However, the fate of these companies is often destroyed by the terrifying curse that haunts those with lofty goals of a shiny new building.

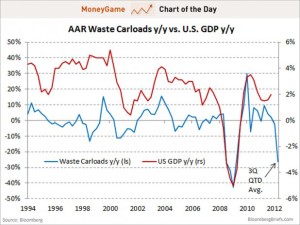
Economic indicators are all around us. Unemployment, GDP, and CPI are the ones that grab our attention but because our economy is so massive, it is easy to miss the little signs here and there. So why would moving to new headquarters be problematic when business has never been better? In many of these cases, the company did not properly attempt to look into the future and consider what could go wrong. Nonetheless, for some of these companies, they never could have predicted bleeding money for years after the fact.

2007DS67.428

Back in 2000, The New York Times doubted the strength of the internet. Although it was clear as day that the world would never be able to turn its back from the internet, what wasn’t clear was the fact that more accessible news lead to lower print sales. By 2007 they should have figured it out but alas, they still moved into shiny new building which led to an extremely uncomfortable financial situation. Let’s just say the accountants went gray real quick trying to crunch those numbers. The only solution was to sell the building and hope for the best.

MySpace? What’s that? Oh right that social media site that got destroyed by Facebook. Thanks Zuckerberg. In 2008, MySpace naively believed they would continue to dominate. Naturally an upgrade was necessary to house the increasing amount of employees. Of course, MySpace declined quickly after moving to new HQ, and today MySpace is owned by Time Inc. It technically still exists but as an entertainment site for music and videos rather than social media.

In these cases, perhaps the outcome of losing money could have been foreseen. However, one must remember the economy is its own animal. The ebb and flow of the market cannot be controlled as much as we like. In business, risk is unavoidable and therefore moving to new HQ isn’t the worst idea. The issue is timing. The curse will remain for all those eager CEO’s trying to jump ship because it is an enormous risk to take. Only the lucky few will go on unscathed, all we can do is watch preferably with popcorn and economic outlook sheets in hand.

http://www.businessinsider.com/poorly-timed-headquarters-2009-11?op=1/#space-3

The Happier, The Better

Since the early 2000s, several scientists have found that happiness can be used to predict the likelihood of developing coronary heart disease or even the strength of one’s immune system. Similarly, economists are finding happiness to be an effective indicator of the health of a country’s economy.

Based in its rich Buddhist heritage that stresses the accumulation of happiness over material goods, Bhutan was the first country to measure its economic might and societal wellbeing using the Gross National Happiness (GNH) instead of its more conventional cousin the Gross Domestic Product (GDP) in 1972.

A country’s GNH is a numeric value assigned based on nine categories: time use, living standards, good governance, psychological well-being, community vitality, culture, health, education, and ecology. The general of level of happiness in a population can indicate a high level of confidence in the economy which in turn increases consumer spending, a hallmark of a thriving financial system.

There is debate over what levels of happiness mean for economics and business cycles. Some economists claim that higher GNH indicates a stronger economy while others argue the exact opposite. The graph above indicates a decrease in happiness as growth begins to pick up, a trend that may be explained by greed. Perhaps as people become more successful, they develop an insatiable appetite for more wealth.

However, Gallup polling in over 150 countries from 2007 to 2013 found that as national happiness decreased and national suffering increased, nations become more unstable which decreases investor confidence sending shockwaves through the economy. The graph below demonstrates wealthier countries, generally nations with stronger economies, are more likely to be satisfied than their less wealthy counterparts. Similar to how high levels of dissatisfaction leads to instability, high levels of satisfaction can be seen as a reaction to and help perpetuate stability in markets by encouraging investors to invest and consumers to spend.

The Gross National Happiness is by no means a flawless indicator of economic strength. More than anything, it shifts national focus away from numbers to potentially more worthwhile and feasible gains. As we deplete natural resources at an ever-growing rate, focusing on achieving goals that emphasize positive emotions over material goods – especially when considering near stagnant economic growth in many industrialized nations – might be worth taking seriously.


Dumpster Diving for an Economic Indicator

You have probably heard the old saying, “One man’s trash is another man’s treasure,” more times than you can count. When I hear it, I think of uncovering some gem at a garage sale or, as my roommates in New York once did, finding perfectly usable bunk beds stacked on the curbside trash pile. But, would you ever consider using trash as a tool to measure the strength of an economy?

Economic indicators consist of wildly varying selection of measures, but one of the most well known measures is a nation’s GDP or Gross Domestic Product. The GDP measures the size of a nation’s economy. One major component of GDP is how much stuff people consume. Organizations track this by keeping tabs on the sales numbers for basic items such as clothes and food, and all the way up to large ticket purchases such as homes and cars.

The US definitely loves buying stuff. Consumption made up about 68% of the American GDP in 2014, according to the World Bank, which makes it by far the strongest and heaviest member of America’s economic family. And what’s the natural by product of our America’s insatiable appetite for stuff? Well, that would be waste. This leaves us with an obvious question: can we look at the amount of waste we produce to learn how our economy is performing?

Screen Shot 2016-08-31 at 11.02.36 AM

Back in 2010, Bloomberg economists Michael McDonough and Bob Willis investigated that very question. No, they didn’t go around weighing garbage bags or following trash trucks. Instead, they measured how many train cars of trash traversed around the country. The American Association of Railroads tracks figures on the amount of steel and iron waste created, as well as municipal waste that cities, such as New York and Seattle, throw on trains headed out to landfills in other states.

They learned that by looking at these numbers one could determine growth or shrinkage of the economy. Bloomberg studied a period beginning in the first quarter of 2001 until the same period in 2010, and found that the number of cars carrying waste had a correlation of .82 with the growth of GDP, meaning that they grew in a nearly synchronized manner. Makes sense right? The more things created and consumed, means more things that are replaced, go bad or end up as leftovers in the process.

This chart, from Bloomberg in 2012, illustrates the strong relationship between our trash and our GDP dating all the way back to 1994:

Screen Shot 2016-08-30 at 9.19.05 PM

In a 2012 interview with Market Place’s Kai Ryssdall, McDonough described why measuring waste gives such insight into the growth of the economy. He said, “It’s holistic because it’s not isolated to a single part of the economy. It’s people throwing things out, it’s buildings being demolished — it’s everything… I mean, if you’re going to build a new building, there might be a building that’s already there. If you buy a couch, you might be throwing out an old couch. If you go out to McDonald’s and you buy something, you’re going to throw something out. ”

Screen Shot 2016-08-30 at 9.19.15 PM

The only problem with this measure is that looking at waste will not tell you much about the future, but instead about what’s already happened. As waste comes about as the end product of consumer decisions. Even McDonough admits, “it’s more of a lagging indicator.” Though the AAR’s figures do become available before the BEA can calculate our GDP. So a slight advantage does exist for the particularly ardent trawler of trash stats.

Sadly though, it appears that anyone hoping to amass a fortune from tracking trash probably won’t uncover too much treasure.


Dating: An Economic Indicator

Screen Shot 2016-08-31 at 9.16.47 PM

Economists use certain indicators to measure the health of our economy. Some classic examples include gross domestic product, employment rate, and housing starts; however, something as emotional and personal as dating can also provide some surprisingly telling information about our economy.

People date because they are looking for their illusory “one.” This could be someone they will lean on in any situation, including times of economic unrest. In fact, Match.com saw a spike in their service usage during the last quarter of 2008, which was right in the midst of the Great Recession.

Screen Shot 2016-08-31 at 9.19.05 PM

This could be explained by a number of factors, especially in the world of online dating. During recessions, people tend to have more time on their hands because they are working less, so they are more willing to invest time in finding love. Online dating also provides a way for people to filter out any possible duds before having to put in the effort of going out to meet them for a possibly unpleasant date. Singles are also likely to crave the comfort and stability of a relationship especially during hard times, so a recession could likely motivate them to begin their search for a mate. Having someone to relate to can absolutely take the stress off.


There are also some practical reasons that people want to have a partner. For many people, dating is an easy way to get a free meal or find new and interesting activities to participate in. Dating gets people outside of the house, and it is a nice distraction from what is happening at home or at work. Later on in the relationship, the couple can begin to share the unsexy necessity of paying the bills. Sharing expenses in the household is much more cost efficient than having to pay for everything yourself.

The financial benefits of having a spouse, like qualifying for certain tax deductions or saving on health insurance, are also some great perks to getting hitched. This is all way down the line though. What is important is that in order to reap all these benefits, people must first begin by simply dating and finding someone who can serve as their partner in crime in life.

Screen Shot 2016-08-31 at 9.19.59 PM

It may not seem like it, but a recession might actually be the perfect time to find a partner because it may be easier to sift through those who are just after your money rather than your heart. Dating can become more about the actual person instead of a game in which one tries to impress the other with the expensive material objects or fancy meals. This can take the pressure off planning extravagant dates so the couple can appreciate simple pleasures like taking a walk or having a picnic.

Most people have an inherent desire to find love, and as bizarre but also expected as it might seem, this want gets pushed to the forefront in times of hardship. If dating can increase overall happiness, then I absolutely say go for it!

The Garbage Indicator


CANTERBURY, UNITED KINGDOM - AUGUST 23: A truck empties its load of waste at the Shelford Landfill, Recycling & Composting Centre on August 23, 2007 near Canterbury, England. The Shelford landfill site, run by Viridor Waste Management, receives 200 truck loads of waste weighing 2100 metric tonnes a day. (Photo by Peter Macdiarmid/Getty Images)

Garbage is an unlikely economic indicator that actually has an 82% correlation to US economic growth, according to economists Michael McDonough and Carl Riccadonna. It is very intuitive because in times of economic well being, consumers buy more and as a result throw more away. If you buy a new TV you will throw out an old one, or if you go out to dinner you will throw away food you have at home and leftovers from your meal out. The more excess money people have, the more they buy, and are more careless about what they throw away.

Waste comes in many different forms. Michael McDonough states, “That’s what’s great about this indicator. It’s holistic because it’s not isolated to a single part of the economy. It’s people throwing things out, it’s buildings being demolished — it’s everything.” Almost half of the trash indicator is steel and iron waste, and the next biggest component is demolition and municipal waste.

In good economic times there is also an increase in waste from commercial and residential construction. With a lot of construction, there is also a lot of material added to waste. The data comes from the American Association of Railroads on a weekly basis, which means that it is very up to date. Garbage is therefore not a leading indicator, but can likely be classified as a coincident indicator or a slightly lagging indicator. In order to collect the data people must have already bought things and thrown them away.

The holidays are a time when we can especially see the correlation between garbage and the economy. In times of economic well-being, people will buy a lot- gifts, food, decorations, etc. This all turns into trash after the holidays and the trash bins will be overflowing. In a time of recession, people are much more conservative about what they are purchasing, especially around the holidays. Fewer gifts, less extravagance, and therefore less trash.

Garbage may seem very commonplace, yet it is a very relevant indicator that shouldn’t be overlooked. In the chart below we can see the very close correlation between GDP and AAR Waste Carloads from 1994 to 2012.

chart-of-the-day-us-garbage-indicator-july-2012


Sources:

http://www.recyclereminders.com/blog/trash-economic-prosperity/

http://www.marketplace.org/2012/08/16/economy/tracking-economy-and-gdp-through-trash

http://www.businessinsider.com/chart-of-the-day-the-us-garbage-indicator-economy-2012-7

Jobless Claims: A True Indicator?

For many people in the United States, the unemployment numbers that are used to measure the strength of the economy are imperative to their confidence in the economy.

But really, how strong is the US economy right now?

While most people in the United States today believe that the economy is growing just from popular knowledge and news in the media, there are many people, including market analysts and economists, who use certain economic indicators, like the jobless claims indicator to measure the true strength and current climate of the current economy.

This economic indicator, known as Jobless Claims, reports the number of individuals in the United States that newly filed for unemployment insurance that month.  This can help investors, and every day citizens shape a perspective and determine how they perceive the current state of the United States economy.

This data is also seasonally adjusted, in order to account for seasonal hirings and firings during certain times of the year, like before the holiday season in November.Screen Shot 2016-08-31 at 8.35.43 PM

Most economists believe that the four-week moving average is a more accurate number to gauge the economy, as the week-to-week number is volatile due to immediate changes in the economy or country.

According to the report published on August 25 by the United States Department of Labor, the level of jobless claims is at a historically low level, as there are currently low levels of layoffs and many people are not filing for unemployment insurance.

As released in the last report, 261,000 people filed in the past week lowering the level by about 1,000 claims overall.

Economic anScreen Shot 2016-08-31 at 8.31.04 PM
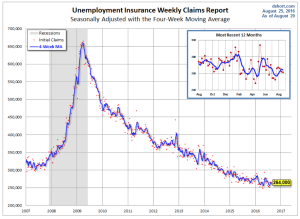
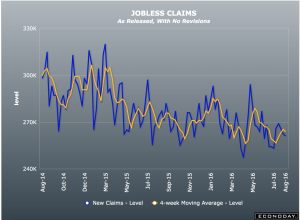
alysts believe that the jobless claims numbers will continue to remain similar throughout the next few months, as the economy continues to grow and the labor market improves.

While many citizens believe that the current economy has improved since the economic downturn a few years ago, the jobless claims indicator proves that the economy has drastically improved.

The number of people who have newly filed for unemployment insurance, known as the jobless claims, has remained under 300,000 per week for over 77 weeks.  This record is the longest streak in the Uweekly-jobless-claims-620ds122012S labor market since 1970.

While things seem to be looking up for the economy, it is important to understand that people are still filing for unemployment insurance.  As the unemployment rate is not currently at zero percent, there are still people who are looking for jobs and unable to find them, and therefore there are people who need the assistance from the unemployment insurance.

The number of jobless claims is at a historical low, yet there are still many people who have distrust and lack confidence in the state of our economy.  While the jobless claims indicator paints a pretty and strong picture of the economy, it is very important to look and identify other indicators that allow a much more inclusive and authentic picture of the current state of our economy.

Ladies Turn to Lip Service in Times of Turmoil

636031229994457049-1287133605_national-lipstick-day-ftr1

Want to predict if we are entering a recession without consulting the usual economic indicators like gross national product (GDP) or the unemployment rate? Enter the lipstick index. It basically shows that in times of turmoil, American women turn to purchasing makeup and lipstick. Leonard Lauder, the chairman of Estée Lauder, coined this term in 2001 because he found that in times of hardship, women consistently turned to his makeup company and their sales soared.

So why does this link to a recession in the economy? While the desire to own products such as electronics declines, primal cues increase women’s desire to attract mates through the use of beauty products. Psychologists analyzed this phenomenon further only to realize that when the going gets tough, women buy makeup, perfume and stilettos to increase their sexual appeal. The end game? To find a mate that can provide financial security in the future. Although some may believe that women should think adversely about finding a suitable mate during a time of economic strife, we are primed to believe this—especially during a financial crisis. When you think about it, a financial crisis separates the fiscally strong men from the pack and women see this. Charles Darwin and evolutionary biology suggested that only the fittest of a species will survive. So therefore in a recession, a woman needs to find a mate that can provide resources and can help achieve reproductive success like biology tells her. I know what you are thinking, that’s crazy but it’s true. Even during the Depression, cosmetic sales increased by 25 percent.

As a woman, I find this hard to believe, but are we kidding ourselves? It doesn’t seem like it. However, I would rather buy two lipsticks, eyeshadow, a tube of mascara and a bottle of perfume for $180 from Sephora over a blouse for the same price of Nordstroms and that has nothing to do with biology. We can all get more bang for our buck when it comes to makeup during a recession. If you really think about it, a blouse or expensive purse is more of an investment than a couple of beauty items that can boost your confidence to the same level.

The lipstick index may be something that is cognitively hardwired in women but it also happens to be an excellent economic indicator. In fact in 2008, L’Oreal saw their sales increase by 5.3 percent while other companies like Ford saw a decrease of 18 percent that same year. Although beauty brands may not suffer during a recession, clearly almost everyone else did. This shows that power of the consumer during economic decline and how their behavior can make or break an industry, whether they realize it or not. Primal needs take over in times of crisis from finding a suitable mate to making hard fiscal decisions in order to survive the next month. If anything, this shows that economics can be regarded as a study of behavior and women rather you’re your usual dollars and cents.

Economic Indicator: The Buttered Popcorn Index

Conventional economic wisdom suggests that during recessionary times, most industries will suffer. During recessions, the real estate, retail and other major markets tend to make less money than usual as people are hesitant to make unnecessary or major purchases when times are tough. However, historical patterns suggest that one nonessential commodity does surprisingly well during recessions: movies.

movies_l

According to the National Association of Theater Owners, box office ticket sales increased in the five recession years before 2008 (Kiplinger). Despite being one of the worst years of the Great Recession, the number of movie tickets sold in the first quarter of 2009 increased more than 9 percent from 2008 (Washington Post). This phenomenon is not a new development. Movies have been performing well during economic turbulence since the Great Depression, when Gone With The Wind (the highest-grossing movie of all time when adjusted for inflation) and King Kong broke box office attendance records despite staggering unemployment rates. Meanwhile, 2005 was a rough year for Hollywood while the economy in general, powered by the housing bubble, performed very well.

At first glance, it is not logical for movies to perform well during recessions because they are not necessary for survival and are an easy expense to cut. The reason behind this cannot be explained by simple supply and demand graphs, but makes sense with a bit of behavioral economics. During tough times, people need to be entertained more than usual to distract themselves. The economic worry and unemployment caused by a recession creates more people needing distraction than usual. Movies are a great opportunity to escape from reality for a few hours at a relatively low cost.

6a00d8341c630a53ef0120a7503ed0970b

The type of movies that perform well during difficult economic periods lend credence to the the idea that the box office is counter cyclical to the economy at large. According to the president of Box Office Mojo, Brandon Gray, “Comedies and epics tend to do really well at the box office during economic downturns.” (Fortune) This is because these genres fit into the escapism category that people seek out during economic difficulty. In the box office summer following the terrorist attacks of 9/11, Spider-Man brought in $403.7 domestically (Fortune). In the midst of the Great Recession, The Dark Knight broke the record for an opening weekend and ultimately made over $1 billion (Fortune). It is no coincidence that both of these movies feature likable heroes and themes of overcoming adversity. Additionally, the light-hearted comedies Step Brothers, Pineapple Express and Tropic Thunder were major hits during the summer of 2008. Despite ticket prices hitting an all-time high in 2015, the average ticket price of $8.61 still offers a relatively cheap entertainment alternative to dinners, bars or concerts (Slashfilm).

Unfortunately for economists, box office revenue is a trailing indicator. It does not help predict economic developments because increased ticket sales are people reacting to a recession when it has already taken effect. Still, the correlation between box office sales and the economy demonstrates that economic decisions are largely dependent on human psychology. It may not make sense for people to spend valuable income on something as superfluous as a movie during a recession, but the desire for entertainment can overcome logical decision making.

Sources:

http://archive.fortune.com/2008/08/21/news/companies/Movies.fortune/index.htm

http://www.kiplinger.com/article/business/T019-C000-S001-10-quirky-economic-indicators.html

http://www.washingtonpost.com/wp-dyn/content/article/2009/07/11/AR2009071100677.html

http://www.slashfilm.com/average-us-movie-ticket-price/

Will the new tax regime on luxury imports pave a way for domestic consumption?

Have you ever thought of Starbucks or Kate Spade as luxury brands? That’s how Chinese people view them, however. If you are drinking Starbucks, you are classy. If you are carrying a Couch purse, you probably will draw the gaze of some housewives.

The tax burden of importing luxury goods (even Starbucks shown above) is extremely high in China compared with other countries. For example, a Kate Spade striped bag on sale is $99 but the price turns out to be more than $300 including taxes in China’s outlets.

1

Interestingly, Chinese shoppers account for a third of global sales of luxury goods, but only a fifth of sales take place domestically.

The rest are purchases made abroad—either ordered from overseas websites, bought by Chinese tourists, or smuggled in by personal shoppers known as “Daigou”.

The large price discrepancy inside China and outside China and the stereotype of foreign products with better quality gave a birth to a gray market existing among oversea students who fill their suitcases with luxury items and resell them back home in person or online. Why students? They have a legal identity and they want to relieve economic burden from their families.

2

“It’s really time consuming to be a student buyer but I really earned my living fee every month, said Xinhui Liu, a graduate of USC Viterbi School of Engineering. According to Xinhui, she earned modestly, with a 10% profit from the original price tag in the market. More often, the purchasing agents earn as high as 50%, but the price they give to their customer is still lower than the Chinese market price after taxation.

However, this gray market is getting squeezed. The import duty rate for importing luxury goods into China is 24.5%, the imported value added tax (VAT)is 17%. The new import tax policy released by the Chinese Ministry of Finance, the General Administration of Customs and the State Administration of Taxation came into effect on April 8.  According to the new tariff standard, Chinese tourists bringing international goods worth over 5,000 yuan ($ 748.5) are required to pay hefty tax. Moreover, they would be treated as smugglers if they carry suitcases full of luxury items as before.

In fear of year-by-year domestic demand flow toward foreign goods, Chinese government comes up with raising the import tax higher and higher. But by levying high taxes, it loses tax revenue when it is smuggled back in.

Moreover, my student buyer friends have already come up with methods to combat the increasing import taxes. “It has little impact on my business actually because I use more advanced shipping method now which included tax insurance.”

The act discourages purchasing products internationally. Nonetheless, it stimulates domestic consumption sector, particularly for higher quality goods. China’s economy has relied heavily on net trade compared with the United States.

Will it work? Probably not in the short time. China Consumer Confidence might also be able to tell a story. Understandably, it fluctuated during the past ten years with a peak around 2008 and plummeted in the following year due to the financial crisis. The monthly trend in 2016 shows that China Consumer Confidence goes down in April after the introduction of the new tax regime. In other words, people were not inclined to purchase during that period.

3

4

Although the new standard of tariff to import luxury goods might play a role in reforming Chinese industry, it’s not enough. China Consumer Confidence rebounded later in June and July. People are still likely to purchase foreign goods for the sake of quality. Therefore, boosting domestic consumption requires more qualified domestic products combined with supportive policy.

New Trends of Housing Market In July

The marriage between the famous Chinese movie star Baoqiang Wang and his wife garnered much attention recently not only because of their public feuds on Weibo and other personal social accounts, but also their apparently poor housing choice.

This 2,315 square feet house was bought for $1.2 million in December 2013, but the price of this property is estimated $1.01 million, shrinking by 15 percent, according to Zillow, a property website.

They are not alone. The nationwide existing house price in July also fell 1.4 percent to $244,100.

The U.S. housing market, however, has been showing signs of a split personality lately, with existing home sales dipping but new homes sales surging.

Prior Consensus Consensus Range Actual
Existing Home Sales – Level – SAAR 5.570 M 5.520 M 5.420 M to 5.650 M 5.39 M
Existing Home Sales – M/M Change 1.1 % -3.2 %
Existing Home Sales – Yr/Yr Change 3.0 % -1.6 %

Existing Home Sales of July, 2016

Source: Econoday

Home sales statistics are significant because the housing market is a major piece of the economy and its health is indicative of many other factors such as the employment rate.

The national 30-year mortgage rate remained stable and dropped slightly after the second quarter, so it could not explain the falling existing home sales.

Existing home sales

A possible explanation for the trend could be low inventory levels in many parts of the country. “Severely restrained inventory and the tightening grip it’s putting on affordability is the primary culprit for the considerable sales slump throughout much of the country last month,” National Association Retails chief economist Lawrence Yun said.


Total housing inventory at the end of July dropped to 2.26 million, which was 5.8 percent lower than a year ago, and year-over-year change declined for 14 straight months. Supplies were not sufficient for the market demands.

For new house constructions, the supply decreased by 7,000 from June to July, bringing the July total to 233,000. Monthly supply fell sharply to 4.3 months at the current sales rate from 4.9 months in June. In July last year, this number was 5.2 months.

But new home sales climbed more than 12 percent in July compared to June. More than 650,000 new houses were sold in July. It seemed like lower interest rates and supply worked better in boosting new home sales than existing home sales.

New home sales


What else can explain this different trend between new and existing house sales?

Price could be one factor. The median price of new houses fell 5.1 percent (more than the 1.4 percent decline of existing home price) to $294,600. The price is 0.5 percent lower compared to July last year.

Another change worth attention is the big public builders shift in focus to lower-priced and smaller homes, which the industry calls the entry-level product.

According to the National Association of Home Builders (NAHB) and U.S. Census data, home size is shrinking for the first time since the recession. Median single-family square floor area fell from the first to the second quarter of this year by 73 square feet.

NAHB’s chief economist Robert Dietz said normal post-recession home size would increase because credit tightens and more wealthy buyers rule the market. But recent small declines in size indicate that this trend has ended and size should decrease as builders add more entry-level homes into the inventory.

More first-time buyers consider location, neighborhood and traffic hours more important than home size. Besides, affordability is their priority.