Dumpster Diving for an Economic Indicator

You have probably heard the old saying, “One man’s trash is another man’s treasure,” more times than you can count. When I hear it, I think of uncovering some gem at a garage sale or, as my roommates in New York once did, finding perfectly usable bunk beds stacked on the curbside trash pile. But, would you ever consider using trash as a tool to measure the strength of an economy?

Economic indicators consist of wildly varying selection of measures, but one of the most well known measures is a nation’s GDP or Gross Domestic Product. The GDP measures the size of a nation’s economy. One major component of GDP is how much stuff people consume. Organizations track this by keeping tabs on the sales numbers for basic items such as clothes and food, and all the way up to large ticket purchases such as homes and cars.

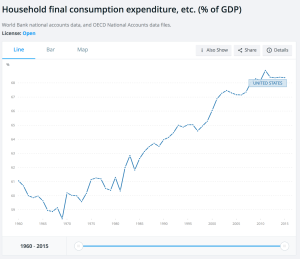
The US definitely loves buying stuff. Consumption made up about 68% of the American GDP in 2014, according to the World Bank, which makes it by far the strongest and heaviest member of America’s economic family. And what’s the natural by product of our America’s insatiable appetite for stuff? Well, that would be waste. This leaves us with an obvious question: can we look at the amount of waste we produce to learn how our economy is performing?

Screen Shot 2016-08-31 at 11.02.36 AM

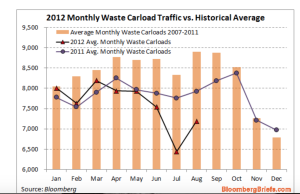
Back in 2010, Bloomberg economists Michael McDonough and Bob Willis investigated that very question. No, they didn’t go around weighing garbage bags or following trash trucks. Instead, they measured how many train cars of trash traversed around the country. The American Association of Railroads tracks figures on the amount of steel and iron waste created, as well as municipal waste that cities, such as New York and Seattle, throw on trains headed out to landfills in other states.

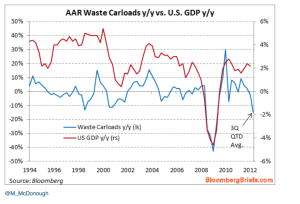
They learned that by looking at these numbers one could determine growth or shrinkage of the economy. Bloomberg studied a period beginning in the first quarter of 2001 until the same period in 2010, and found that the number of cars carrying waste had a correlation of .82 with the growth of GDP, meaning that they grew in a nearly synchronized manner. Makes sense right? The more things created and consumed, means more things that are replaced, go bad or end up as leftovers in the process.

This chart, from Bloomberg in 2012, illustrates the strong relationship between our trash and our GDP dating all the way back to 1994:

Screen Shot 2016-08-30 at 9.19.05 PM

In a 2012 interview with Market Place’s Kai Ryssdall, McDonough described why measuring waste gives such insight into the growth of the economy. He said, “It’s holistic because it’s not isolated to a single part of the economy. It’s people throwing things out, it’s buildings being demolished — it’s everything… I mean, if you’re going to build a new building, there might be a building that’s already there. If you buy a couch, you might be throwing out an old couch. If you go out to McDonald’s and you buy something, you’re going to throw something out. ”

Screen Shot 2016-08-30 at 9.19.15 PM

The only problem with this measure is that looking at waste will not tell you much about the future, but instead about what’s already happened. As waste comes about as the end product of consumer decisions. Even McDonough admits, “it’s more of a lagging indicator.” Though the AAR’s figures do become available before the BEA can calculate our GDP. So a slight advantage does exist for the particularly ardent trawler of trash stats.

Sadly though, it appears that anyone hoping to amass a fortune from tracking trash probably won’t uncover too much treasure.
 

Dating: An Economic Indicator

Screen Shot 2016-08-31 at 9.16.47 PM

Economists use certain indicators to measure the health of our economy. Some classic examples include gross domestic product, employment rate, and housing starts; however, something as emotional and personal as dating can also provide some surprisingly telling information about our economy.

People date because they are looking for their illusory “one.” This could be someone they will lean on in any situation, including times of economic unrest. In fact, Match.com saw a spike in their service usage during the last quarter of 2008, which was right in the midst of the Great Recession.

Screen Shot 2016-08-31 at 9.19.05 PM

This could be explained by a number of factors, especially in the world of online dating. During recessions, people tend to have more time on their hands because they are working less, so they are more willing to invest time in finding love. Online dating also provides a way for people to filter out any possible duds before having to put in the effort of going out to meet them for a possibly unpleasant date. Singles are also likely to crave the comfort and stability of a relationship especially during hard times, so a recession could likely motivate them to begin their search for a mate. Having someone to relate to can absolutely take the stress off.


There are also some practical reasons that people want to have a partner. For many people, dating is an easy way to get a free meal or find new and interesting activities to participate in. Dating gets people outside of the house, and it is a nice distraction from what is happening at home or at work. Later on in the relationship, the couple can begin to share the unsexy necessity of paying the bills. Sharing expenses in the household is much more cost efficient than having to pay for everything yourself.

The financial benefits of having a spouse, like qualifying for certain tax deductions or saving on health insurance, are also some great perks to getting hitched. This is all way down the line though. What is important is that in order to reap all these benefits, people must first begin by simply dating and finding someone who can serve as their partner in crime in life.

Screen Shot 2016-08-31 at 9.19.59 PM

It may not seem like it, but a recession might actually be the perfect time to find a partner because it may be easier to sift through those who are just after your money rather than your heart. Dating can become more about the actual person instead of a game in which one tries to impress the other with the expensive material objects or fancy meals. This can take the pressure off planning extravagant dates so the couple can appreciate simple pleasures like taking a walk or having a picnic.

Most people have an inherent desire to find love, and as bizarre but also expected as it might seem, this want gets pushed to the forefront in times of hardship. If dating can increase overall happiness, then I absolutely say go for it!

Will the new tax regime on luxury imports pave a way for domestic consumption?

Have you ever thought of Starbucks or Kate Spade as luxury brands? That’s how Chinese people view them, however. If you are drinking Starbucks, you are classy. If you are carrying a Couch purse, you probably will draw the gaze of some housewives.

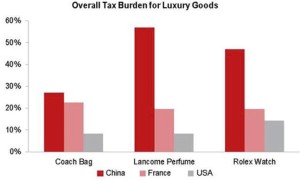
The tax burden of importing luxury goods (even Starbucks shown above) is extremely high in China compared with other countries. For example, a Kate Spade striped bag on sale is $99 but the price turns out to be more than $300 including taxes in China’s outlets.

1

Interestingly, Chinese shoppers account for a third of global sales of luxury goods, but only a fifth of sales take place domestically.

The rest are purchases made abroad—either ordered from overseas websites, bought by Chinese tourists, or smuggled in by personal shoppers known as “Daigou”.

The large price discrepancy inside China and outside China and the stereotype of foreign products with better quality gave a birth to a gray market existing among oversea students who fill their suitcases with luxury items and resell them back home in person or online. Why students? They have a legal identity and they want to relieve economic burden from their families.

2

“It’s really time consuming to be a student buyer but I really earned my living fee every month, said Xinhui Liu, a graduate of USC Viterbi School of Engineering. According to Xinhui, she earned modestly, with a 10% profit from the original price tag in the market. More often, the purchasing agents earn as high as 50%, but the price they give to their customer is still lower than the Chinese market price after taxation.

However, this gray market is getting squeezed. The import duty rate for importing luxury goods into China is 24.5%, the imported value added tax (VAT)is 17%. The new import tax policy released by the Chinese Ministry of Finance, the General Administration of Customs and the State Administration of Taxation came into effect on April 8.  According to the new tariff standard, Chinese tourists bringing international goods worth over 5,000 yuan ($ 748.5) are required to pay hefty tax. Moreover, they would be treated as smugglers if they carry suitcases full of luxury items as before.

In fear of year-by-year domestic demand flow toward foreign goods, Chinese government comes up with raising the import tax higher and higher. But by levying high taxes, it loses tax revenue when it is smuggled back in.

Moreover, my student buyer friends have already come up with methods to combat the increasing import taxes. “It has little impact on my business actually because I use more advanced shipping method now which included tax insurance.”

The act discourages purchasing products internationally. Nonetheless, it stimulates domestic consumption sector, particularly for higher quality goods. China’s economy has relied heavily on net trade compared with the United States.

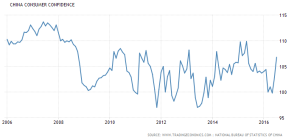
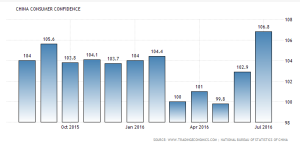
Will it work? Probably not in the short time. China Consumer Confidence might also be able to tell a story. Understandably, it fluctuated during the past ten years with a peak around 2008 and plummeted in the following year due to the financial crisis. The monthly trend in 2016 shows that China Consumer Confidence goes down in April after the introduction of the new tax regime. In other words, people were not inclined to purchase during that period.

3

4

Although the new standard of tariff to import luxury goods might play a role in reforming Chinese industry, it’s not enough. China Consumer Confidence rebounded later in June and July. People are still likely to purchase foreign goods for the sake of quality. Therefore, boosting domestic consumption requires more qualified domestic products combined with supportive policy.

New Trends of Housing Market In July

The marriage between the famous Chinese movie star Baoqiang Wang and his wife garnered much attention recently not only because of their public feuds on Weibo and other personal social accounts, but also their apparently poor housing choice.

This 2,315 square feet house was bought for $1.2 million in December 2013, but the price of this property is estimated $1.01 million, shrinking by 15 percent, according to Zillow, a property website.

They are not alone. The nationwide existing house price in July also fell 1.4 percent to $244,100.

The U.S. housing market, however, has been showing signs of a split personality lately, with existing home sales dipping but new homes sales surging.

Prior Consensus Consensus Range Actual
Existing Home Sales – Level – SAAR 5.570 M 5.520 M 5.420 M to 5.650 M 5.39 M
Existing Home Sales – M/M Change 1.1 % -3.2 %
Existing Home Sales – Yr/Yr Change 3.0 % -1.6 %

Existing Home Sales of July, 2016

Source: Econoday

Home sales statistics are significant because the housing market is a major piece of the economy and its health is indicative of many other factors such as the employment rate.

The national 30-year mortgage rate remained stable and dropped slightly after the second quarter, so it could not explain the falling existing home sales.

Existing home sales

A possible explanation for the trend could be low inventory levels in many parts of the country. “Severely restrained inventory and the tightening grip it’s putting on affordability is the primary culprit for the considerable sales slump throughout much of the country last month,” National Association Retails chief economist Lawrence Yun said.

https://youtu.be/p1hGxvEqkN0


Total housing inventory at the end of July dropped to 2.26 million, which was 5.8 percent lower than a year ago, and year-over-year change declined for 14 straight months. Supplies were not sufficient for the market demands.

For new house constructions, the supply decreased by 7,000 from June to July, bringing the July total to 233,000. Monthly supply fell sharply to 4.3 months at the current sales rate from 4.9 months in June. In July last year, this number was 5.2 months.

But new home sales climbed more than 12 percent in July compared to June. More than 650,000 new houses were sold in July. It seemed like lower interest rates and supply worked better in boosting new home sales than existing home sales.

New home sales


What else can explain this different trend between new and existing house sales?

Price could be one factor. The median price of new houses fell 5.1 percent (more than the 1.4 percent decline of existing home price) to $294,600. The price is 0.5 percent lower compared to July last year.

Another change worth attention is the big public builders shift in focus to lower-priced and smaller homes, which the industry calls the entry-level product.

According to the National Association of Home Builders (NAHB) and U.S. Census data, home size is shrinking for the first time since the recession. Median single-family square floor area fell from the first to the second quarter of this year by 73 square feet.

NAHB’s chief economist Robert Dietz said normal post-recession home size would increase because credit tightens and more wealthy buyers rule the market. But recent small declines in size indicate that this trend has ended and size should decrease as builders add more entry-level homes into the inventory.

More first-time buyers consider location, neighborhood and traffic hours more important than home size. Besides, affordability is their priority.

Dressing up

One of the biggest mysteries of women clothing is how a woman weighing roughly the same as she did 20 or more years ago wears smaller-sized clothing than she used to. The explanation is “size inflation” AKA vanity sizing. This phenomenon is described as: clothes with the same size label have become steadily larger over time.”

Measurements vary by brand, but research by the Economist finds that the average British size-14 pair of women’s pants is more than four inches bigger at the waist today than they were in the 1970s, and over three inches wider at the hips. A size 14 today fits like a former size 18, and a size 10 fits like an old size 14. The same “downsizing” has happened in America where, to confuse matters further, a size 10 is equivalent to a British size 12 or 14, depending on the manufacturer.

So, why do clothing brands do this? It makes shopping for clothes more difficult when manufacturers don’t use the same standards for labeling, and no doubt increases return rates when products don’t fit as expected. The simple answer is that the downsized labels make customers feel good.

A study in 2013, published in the Journal of Consumer Psychology found that smaller sizes boosted the self esteem of the customers, while larger size labels (for the same actual size clothing) negatively affected the customer’s self esteem which transfers badly on the brand and leads to lower sales.

Though size inflation mainly affects women’s clothing, men are not immune to this. Even though most of mens pants are sized in inches rather than in arbitrary units, studies in America and Britain have shown that some brands of men’s pants labelled “waist 36 inches” are infact up to 5 inches larger.

Imagine this in a real world situation, if a consumer was originally a size 8 but has been gradually adding a few pounds, she may be unaware that in the world of standardized accurate fitting dresses she would now fit better in a size 10 dress. In the store, she tries on a dress from 2 brands, A and B. A keeps their clothing sizes consistent and the measurements haven’t changed in decades. While B, has gradually expanded the measurements for each size to the point that what might have been a size 10 dress years ago is now labeled a size 8.

So when the customer tries on a size 8 dress from A it is uncomfortably tight and will need to go up to a size 10. She finds a size 8 dress from B and it fits just fine.

So if the customer keeps finding that only larger sizes of brand A’s fit her then it is likely that her perception of that brand will decline. Is it any surprise that brands are building a few extra inches into their clothing?

In fact, clothing sizing has increased so much that in 2001, the clothing industry introduced size 0 and in 2011, they had to invent size 00 to ensure slimmer individuals could find clothing that fit.

Despite the desire of consumers for honesty and transparency in the marketing process, it seems that they may be willing for brands to lie a little when it comes to telling them their size. This is an important message for all brands: if you give the customers a product that makes them feel good about themselves, they will like the product more and you will sell more. And if your product makes them feel worse, they might as well spend their money elsewhere.

Let’s do Cyber Monday!

Besides eating turkey and gathering with your family to celebrate what you are thankful for, shopping online or in stores has become a major part of our Thanksgiving holiday. The words “Black Friday” and “Cyber Monday” quickly become the most mentioned words during a conversation between two housewives during this holiday season.

What exactly are the terms “Black Friday” and “Cyber Monday”? The term “Black Friday” usually refers to the Friday after Thanksgiving, known as the first day of Christmas shopping. On “Black Friday,” retail stores carry out good deals and promotions to attract customers in an effort to increase sales. The term “Cyber Monday” refers to the first Monday after Thanksgiving, created in 2005 by a marketing firm in order to carry on the tradition of shopping in stores on Black Friday to shopping online that following Monday.

The difference between “Black Friday” and “Cyber Monday” is more than one occurred on Friday and another occurred on Monday. “Cyber Monday” mainly focuses on online shopping and targets female in the work force. When the term “Cyber Monday” was first introduced, it was ranked as the 12th busiest online shopping day of the year. However, 10 years later, it has already become the biggest and busiest online shopping day of the year. “ This year, 2015, it is estimated to 3 billion total in sales, which is a 12% increase over 2014, surpassing “Black Friday”, which is estimated to generate 2.7 billion in online sales, according to Adobe Digital Index” (Bonewright)

When listing out the websites to visit on “Cyber Monday”, Target appeared to be the top choice of many online shoppers since the store offered 15 percent off of any items online. Shopping should always be a fun and engaging experience; however, for some shoppers who shopped on the target website, it turned out to be an unpleasant shopping experience. Due to the high traffic and demand online, the Target website stopped working for some customers when they tried to add items to their carts. When customers tried to add certain item to their carts, a message pop up on their screen indicating that there is a waiting line for that product and the customer needed to wait patiently or continue to refresh the page.

Target faced massive amounts of complaints and a new hashtag #targetfail was created on twitter. A representative told WIRE magazine, “The volume of traffic today is double the site’s previous record, set three days ago on Black Friday.” The spokeswoman said that while the site hasn’t crashed per se, the company has been “metering” the site’s traffic since 9am CST, when the company saw its biggest spike. (Greenberg)

Although the term “Cyber Monday” was originally created by a marketing firm in order to boost sales for certain retailers, it has become one of the most significant online shopping day for the United states and seen as a prominent trend for online retailing business.


When China joins the global reserve currency, who wins and who loses?

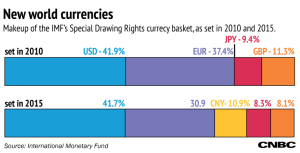
yuan-dollar-CNY-USD-shutterstock_1250pxThis past week, the International Monetary Fund announced it would introduce the Chinese yuan to their reserve currencies group. The global reserve currency currently consists of the U.S. dollar, the euro, the British pound and the Japanese yen. The elevation of the yuan on a global level will soon make up about 11 percent of the IMF special drawing rights, which is an international reserve asset supplementing the official reserves of the now five main countries of the global reserve currency group.This decision will not go into effect until October 2016, but many financial experts are expecting the internationalization of the yuan to have mixed consequences on other countries and regions of the world like the United States and Europe.

U.S.

Although the yuan will not be an official player in the global reserve currency until next year, investors have already started promoting the positive global impact the change will have on the United States. Former New York City mayor Michael Bloomberg and former Treasury secretaries Henry Paulson and Timothy Geithner are leading a coalition to bring trading of the yuan to Wall Street. According to Wall Street Journal reporter Justin Baer, the group believes the inclusion of the yuan would lower costs for U.S. companies purchasing goods and services from China. They will continue to push for local yuan trading and work with both the Chinese and U.S. governments to develop the best currency trade plan.

Europe

Screen Shot 2015-12-03 at 9.33.41 PMThe British pound was the original IMF global reserve currency, until the U.S. dollar surpassed it in the 1920s. CNBC data journalists say since 2010, the pound has held 11 percent of the special drawing rights. However, the eventual addition of the yuan could reduce its holdings to 8 percent. The euro will most likely deal with an even greater loss. When the European union joined in 1999, the euro quickly gained ground accumulating over 37 percent of the special drawing rights by 2010. Now, the yuan could force the currency to reduce its shares for the first time by 6.5 percent. Both of the major currencies in Europe could be facing some stiff competition in the near future as more countries start adding the yuan to their reserve funds. As for the U.S. dollar, it seems like it will continue as the dominant global currency.

China

The inclusion of yuan in the reserve currencies group shows how the International Monetary Fund thinks China is ready for the big leagues. On the other hand, it also suggests the IMF wants to push the government of China to make its markets more accessible. Financial reforms in China have slowly increased in the last few years, but now China has the international and economic recognition to potentially move towards a free market economy. In an interview with Bloomberg Business, the head of the People’s Bank of China foreign central banks and global financial companies will not have to go through a pre-approval process to conduct transactions within the country. China is heading in an interesting direction, but time will tell if its new global status will have an impact on its economic policy.

When does a tech company cease to be a tech company?

When it’s on its way to no longer being a company, period.

Yahoo CEO Marissa Mayer (from Fortune)

Yahoo CEO Marissa Mayer (from Fortune)


Once upon a time, Yahoo was the leader in Internet search, but now as it looks more like roadkill with Google’s and Facebook’s tire tracks over it. As a result, it is considering selling its Internet business, which would make it a…uh…different company.

Two major questions that come to mind are: 1. Why? And 2. What will this new Yahoo be?

The first question has an answer: an activist investor, in this case, New York hedge fund Starboard Value.

Starboard has been a vocal critic of Yahoo CEO Marissa Mayer, believing her tenure has been an abject failure to Yahoo investors, as net revenue has fallen despite industry-wide investment in digital marketing. Consequently, the fund is working to force her to accept defeat at the hands of rivals Facebook and her former employer, Google, and abandon what has been the company’s core business since its inception.

Jeff Smith, Starboard Value (from New York Times)

Jeff Smith, Starboard Value (from New York Times)


This Starboard-Mayer situation is certainly not the first time an activist investor and a CEO have gone toe-to-toe on business strategy, but there is frequently some sort of fight. In this case, with three and a half years of declining revenues, Mayer doesn’t really have a leg to stand on.

Further complicating the issue is the alternative to spinning out the Internet business—potentially paying astronomical tax bills in two different countries. Coincidentally, this also begins the discussion of the second (and unanswerable) question of what would become of Yahoo.

Yahoo bought a stake in Chinese e-commerce giant Alibaba for $1 billion in 2005—an outrageous sum of money at that point in time. Arbitrary nature of tech valuations aside, Alibaba went public last year with the largest tech IPO in history. Great news for Yahoo, right?

Wrong.

The stock has basically declined in value over the last year, and while Yahoo is still looking at a stake worth a bunch of money, it’s also looking at giant tax bills from both the U.S. and China if it tries to capitalize on that stake by spinning it out.

Initially, Mayer had thought that she and Yahoo might dodge the U.S. tax, which by some estimates, would total more than half of the value of its stake. Then the company might have to pay Chinese taxes on top of it.

Starboard’s stance is that Yahoo needs to cut its losses and dump its Internet and display ad business, much the way AOL did when it sold to Verizon earlier this year. Its demand letter alluded to a market for the business but didn’t elaborate.

Regardless, though, the consensus among those covering tech seems to be that the clock is ticking on Mayer, and this decision is likely to make or break her tenure.

China: Loss of GDP on Smog

U152P5029T2D548089F24DT20130113084902

Right when the world leaders gather in Paris for the discussion of environmental issues at the Paris Environmental Conference, China is suffering from heavy smog pollution in multiple areas. This extremely painful weather once again calls upon people’s concentration and concern for air pollution problems.

Air pollution problems are more severe than we think. The UNEP (United Nations Environment Programme) has listed air pollution as “world’s worst environmental health risk” in its Year Book 2014 emerging issues update. UNEP analyzed environmental, social and economic costs of air pollution:

“The cost of air pollution to the world’s most advanced economies plus India and China is estimated to be US$3.5 trillion per year in lives lost and ill health. In OECD countries the monetary impact of death and illness due to outdoor air pollution in 2010 is estimated to have been US$1.7 trillion.”

Deaths caused by outdoor air pollution reach a level of 3.5 million each year from. Between 2005 and 2010, the death rate rose by 4% worldwide, by 5% in China and by 12% in India (UNEP Yearbook 2014).

Air pollution not only threatens people’s life and death, it hinders economic growth as well.

In 2010 alone, air pollution caused lost of USD 1.4 trillion in China (OECD). The total cost of health impact of outdoor air pollution in OECD countries is about USD 1.7 trillion in 2010 (OECD). The World Bank estimated there is at least loss of USD 100 billion spent on illness, premature death and loss of productivity, due to smog in China (The Financialist).

Just because air pollution is a critical issue worldwide, leaders are trying to search for solutions. In addition, solving air pollution problems will likely reduce economic losses and stimulate tremendous economic potential.

China could learn from some previous successful examples. In the U.S., the Clean Air Act (CAA) of 1990 aimed at reducing and preventing air pollution. Combating air quality and enforcing emission limitations were major goals of the CAA. The U.S. has seen many pollutant levels and associated cases of health complications drop, after the act took effect. The direct economic benefit generated from the CAA is 90 times the initial fund put into the regulations.

Wealthy Chinese are investing in real estate in foreign countries and immigrating away from Mainland China, due to the deteriorating air conditions in China. Beijing has announced some policies including China’s Action Plan of Prevention and Control of Air Pollution; however, the people of China have seen little improvement, as Chinese economy remains unstable.

The air pollution in China has caused trillions of USD in loss for its GDP, but the problem is far from being solved. On the other hand, when China eventually becomes capable of finding a solution to its smog problem, there might be growth in its economic outlook as well.


Sources:

http://www.oecd-ilibrary.org/docserver/download/9789264210448-sum-en.pdf?expires=1449128721&id=id&accname=guest&checksum=1E9A27001F2B3684A8CD4AB8D5284351

http://www.unep.org/yearbook/2014/PDF/chapt7.pdf

http://www2.epa.gov/clean-air-act-overview/1990-clean-air-act-amendment-summary

https://www.thefinancialist.com/chinese-smog-at-what-cost/


Black Friday: A Marathon, Not a Sprint

arnold

In recent years, Thanksgiving meant more than just eating delicious food while surrounded by family and discussing what everyone is thankful for. The holiday is also the start of special sales and deals at popular retail stores. Instead of waiting until the Friday after Thanksgiving to start the discounts, retailers have developed the notion to start the sale hours before the big day. Giving people another reason to be thankful.

However, this year there seemed to be a decline on Thanksgiving shopping, shocking right? According to an article from the Business Insider called Thanksgiving shopping was a ‘bust,’ it went into detail about how the start of Black Friday shopping, which begins on Thursday, was slow and lower than usual. They found this information from a Black Friday team that was part of SunTrust, who went to different retail stores throughout the day.

What should be the rational reason for the slow start of the popular shopping is that people prefer to stay home with family on their day off instead of rushing to a store filled with excited shoppers racing to get the best deals. Though this might be a slight factor, it definitely is not the main reason. Online shopping is growing more than ever. A lot of retail stores also provide the same deals online. Instead of leaving family, staying up late, and waiting in line with hundreds of other, they get to stay at home and buy their items with a click of a button, no line involved.

Online shopping - clipping path

The Business Insider article went into the characteristics as to why the usually busy shopping day was slower than normal. Stating that traffic in the New York area seemed below last year both on-and off-mall. Parking was easier for consumers and crowds were more tamed than usual. Another interesting factor is that many consumers were discussing how deals were not as compelling as years past. Also, many retails closed at mid-night, when usually they open around that time for the start of Black Friday.

The popular lines appeared to be for electronics, which the article explained those lines were also half of what they were last year. However, Kohl’s was one store that consistently had long lines and customers making multiple item purchases. This may be because Kohl’s did not have the same deals online.

According to the article, the retailers who had a successful day were American Eagle, Old Navy, and Abercrombie & Fitch. The stores who did not have crazy lines were Gap (which owns Old Navy), Zumiez, and New York & Company.

Needless to say, maybe people are coming to the realization that Black Friday should only be on that day. Or perhaps, online deals are a better choice.