The marriage between the famous Chinese movie star Baoqiang Wang and his wife garnered much attention recently not only because of their public feuds on Weibo and other personal social accounts, but also their apparently poor housing choice.
This 2,315 square feet house was bought for $1.2 million in December 2013, but the price of this property is estimated $1.01 million, shrinking by 15 percent, according to Zillow, a property website.
They are not alone. The nationwide existing house price in July also fell 1.4 percent to $244,100.
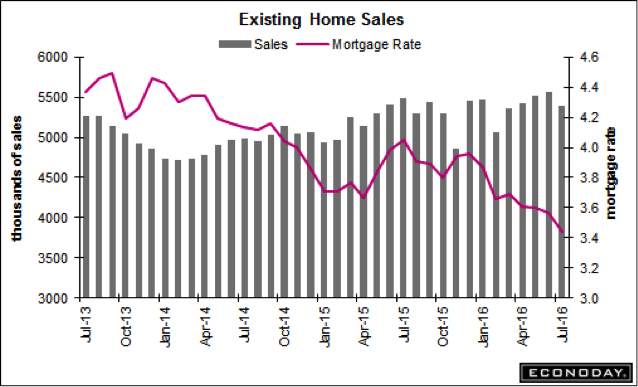
The U.S. housing market, however, has been showing signs of a split personality lately, with existing home sales dipping but new homes sales surging.
| Prior | Consensus | Consensus Range | Actual | |
| Existing Home Sales – Level – SAAR | 5.570 M | 5.520 M | 5.420 M to 5.650 M | 5.39 M |
| Existing Home Sales – M/M Change | 1.1 % | -3.2 % | ||
| Existing Home Sales – Yr/Yr Change | 3.0 % | -1.6 % |
Existing Home Sales of July, 2016
Source: Econoday
Home sales statistics are significant because the housing market is a major piece of the economy and its health is indicative of many other factors such as the employment rate.
The national 30-year mortgage rate remained stable and dropped slightly after the second quarter, so it could not explain the falling existing home sales.
A possible explanation for the trend could be low inventory levels in many parts of the country. “Severely restrained inventory and the tightening grip it’s putting on affordability is the primary culprit for the considerable sales slump throughout much of the country last month,” National Association Retails chief economist Lawrence Yun said.
Total housing inventory at the end of July dropped to 2.26 million, which was 5.8 percent lower than a year ago, and year-over-year change declined for 14 straight months. Supplies were not sufficient for the market demands.
For new house constructions, the supply decreased by 7,000 from June to July, bringing the July total to 233,000. Monthly supply fell sharply to 4.3 months at the current sales rate from 4.9 months in June. In July last year, this number was 5.2 months.
But new home sales climbed more than 12 percent in July compared to June. More than 650,000 new houses were sold in July. It seemed like lower interest rates and supply worked better in boosting new home sales than existing home sales.

What else can explain this different trend between new and existing house sales?
Price could be one factor. The median price of new houses fell 5.1 percent (more than the 1.4 percent decline of existing home price) to $294,600. The price is 0.5 percent lower compared to July last year.
Another change worth attention is the big public builders shift in focus to lower-priced and smaller homes, which the industry calls the entry-level product.
According to the National Association of Home Builders (NAHB) and U.S. Census data, home size is shrinking for the first time since the recession. Median single-family square floor area fell from the first to the second quarter of this year by 73 square feet.
NAHB’s chief economist Robert Dietz said normal post-recession home size would increase because credit tightens and more wealthy buyers rule the market. But recent small declines in size indicate that this trend has ended and size should decrease as builders add more entry-level homes into the inventory.
More first-time buyers consider location, neighborhood and traffic hours more important than home size. Besides, affordability is their priority.
Leave a Reply
You must be logged in to post a comment.