Obesity and Socioeconomic Status

It’s lunch time in Westlake Elementary school in Mississippi, the fattest state in the fattest country in the Western world. Uniformed lunch ladies stand ready behind the counter. Elementary students line up with trays in hand. Yes to chocolate milk, yes to chicken nuggets, yes to cheese fries, yes to orange jelly, no to salad. Bowls of iceberg lettuce and cherry tomatoes sit rim to rim, rejected.

Persuading children to eat vegetables is hardly a new struggle, nor would it seem to rank high on the list of world priorities. In an age of abundance, individuals have the luxury of eating what they like. Yet the U.S., for all its libertarian ethos, is now worrying about how its citizens eat and how much exercise they do. But it is no surprise, as it has become an issue of national concern.

The statistics are grim: Roughly two out of three U.S. Adults are overweight. This is defined as having a body mass index (BMI) of 25 or more, which for a man standing 5’9’’ means a weight of 170 pounds or more. Alarmingly, 36% of adults and 17% of children are not just overweight but obese with a BMI of at least 30, meaning they weigh 200 pounds or more at the same height. If current trends continue, by 2030 nearly half of American adults could be obese.

Americans may be shocked by these numbers, but for the rest of the world, they fit the stereotype. Burgers, sodas and fried foods are considered as American as the Stars and Stripes. But there is a glimmer of good news. After two decades of dramatic growth, childhood obesity rates are showing signs of leveling off. Government researchers at Proceedings of National Academy of Sciences (PNAS) have even reported slight declines among certain subgroups (such as young children and girls), leading some experts to speculate that the epidemic may have reached its peak.

But this turn around applies to some kids more than others. A closer look at the data indicates that this average decline doesn’t tell the whole story.

The researchers looked at adolescent obesity (an important predictor of adult obesity) by analyzing two large health surveys done by the NHANES and NSCH. While they confirmed that the obesity rate among adolescents is no longer climbing — after it “more than doubled over the past three decades” — this did not hold true across different socioeconomic groups.

Obesity is decreasing amongst adolescents who come from well-educated families, but it has continued to increase in poor teens. Looking at the obesity rate overall, this reads as a plateau.

It is unfair to aggregate trends in groups that are so different, the reality of the situation becomes unclear and misleading.

For adolescents whose parents have at least a college degree (black dots), obesity is on the decline. But for those whose parents have no more than a high school diploma (red dots), obesity rates are still rising — and the gap seems to be getting larger. (The short lines above and below the dots show the possible margin of error.)

Why are the rates of obesity so different among members of different socioeconomic groups, to the point where they are actually trending in opposite directions? The answer is more complicated than it might seem.

Exercise

A difference in exercise habits, not just eating habits, has been driving the obesity gap in children and adolescents. Take a look at the physical activity chart, which seem to mirror the obesity rate charts above:

On the left, NHANES, counts children as active in the if they had at least 10 minutes of physical activity in the past 30 days, an alarmingly low standard. On the right, NSCH counts children as “active” if they had at least 20 minutes of physical activity in the past seven days.

The disparity in rates of physical activity increased sharply in 2010 just like the disparity in obesity rates.

While the proportion of high socioeconomic-status adolescents has stayed about the same in recent years (most recently 94.7%), the latest NHANES counted just 82.1% of low socioeconomic-status adolescents as active — down from 90% in 2003.

Though there isn’t an exact reason for what’s causing the different levels of physical activity, a potential reason might be due to money and opportunities. Adolescents from poorer families are less likely to participate in school sports, which can cost money, and are more likely to attend schools that have had to reduce or eliminate their sports programs.

Parks and recreational facilities are funded by tax dollars collected within the surrounding area. In wealthier neighborhoods, tax revenue is higher and residents of the area will insist on these establishments. As a consequence, low income neighborhoods do not have as many parks or space to exercise. Though this is not the case everywhere, it is the case for many. The few opportunities combined with the safety of a neighborhood can affect whether kids are able or allowed to run outside or use parks or other recreational facilities.

A lead researcher at Xiaozhong Wen, a postdoctoral fellow at Harvard Medical School, shares interesting theories to the dramatic increase of obesity rates in adolescents whose family incomes are the below the poverty line. He draws his conclusions from distinguishing families based on needs of medicaid. “The health insurance is a proxy, or indicator, for some underlying… reasons for this disparity,” he says. “I think it might be the family environment, how the parents feed the children, how do they control or monitor the child’s eating or physical activity.”

Compared to more affluent children, Wen says, kids on Medicaid may be less likely to live in neighborhoods where they can play and exercise safely outdoors, and their caretakers are less likely to have access to supermarkets selling fresh, healthy foods.

Upper and middle-class adolescents are also four times as likely as lower class adolescents to have a regular doctor, so they may be more exposed to the importance of regular exercise. More contact with doctors, safer neighborhoods, more green space and better school programs may be part of the solution to encourage kids and adolescents to exercise. They doesn’t have to be competing in state level sports, healthy changes like a walk to the grocery store or an active video game can lead to positive results.

Parental Guidance

Parents of lower income families that lack education and job mobility are likely to work in low wage jobs with long hours. They have less time to be physically active and to encourage a healthy lifestyle for their kids from a young age. And when time and money are tight, it is cheaper to rely on fast-food meals than to buy and prepare fresh food.

In recent decades gender equality has improved and the work force is accepting more women. However, this improvement may have resulted in the growing percent overweight kids. A new study released in the Journal Child Development finds, “For each additional five-month period his or her mother is employed, a child of average height can be expected to gain 1 extra pound over and above normal growth” In addition, sixth graders with working mothers were found to be six times more likely than those with stay-at-home moms to be overweight.

Mothers who have jobs don’t directly cause weight problems in their children, but busy families may accelerate weight gain by relying too much on cheap convenient fast food rather than healthy meals. Food and lifestyle choices are definitely the direct cause of obesity, but it can also occur against a backdrop of physical and psychological challenges that can make weight watching a low priority.

In a recent study, published in Pediatrics, found that preschool-age girls in big cities were more likely to be obese if they had undergone stressful experiences such as witnessing household violence, having a mother who was depressed or abusing alcohol or drugs, or living in a tenuous housing situation.

Growing up in a unstable life with violence, moving around a lot or depression certainly means obesity goes down the rank of importance. These factors, however, were not associated with a higher obesity rate in preschool boys, which highlights the difficulty of making sweeping conclusions about obesity and socioeconomic status.

Children from low income families are hardly a homogenous population, and the relationship between obesity and family income varies wider by gender, age, ethnicity and geographic area.

A 2006 study in the American Journal of Clinical Nutrition that looked at several decades of national data found that obesity was strongly tied to socioeconomic status only among white girls. Mexican-American and African-American girls showed similar trends, yet they were still more likely to be obese compared to girls from white families of similar socioeconomic status.

Beauty is in the eye of the beholder

Regardless of age, race and socioeconomic class, girls all around the world strive to be beautiful. Whether it is to achieve the perfect skin tone, the perfect weight or the perfect hair color, many young females have the ability to improve their beauty if they tried hard enough.

The mean BMI of an African American women is 29.8 and mean Caucasian woman is 26.7. Interestingly enough there was no significant difference for BMI for men based on race. Though there is no research to explain this data, we are all quite familiar with the extremely thin standard of beauty immortalized by Barbie.

Sarah Constance from Irvine, Orange County, recalls a teenage memory. “Growing up in a primarily white and asian upper middle class suburb,I remember meeting up with other girls to get ready together before big dances. Each time we would all criticize our own bodies, and bemoan the fact that we weren’t measuring up to the ideal Victoria Secret model.”The girls always talked about what they ate and how much of it, as if it was a contest and the winner was whoever ate the least.

Sarah was surprised when a male from of Mexican heritage told her how sexy it was for girls to have “thick thighs”. A similar appreciation for a more voluptuous body type is also found in African-Americans. This could potentially relate to why Hispanic and African-American women are statically more likely to be obese, since those cultures do not equate such thinness with beauty and sex appeal.

Dressing up

One of the biggest mysteries of women clothing is how a woman weighing roughly the same as she did 20 or more years ago wears smaller-sized clothing than she used to. The explanation is “size inflation” AKA vanity sizing. This phenomenon is described as: clothes with the same size label have become steadily larger over time.”

Measurements vary by brand, but research by the Economist finds that the average British size-14 pair of women’s pants is more than four inches bigger at the waist today than they were in the 1970s, and over three inches wider at the hips. A size 14 today fits like a former size 18, and a size 10 fits like an old size 14. The same “downsizing” has happened in America where, to confuse matters further, a size 10 is equivalent to a British size 12 or 14, depending on the manufacturer.

So, why do clothing brands do this? It makes shopping for clothes more difficult when manufacturers don’t use the same standards for labeling, and no doubt increases return rates when products don’t fit as expected. The simple answer is that the downsized labels make customers feel good.

A study in 2013, published in the Journal of Consumer Psychology found that smaller sizes boosted the self esteem of the customers, while larger size labels (for the same actual size clothing) negatively affected the customer’s self esteem which transfers badly on the brand and leads to lower sales.

Though size inflation mainly affects women’s clothing, men are not immune to this. Even though most of mens pants are sized in inches rather than in arbitrary units, studies in America and Britain have shown that some brands of men’s pants labelled “waist 36 inches” are infact up to 5 inches larger.

Imagine this in a real world situation, if a consumer was originally a size 8 but has been gradually adding a few pounds, she may be unaware that in the world of standardized accurate fitting dresses she would now fit better in a size 10 dress. In the store, she tries on a dress from 2 brands, A and B. A keeps their clothing sizes consistent and the measurements haven’t changed in decades. While B, has gradually expanded the measurements for each size to the point that what might have been a size 10 dress years ago is now labeled a size 8.

So when the customer tries on a size 8 dress from A it is uncomfortably tight and will need to go up to a size 10. She finds a size 8 dress from B and it fits just fine.

So if the customer keeps finding that only larger sizes of brand A’s fit her then it is likely that her perception of that brand will decline. Is it any surprise that brands are building a few extra inches into their clothing?

In fact, clothing sizing has increased so much that in 2001, the clothing industry introduced size 0 and in 2011, they had to invent size 00 to ensure slimmer individuals could find clothing that fit.

Despite the desire of consumers for honesty and transparency in the marketing process, it seems that they may be willing for brands to lie a little when it comes to telling them their size. This is an important message for all brands: if you give the customers a product that makes them feel good about themselves, they will like the product more and you will sell more. And if your product makes them feel worse, they might as well spend their money elsewhere.

The Trans Pacific Partnership and what it means for the econonmy

The world had not seen a big multinational trade pact for over 20 years. After 7 years of negotiations, United States and eleven other Pacific Rim nations reached a final agreement on 5th October 2015. Now after all the meetings between world political leaders, the final step lies in Obama’s hands: Securing approval from Congress.

Obama has pledged that the TPP would open new markets for U.S. goods and services and establish rules of international commerce that give “our workers a fair shot at the success they deserve.” Congress however is more skeptical. The deal now faces months of scrutiny in Congress, where some bipartisanship opposition was immediate.

Assuming that all goes well and Congress approves the TPP, what would be the likely effects of the new trade agreement on the economy and on America’s influence throughout the world?

The Economic Impact on the TPP is Exaggerated 

Progressives and labor unions rally against the bill think that it will be the end of manufacturing jobs and worker protections in the United States. Conservatives and corporations think that the bill will drive tremendous economic growth in the country. Neither is correct.

Two of the nation’s leading economists, Paul Krugman (left) and Nicholas Gregory Mankiw (right), both agree that the trade agreement will increase domestic income of all the nations involved by 0.5% by 2025. In the United States this amounts to little over $80 billion, certainly nothing to irrelevant, but nothing that will spark tremendous economic growth. The problem is that trade is relatively free throughout much of the world. Borders have been liberalized. The average good traded between these twelve countries has only a 1.4% tariff on it There just isn’t a whole lot to be gained by removing these tariffs.

Growth prospects might be limited however there are other aspects to consider — primarily the interests of US businesses and multinational corporations.

First, intellectual property rights. The US is trying to enhance protections for pharmaceuticals drugs and Hollywood movies. In many of these developing countries that are part of the TPP (Vietnam, Malaysia, Bruinei) knock-off drugs and films are sold to consumers. The TPP would put stricter regulations in place in these countries, ensuring this does not continue.

Agriculture producers also have a lot to gain from this deal. The United States currently produces a surplus of food, and much of that food goes to waste. Opening up international markets could be a huge boon for the agricultural industry.

Against China’s Power

Many of the potential benefits from the trade agreement concern the relationship the United States has with China. Importantly, China is not part of this trade agreement, but they are working on their own trade agreements in the region with many of the same countries in the TPP. China also won’t push for the same environmental regulations and worker protections the United States is currently pushing for.

This is an opportunity for the United States to expand it’s influence in the South Asian region and prevent these countries from falling under China’s influence.

Sharing is the new buying

Why pay excessive prices for goods and services when you can rent it more cheaply from a stranger online? That is the principle behind a range of online services that make it possible for people to share accommodation, household appliances, cars, bikes and other items, connecting owners of underused assets with others who are willing to pay for them. A growing number of businesses, such as Uber, where people use their car to provide a taxi service to paying passengers, or Airbnb, which lets people rent out their spare rooms, act as matchmakers, allocating resources to where they are needed and taking a small percentage in profits in return.

Such peer-to-peer rental business is beneficial for several reasons. Owners make money from underused assets. Airbnb says hosts in San Francisco who rent out their homes average a profit of $440 (after rent) some neighborhoods snagging upwards of $1900 a month. Car owners who rent their vehicles to others using RelayRides make an average profit of $250 a month; some make more than $1,000. Borrowers, meanwhile, benefit from the convenience and pay less than they would if they bought the item themselves, or turned to a traditional provider such as a hotel or car-hire firm. And there are environmental benefits, too: Renting a car when you need it, rather than owning one, means fewer cars are required and fewer resources must be devoted to making them.

The internet plays a vital role in this business. It makes it cheaper and easier than ever to provide accurate supply and demand information. Smart phones with global tracking services can find a nearby room to rent or car to borrow. Online social networks and review systems help develop trust; internet payment systems can handle the billing. All this lets millions of total strangers rent things to each other. The result is known variously as “collaborative consumption,” the “collaborative economy,” “peer economy,” “access economy” or “sharing economy”.

The model of the sharing economy works for items that are expensive to buy and are widely owned by people who do not make full use of them. Bedrooms and cars are obvious examples, but you can also rent fields in Australia, washing machines in France and camping spots in Sweden. As proponents of the sharing economy like to put it, access trumps ownership.

How Did We Get Here and Why Now?

The world is at a turning point. The urbanization of populations continues to rise, and Millennials, are beginning to impact the economy as they enter the work force and start making economic decisions. These changes are most prevalent in big cities and new business have already begun to adapt.

The consumer is changing. The Millennials generation, born in the 1980s to early 2000s, experienced incredible uncertainty, having lived through the 2008 – 2009 financial crisis and struggles with increasing student debt. These financial pressures lead to demand for a more efficient allocation of resources – and that, means they want to own less, be more connected with others and be a part of something bigger than their individual selves.

Social media and social connection is an important aspect of the new lifestyle. A significant percent of modern day free time is spent browsing the social media accounts of our friends, family, celebrities, etc. Now, instead of seeking advice from our personal networks, we have access to the world. Trust and dependency in strangers and technology is a crucial aspect in the success of the shared economy, without the two, we would be stuck in the past

While the classic American dream is to own everything, the millennial’s version is to move to an “asset light” lifestyle. These trends have sparked massive innovation, created new marketplaces and potentially holding the keys to the future.

Premium on Ownership Disappears

Let’s travel back to 1999, when the millennials were still children exploring the internet. Many children took advantage of Napster, a website that enabled users to download songs for free. Illegal? Sure. But no one, except record companies, really cared. There are profound differences between the millennial peer-to-peer downloading and that of their parents or even people five years their senior. From the very beginning the experience of acquiring and consuming media content was based on the premise that access to content should be easy and free.

Now, back to 2015, access to media content is essentially free. Want on-demand access to whatever music you want? Spotify has got you covered. On-demand access to movies and TV shows? Netflix. On-demand access to videos of anything you want to watch? Lose a few hours on YouTube. Of course some of these services require a subscription fee so they are not truly free.

But this is what happens in the shared economy. It emerges when the access to goods and services, such as media streaming, becomes cheap, satisfactory and reliable enough that the premium on physical ownership has disappeared. There is hardly any reason to purchase these goods and services aside from personal habits (for example collecting vinyl) or peculiar requirements.

Ten years ago, to watch a movie released on DVD, there were two options: purchasing or renting.

Of those options, renting was the inferior. Even though it was more expensive to own these DVDs, it was preferred since people had the freedom to watch movies whenever they wanted and prized their DVD collections.

Today, that premium has disappeared. Streaming a movie on Netflix isn’t inferior to owning a DVD the same way that renting was. And ever since then, the extensive access to cheap and easy media content, has lead to new kinds of behaviors have emerged like binge-watching. Similarly, the rise of music streaming services has enabled behaviors such as sharing playlists, a process that used to be time-consuming and effort-intensive. When nobody buys music but still has access to it, social sharing of music emerges as a natural and human behavior.

Obstacles on the road to Success

To truly grasp the scale and greatness of the sharing economy, consider the following data. Airbnb averages 425,000 guests per night, totaling to more than 155 million guest stays annually – nearly 22% more than Hilton Worldwide, which serves 127 million guests in 2014. Five-year old Uber operates in more than 250 cities worldwide and as of February 2015 was valued at $41 billion – a figure that exceeds the market capitalization of companies such as American Airlines and United Continental. According to PwC’s projections, the sharing economy (including travel, car sharing, finance, staffing and music streaming) has the ability to increase global revenues from $15 billion today to around $335 billion by 2025.

It is not hard to find evidence of successful sharing economy but not everyone is as delighted by the rise as its participants and investors. Taxi drivers in America and now Europe have complained loudly (and in the case of Paris, violently) about the intruders who, they say not only are unqualified but also under insured.

Uber has always been plagued with problems with regulation and taxi unions around the world. In 2014, a court in Brussels prohibited drivers from from accepting passengers through UberPOP or face a €10,000 fine.

It is not just car-sharing services that have run into legal problems. Apartment-sharing services have also fallen victims of regulations and other rules governing temporary rentals. Many American cities ban rentals of less than 30 days in properties that have not been licensed and inspected. Some Airbnb renters have been served with eviction notices by landlords for renting their apartments in violation of their leases. In Amsterdam, city officials point out that anyone letting a room or apartment is required to have a permit and to obey other rules. They have used Airbnb’s website to track down illegal rentals.

On top of legal regulations, issues with customers have also become obstacles for sharing businesses. In 2011, Airbnb suffered a rash of bad publicity when a host found her apartment trashed and her valuables stolen after a rental. After some public relations, Airbnb eventually covered her expenses and included a $50,000 guarantee for hosts against property and furniture damage.

Peering into the Future

The sharing economy can be compared to online shopping, which began in America 15 years ago. In the beginning, people were not too sure about the vendors and didn’t trust the services. However with time and perhaps a successful purchase on amazon or two, people felt safe buying from other vendors too. Now consider Ebay, a company started as a peer-to-peer platform, now is now dominated by professional “power sellers” (many of whom started as ordinary Ebay users).

Big corporate companies dominating the market are getting involved too. Avis, a car rental firm has shares in Zipcar, its car sharing rival. So do GM and Daimler, two car manufacturers. In the future, companies may follow a hybrid business model, listing excess capacity on Peer-to-Peer websites. In the past, new ways of doing things online have put the old ways out of business. But they have often changed them.

We will have to wait and see which on-demand services start to gain traction with mainstream markets and which wont’t. It is not likely that in thirty years time our whole lives will be on demand and we won’t hold ownership. But a major possibility is products and industries most likely to be disrupted by the sharing economy would be things that we possess but not necessarily own. An example would be Airbnb. It has disrupted the demand for owning vacation homes (something you possess) and tourist hotels (something you don’t possess but is still “yours” in a way that an Airbnb isn’t).

Sharing is the New Buying

Why pay exuberant prices for goods and services when you can rent it more cheaply from a stranger online? That is the principle behind a range of online services that make it possible for people to share accommodation, household appliances, cars, bikes and other items, connecting owners of underused assets with others who are willing to pay for them. A growing number of businesses such as Uber, where people use their car to provide a taxi service to paying passengers, or Airbnb which lets people rent out their spare rooms, act as matchmakers, allocating resources to where they are needed and taking a small percentage in profits in return. 

Such peer-to-peer rental business is beneficial for several reasons. Owners make money from underused assets. Airbnb says hosts in San Francisco who rent out their homes average a profit of $440 (after rent) and some neighborhoods snagging upwards of $1900 a month. Car owners who rent their vehicles to others using RelayRides make an average of $250 a month; some make more than $1,000. Borrowers, meanwhile, benefit from the convenience and pay less than they would if they bought the item themselves, or turned to a traditional provider such as a hotel or car-hire firm. And there are environmental benefits, too: renting a car when you need it, rather than owning one, means fewer cars are required and fewer resources must be devoted to making them.

The internet plays a vital role in this business, it makes it cheaper and easier than ever to provide accurate supply and demand information. Smart phones with global tracking services can find a nearby room to rent or car to borrow. Online social networks and review systems help develop trust; internet payment systems can handle the billing. All this lets millions of total strangers rent things to each other. The result is known variously as “collaborative consumption”, the “collaborative economy”, “peer economy”, “access economy” or “sharing economy”.

The model of the sharing economy works for items that are expensive to buy and are widely owned by people who do not make full use of them. Bedrooms and cars are obvious examples but you can also rent fields in Australia, washing machines in France and camping spots in Sweden. As proponents of the sharing economy likes to put it, access trumps ownership.

How Did We Get Here and Why Now?

The world is at a turning point. Globally, economies are strained as companies and governments are seeking to “do more with less”. Natural resources are no longer cheap and plentiful and some are at the risk of exhaustion. The urbanization of populations continues to rise, and more old people are ageing while young people, such as the Millennials also known as generation Y, are booming. These changes are most prevalent in big cities and new business have already begun to adapt.

The consumer is changing, the Millennials generation, born 1980s to early 2000s, are 92 million strong and stand to inherit large amounts of wealth and decision making power in the U.S. for many years to come. Millennials have experience incredible uncertainty, having lived through the 2008 – 2009 financial crisis and struggles with increasing student debt. These financial pressures lead to demand for a more efficient allocation of resources – and that, by large means they want to own less, be more connected with others and be a part of something bigger than their individual selves.

While the classic American dream is to own everything, the Millennial’s version is to move to an “asset light” lifestyle. These trends have sparked massive innovation, created new marketplaces and potentially holding the keys to the future.

Premium on Ownership Disappears

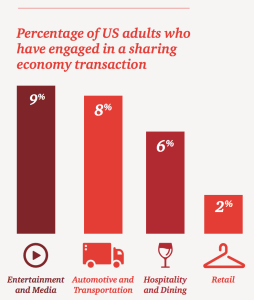
About a decade ago, companies such as Zipcar started to capitalize on idling cars, which sit on idle for an average of 23 hours a day. Today there are hundreds of ways to share assets, the most popular ones include entertainment, transportation and hospitality and dining.

At 9% entertainment and media holds the highest percentage of users. The consumption of media has changed drastically since the rise of digital age and perhaps it is the best example of the millennial Screen Shot 2015-10-09 at 12.26.20 PMgeneration shift.

Let’s travel back to 1999, when the millennials were still children  exploring the internet. Many children took advantage of Napster, a website that enabled users to download songs for free. Illegal? Sure. But no one really cared. There are profound differences between the millennial’s peer-to-peer downloading than that of their parents or even people 5 years their senior. From the very beginning the experience of acquiring and consuming media content was based on the premise that access to content should be easy and free.

Now back to 2015, access to media content is essentially free. Want on-demand access to whatever music you want? Spotify has got you covered. On-demand access to movies and TV shows? Netflix. On-demand access to videos of anything you want to watch? Lose a few hours on Youtube. Of course some of these services require a subscription fee so they are not truly free. But when access to goods and services becomes cheap, satisfactory and reliable enough that the premium on physical ownership has disappeared, there is hardly any reason to purchase these goods and services aside from personal habits or peculiar requirements.

Ten years ago, to watch a movie released on DVD, there were 2 options: purchasing or renting. Of those options, renting was the inferior option as there was a greater premium on ownership. Today, that premium has disappeared, streaming a movie on Netflix isn’t inferior to owning a DVD the same way that renting was. And ever since then, the extensive access to cheap and easy media content, has lead to new kinds of behaviours have emerged like binge-watching. Similarly, the rise of music streaming services has enabled behaviours such as sharing playlist, a process that used to be time-consuming and effort-intensive. When nobody buys music but has access to it, social sharing of music emerges as a natural and human behaviour.

Obstacles on the road to Success

To truly grasp the scale and greatness of the sharing economy, consider the following data. Airbnb averages 425,000 guests per night, totalling to more than 155 million guest stays annually – nearly 22% more than Hilton Worldwide, which serves 127 million guests in 2014. Five-year old Uber operates in more than 250 cities worldwide and as of February 2015 was valued at $41 billion – a figure that exceeds the market capitalization of companies such as American Airlines and United Continental. According to PwC’s projections, the sharing economy (including travel, car sharing, finance, staffing and music streaming) has the ability to increase global revenues from $15 billion today to around $335 billion by 2025.

It is not hard to find evidence of successful sharing economy but not everyone is as delighted by the rise as its participants and investors. Taxi drivers in America and now Europe have complained loudly (and in the case of Paris, violently) about the intruders who, they say not only are unqualified but also under insured.

Uber has always been plagued with problems with regulation and taxi unions around the world. In 2014, a court in Brussels prohibited drivers from from accepting passengers through UberPOP or face a €10,000 fine. In July 2015, Uber took one of its biggest hits. The judge ruled that Uber has not complied with state laws designed to ensure that drivers are doling out rides fairly to all passengers, regardless of where they live or who they are. This lead to a $7.3 million fine or California Suspension.

It is not just car-sharing services that have run into legal problems. Apartment-sharing services have also fallen victims of regulations and other rules governing temporary rentals. Many American cities ban rentals of less than 30 days in properties that have not been licensed and inspected. Some Airbnb renters have been served with eviction notices by landlords for renting their apartments in violation of their leases. In Amsterdam, city officials point out that anyone letting a room or apartment is required to have a permit and to obey other rules. They have used Airbnb’s website to track down illegal rentals.

On top of legal regulations, issues with customers have also become obstacles for sharing businesses. In 2011, Airbnb suffered a rash of bad publicity when a host found her apartment trashed and her valuables stollen after a rental. After some public relations and Airbnb eventually covered her expenses and included a $50,000 guarantee for hosts against property and furniture damage.

Peering into the Future

The sharing economy can be compared to online shopping, which began in America 15 years ago. In the beginning, people were not too sure about the vendors and didn’t trust the services. However with time and perhaps a successful purchase on amazon or two, people felt safe buying from other vendors too. Now consider Ebay, a company started as a peer-to-peer platform, now is now dominated by professional “power sellers” (many of whom started as ordinary Ebay users).

Big corporate companies dominating the market are getting involved too. Avis, a car rental firm has shares in Zipcar, its car sharing rival. So do GM and Daimler, two car manufacturers. In the future, companies may follow a hybrid business model, listing excess capacity on peer to peer websites. In the past, new ways of doing things online have put the old ways out of business. But they have often changed them.

We will have to wait and see which on-demand services start to gain traction with mainstream markets and which wont’t. It is not likely that in thirty years time our whole lives will be on demand and we won’t hold ownership. But a major possibility is products and industries most likely to be disrupted by the sharing economy would be things that we possess but not necessarily. An example would be Airbnb, it has disrupted the demand for owning vacation homes (something you possess) and tourist hotels (something you don’t possess but is still “yours” in a way that an Airbnb isn’t). 

Drink Juice and prosper

With lifestyles that usually incorporate healthy choices, it’s no surprise Los Angeles has made the juicing trend a way of life. I had the privilege of interviewing Lucy Wagner, one of the original employees of The Juice, a cold pressed organic juice bar in Atwater, Los Angeles.

Lucy Wagner has been working at The Juice since day one and she has been through the business changes and expansion of the company for over 2 years. She shared with me her understanding on the day to day challenges the founders of The Juice has faced and her first hand perspective on business development.

What makes The Juice different from other stores is that they cold press all their juices. Cold pressing it’s a newer process in which the fruits vegetables are first crushed and then pressed in a huge hydraulic press (with a pressure equal to 5 times the pressure found in the deepest part of the ocean). Because cold pressing don’t produce much heat, it keeps more of the fresh ingredients’ nutrients intact. Traditional centrifugal juicers uses a fast spinning metal blade that generates heat which destroys some of the enzymes in the fruits and vegetables rendering less nutritious juice.

First The Juice store in Atwater

The founders of The Juice, Elizabeth and Melissa both believed in high quality juices and splashed out on the cold presser despite it’s $50,000 price tag. This was a huge cost to them but ensured the quality and nutritional value of their products.

The process of cold pressing is very labour intensive and each batch can take up to an hour. Since all juices are pre-made and bottled up, customers have complained about the lack of customization and not having juices made to order.

Even though The Juice now has 3 locations throughout LA (two in Atwater and one in the Arts District) they only have 1 juicer. Juices are usually transported to the two newer locations because it’s more cost efficient this way.

One of the biggest challenge that all juice bars face is the season’s effect on business. No only are these juice bars impacted by seasonal produce but they also have to deal with lower demand in the colder months. People often assume that with biotechnology we are able to get fruits in season all year round, this is not true. When fruits are off season, it’s harder to maintain the quality and a consistent menu. Organic Juiceries such as The Juice are particularly affected by this as they only serve organic produce which is more natural and harder to control.

And just as juices are hard to maintain in the colder months, business is too. In order to keep business during the winter Elizabeth and Melissa position the juices as post holiday cleanses and defence against the flu season. At $9 a bottle, The Juice is considered a luxury in the eyes of many people. Even though the US economy is no longer in a financial crisis, when people are not doing so well juices are the first things cut out. Restaurants experience a similar decline too especially when people try to eat in more and reduce unnecessary spending.

The regulars

In the beginning, the Juice served customers ranging from regulars to locals and people visiting the area. It was very much dependent on the customers within the vicinity. However to expand their customer base, the Juice has done promotions in local farmers markets and also partnered with other local stores and cafes around the area.

Currently they collaborate with Undefeated, a hip sneaker store in the Silver Lake area. Undefeated carries The Juice products in a small in-store fridge. For this partnership The Juice created a special “undefeated” flavour only available in that store. They’ve also worked with small cafes and coffee shops around the area to expand their local customer base and increase brand recognition. These small businesses are usually close enough that the customers can return back to the original The Juice store however not so close for cannibalization. The Juice has also partnered with Pop Physique and Soul Cycle in order to reach potential health conscious customers.

A quick stop at the Juice post Zumba lessons

Apart from expanding to other local businesses, The Juice is now available on Amazon Fresh. The Juice used to deliver their juices and cleanses to their customers for a small fee, however with the emergence of more online delivery services, it has allowed them to focus on creating a high quality product. This development has enabled a larger reach, as customers who were too busy to go in-store can now reach the product online. Association with a corporation like Amazon has also boosted it’s brand image.

Since starting the business in 2013, one of their greatest reasons for success is the location and the support from the surrounding community. In 2013, Atwater was a hip up and coming place in LA and there were cool new businesses in the area. Melissa and Elizabeth were very much a part of that community so they knew the trends of their potential customers very well. The seized the opportunity to set up in Atwater before the market was saturated with other stores. The neighbourhood has changed a lot since then, with more artisan coffee shops and boutique restaurants.

To the Melissa and Elizabeth expansion is all about timing and knowing the your customers. The neighbourhood needs to be new enough that rent prices are still low and other businesses are beginning to set up. Another great indicator is when there are a few health conscious restaurants who are beginning to be successful. Highland park is the current location The Juice is looking to expand into, it is a location that is starting to experience gentrification and already has a successful vegan donut place and vegan taco place in the area.

Visit the Juice at 3145 Glendale Blvd, Los Angeles, CA 90039

Quality of Life Index

Li Ka Shing, Hong Kong’s wealthiest man started his career as a high school drop out but he managed to grow his wealth alongside Hong Kong’s rapid financial boom. Anything good that has happened to him could be traced back to the fact that he was born in the right country, Hong Kong, at the right time, 1930s. He was not the only one to benefit from his birth, Warren Buffet, probably the world’s most successful investor was born around the same time in the United States. A quarter of a century ago, when The World in 1988 ranked 50 countries according to where would be the best place to be born in 1988, America indeed come top. But the question is, which country will be the best birthplace for the years to come?

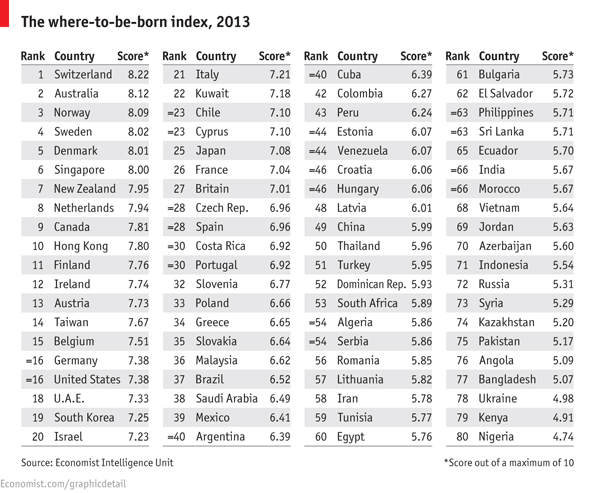
To answer this, The economist has created a comparison of 80 countries which will provide the best opportunity for healthy, safe and prosperous in years ahead. The quality of life index (also known as the where-to-be-born index) links the results of subjective life satisfaction surveys – how happy people say they are- to objective determinants of the quality of life across countries. A high GDP per capita helps more than anything else however it is not all that counts. Things like crime and trust in government institution matter too. Overall, the index takes 11 indices into account, they are varied but all important considerations: some are factors hardly ever change (geography), and others change very slowly (social and cultural characteristics) and some factors depend on political environment and the state of the world economy.

Determinants of the Quality of Life

1. Material wellbeing

  • GDP per person, at ppp in $.

2. Health

  • Life expectancy at birth, years.

3. Political stability and security

  • Political stability and security ratings.

4. Family life

  • Divorce rate (per 1,000 population), converted into index of 1 (lowest divorce rates) to 5 (highest).

5. Community life

  • Dummy variable taking value 1 if country has either high rate of church attendance or trade-union membership; zero otherwise.

6. Climate and geography

  • Latitude, to distinguish between warmer and colder climes.

7. Job security

  • Unemployment rate %.

8. Political freedom

  • Average of indices of political and civil liberties. Scale of 1 (completely free) to 7 (unfree).

9. Gender equality

  • Ratio of average male and female earnings, latest available data.

10. Governance

  • Ratings for corruption

Surprising factors that weren’t included in the index are education levels, rate of GDP growth and income inequality. According to studies, education only had a small correlation to overall life satisfaction however, education levels can also impact political freedom, job security and gender equality.

A forward-looking element comes into play too. Although many of the determinants of the quality of life change rather slowly, these rankings are only a forecast. The2013 index will be for children born in that year and predict the year 2030 when they reach adulthood.

Small economies dominate the top ten places. Half of these countries are european but only one country is in the Euro Zone (Netherlands). The Nordic countries are ranked the highest whereas European economies with high unemployment rates lag behind (Greece and Spain) despite their advantage of a warm climate.

America, the number 1 country to be born in in 1988, is down in 16th place, despite their huge economy and political freedom, babies born today will inherit large debts of the boomer generation. None of the large manufacturing countries such as Brazil, India or China scored very impressively.