The Significance of Three Percent

Port-of-LA-logo

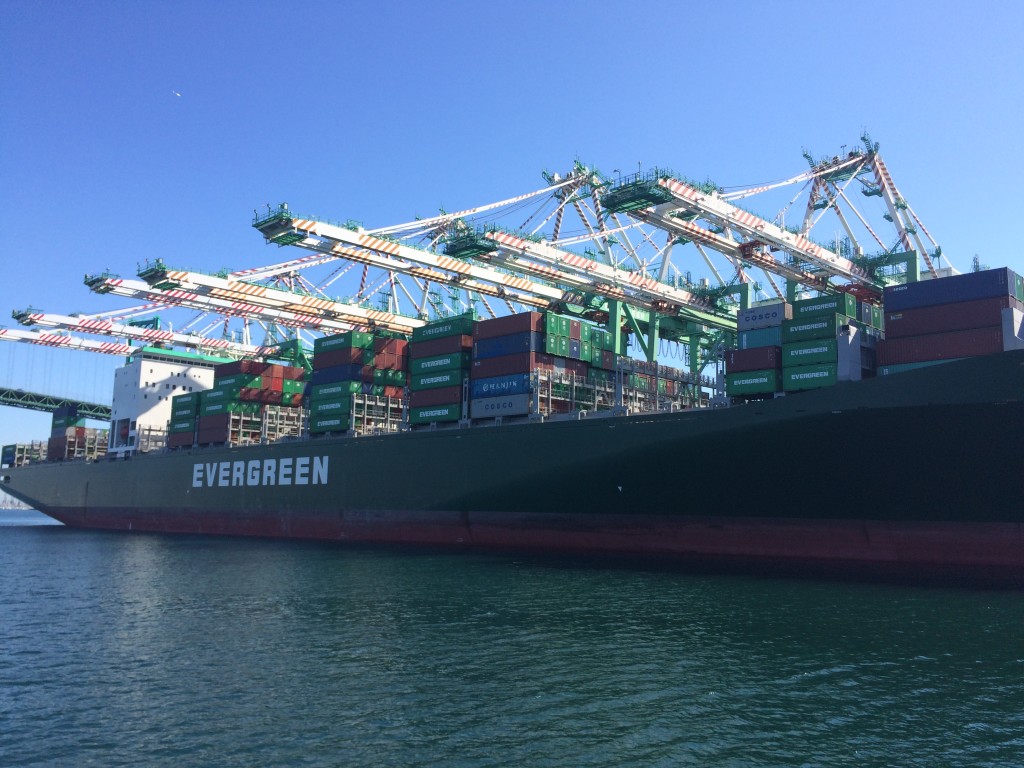
The field trip to the Port of Los Angeles solidified a number of the concepts we’d discussed in class with respect to international trade, but one particular aspect left me with more questions than answers: security.

Even with the massive number of containers being unloaded off multiple cargo ships, the port included only one relatively small area in which the contents of containers were checked. Otherwise, they were stacked, and loaded as efficiently as possible to get them onto trucks to have their contents distributed as quickly as possible.

According to Rep. Janice Hahn (D-Calif.), who introduced legislation that would reserve federal funds to improve port security, only three percent of incoming cargo is scanned.

With the passage of the Trans-Pacific Partnership, which will further open up US trade with other nations along the Pacific, west coast ports are likely to see a surge in traffic. Does that mean three percent turns into two or one?

Hahn’s Scan Containers Absolutely Now Act, commonly (and fortunately) known simply as the SCAN Act, was introduced in the House a little more than a year ago and, from a brief news search, was never heard from again. Despite the ridiculous name, the bill points to a very real—and thus far, unaddressed—issue.

We spent two hours touring and having multiple people tell us how critical the port is to the US economy and, by extension, the world. A trade agreement that will increase the amount of traffic to the west coast’s busiest ports has been passed just ahead of what is already the ports’ busiest time of year.

Did I mention that more than 95 percent of containers passing through ports go completely unchecked?

Given the US’s often frosty relationship with growing economic power China, that country’s increasingly friendly relations with its neighbors (see: Regional Cooperation Economic Partnership) and rising global tensions that include what basically amounts to a proxy war with China’s neighbor Russia, is it really that far-fetched to think that negligence on port security might be an actual problem?

Of course, authorities assuredly have security measures in place that are invisible to the public, but given the fact that local legislators felt the need address it in Washington, it seems that an issue may remain.

It just seems from the outside that the level of oversight doesn’t match the relative importance of the ports to global trade. Given the short-sightedness of most legislators, that seems unlikely to change.

The TPP and the Port of Los Angeles

2015-10-13 10.49.17On October 5th, 2015, the United States and eleven countries in the Pacific Rim finalized a trade agreement after five years of negotiations. Since the release of information surrounding the agreement, many people now know it contains a range of international trade issues including comprehensive market access. According to the Office of the U.S. Trade Representative, the Trans-Pacific Partnership will eliminate or reduce tariffs and other trade barriers in order to create new trade and investment opportunities for businesses and consumers.

Seaports, which constitute a major part of the U.S. economy when it comes to exports, have the potential for the most growth from the reduction in tariffs. The American Association of Port Authorities says for every additional $1 billion in exports shipped through U.S. seaports, U.S. jobs increase by 15,000. The Port of Los Angeles, for example, has a special position as one of the major ports connected with Asia and the Pacific Rim. Michael Keenan, the director of planning and strategy at the port, believes services industries at Long Beach and in Los Angeles as a whole have a positive future ahead as trade rises.

“There are about 15,000 longshore workers that support the Port of Los Angeles and Long Beach,” said Keenan. “On top of that, there’s a huge number of railroad, warehouse and logistics workers. Trade through the port supports about 190,000 jobs in the region and under an engrossed growth scenario with the TPP, we see that number going up.”

Before the Great Recession, exports coming into Long Beach were growing at 10 to 12 percent. The financial crisis brought cargo activity down to about 3.5 to 4 percent. Keenan looks at the TPP as a way to not only boost cargo activity, but the amount of jobs in the city of Los Angeles.

Another interesting part of the Trans-Pacific Partnership was the exclusion of China from the negotiations. Although China is a major trading partner with the U.S., Keenan does not think the TPP will have an effect on trade with the Asian country. However, there could be greater opportunities for smaller countries in the region.

“I think a lot of China’s neighbors are interested in being part of an agreement that offers them a set of advantages against China.” said Keenan. “If you’re trying to be competitive against the big dog on the street, the best way to do it is to find a set of friends who have that same interest. It offers our other friends in Asia a closer relationship with the U.S., which helps us.”

Despite the positive results of the multi-part agreement, there are some downsides to the TPP in relation to the ports. The U.S. economy continues to grow stronger, but its trading partners’ economies have grown weaker and it makes goods from the United States less competitive in the global marketplace.

“I think that’s the bigger challenge. Something like TPP that offers offsetting advantage could certainly help us, but the biggest driver for exports is going to be shared growth where other countries develop stronger economies and they can buy more of what this country produces. I have high hopes we’ll be able to see that within the next five to ten years.”

The Olympics Indicator: It’s More Than Just a Sports Event

This just in: Los Angeles could become the only city to host three Summer Games other than London.

With the 2024 Summer Olympics nine years from now, Los Angeles was chosen Tuesday to be the new official U.S. bidder for the Games, replacing Boston after the city’s campaign surrendered to local opposition.

COLLISEUM-1-superJumbo

(The Los Angeles Coliseum/Source: The New York Times)

When we talk about economic opportunities related to sports events, we usually think of vast investments in sports venues, infrastructure, public transportation, and human capital, etc. However, historical data reveal that the Olympics hosting right has been an economic indicator of stock markets.

A study conducted by Bespoke Investment Group shows that under most circumstances, stocks markets rally during the Summer Games because investors are mostly distracted from gloomy headlines. Most of the times, the so-called Olympics Indicator is found to be a leading indicator of a rising stock market.

The study included the performance of the Dow Jones Industrial Average during the Summer Games since the 1900 Paris Olympics. It also calculated the market performance of hosting countries during the games since the 1984 Los Angeles Olympics.

The claim that investors are distracted by the games appears to be a little bit bizarre. However, from 1900 to 2008, the DOW had an average gain of four percent and the index was positive two thirds of the time. Therefore, if you buy $10,000 worth of stocks on the day of the opening ceremony and sell all of them on the closing day (that’s usually 14 days,) theoretically you can earn at least a brand new Apple Watch.

What about the stock markets of host countries? Since 1984, only two out of seven games have seen a negative growth in host countries’ stock markets. Both cases occurred because they were right in the middle of the dot-com bubble and the 2008 financial crisis, respectively. The average gain was 1.86% according to past performance of stock markets.

olympicsbespoke


(Source: Bespoke Investment Group)

Even though there is no strong evidence showing a causal relationship between the Olympics Games and stock markets, it can be drawn from historical data that stock markets tend to perform better during the games. That’s partly because markets gain a sense of optimism and counteract the negatives in most years.

For investors seeking short-term profits, don’t just sitting in the couch watching the games. The Olympics Games can be an indicator for a positive market. Buying some Nike or Adidas stocks may be a good decision.

Sources:

USOC names Los Angeles the official U.S. bidder for the 2024 Summer Olympics

The Olympics Indicator

The Buttered Popcorn Index – A Deliciously Twisted Look At Economic History

movie_theaters_68947In an age where streaming movies on Netflix or Hulu has become the norm, many people assume the movie theater industry is a dying relic of a more financially stable time.

Every year, Hollywood releases reports blaming mediocre films for turning audiences away. Other people in the media think the industry is failing because younger generations are less interested in the big screen experience. Unfortunately, most of these reasons lack any statistical support.

The movie theater industry follows a rollercoaster-like business cycle that reaches its peak during different periods of time much like many sections of the U.S. economy. However, the unique characteristic of the movie theater business is that it thrives when most businesses are struggling to survive.

This is the Buttered Popcorn Index.

Throughout the history of U.S. cinema, there has been a trend in movie theater attendance as it correlates with the economic climate in the country.

During the Great Depression, the film industry had to cut costs in production and theaters had to lower ticket prices. This led to an enormous surge in the film industry with roughly 60 to 80 million people heading to the movies each week.

In 1982, movie theater attendance climbed 10 percent while the unemployment rate increased at a similar pace. However, as the economy healed, attendance dropped about 12 percent.

Screen Shot 2015-09-01 at 8.56.58 PM

Now let’s look at our most recent recession. In 2008, the movie theaters earned roughly thirty million dollars less than in 2007. In 2009, the summer box office had an enormous spike in ticket sales after declining in 2008. The chart above shows how, between 2008 and 2009, theaters earned over one hundred million dollars more than 2008.

Screen Shot 2015-09-01 at 8.57.19 PM


Movie theaters have not been able to maintain the 1.42 billion people they brought in during the rescission. The Hollywood Reporter released statistics in 2014 stating the number of people going to the movies had dropped six percent from 2013, which was the lowest in twenty years.

Ticket prices have played a large role in how people perceive the movie theater experience. Between 2001 and 2015, The price for move tickets increased from $5.66 to $8.12. The prices have blown up dramatically within the last fifteen years, yet there were more people going to the theater in 2009.

One of the main reasons why movie theaters had a surge during the recession was because even with the rise in prices, tickets have remained below ten dollars. Therefore, when times are tough for people, less of them look at going to the movies as an expense and more as one of the few remaining affordable options for entertainment.

“Generally, when economic downturns hit, we have seen an increase in box office and attendance in six of the eight last recessions,” said spokesman for the National Association of Theater Owners Patrick Corcoran in an interview in 2011,  “People seek relief in forgetting their problems, so they go to the movies, and it is the least expensive form of entertainment.”

Another reason for the success of the movie theater business in 2009 was the types of movies being released. Happier films like Pixar’s Up and the comedy film The Hangover raked in close to $300 million each during the summer months. This suggests many people were looking for an inexpensive way to enjoy themselves in a tough economic climate.

The Buttered Popcorn Index demonstrates that no matter what era it is, people tend to flock to movies to escape the realities of their financial situation.

The Plastic Surgery Index

When hearing the word economy, any keyword that is related to finance, such as “GDP,” might pop into your head, but what about the phrase “plastic surgery?” A few years ago, economy was exclusively linked to plastic surgery when the American Society of Plastic Surgeons (ASPS) revealed its statistics.

In comparing the numbers from 2008 to 2009, the ASPS found that the total number of cosmetic procedures fell 1 percent and the surgical procedures fell 9 percent. These statistics created a correlation between the U.S. economy and plastic surgery, and thus the Plastic Surgery Indicator was born.

During times of economic instability, people cut down unnecessary spending as their first priority, and plastic surgery appears to be on the top of the list. The total number of plastic surgeries fell during economic hardship, but when the economy is rising, the total number of surgical procedures also rises because people have a restored confidence in the market.

In 2011, 13.8 million cosmetic plastic surgeries, including surgical and minimally- invasive, were performed in the U.S., which is a five percent increase from 2010, according to the American Society of Plastic Surgeons.

“While the rate of economic recovery in the U.S. is still uncertain, 2011 proved to be a good year for plastic surgery,” said ASPS President Malcolm Z. Roth, MD. “Consumer confidence was up, auto sales rose 10 percent, so it is not surprising that we would also see increased demand for plastic surgery procedures.”

However, if you only focus on the total number of surgical procedures that were performed each year, a large part of the indicator is being missed.

In 2011, the total number of surgical procedures was 11.5 million, 2.1 of which were invasive cosmetic surgical procedures, such as breast augmentations and facelifts. In 2013, the total number of surgical procedures was 13.8 million, and only 1.58 of which were invasive cosmetic surgical procedures.

Even though the statistics from the American Society of Plastic Surgeons show an increase in the total number of surgeries from 11.5 to 13.8 million, it shows a decrease in the number of invasive cosmetic surgery procedures from 2005-2011.

If less invasive cosmetic surgeries were performed, you may be wondering how did the total number of cosmetic surgeries increase? Minimally invasive surgical procedures are the answer.

Due to the fact that people have less discretionary income to spend, people are more willing to pay for minimally invasive cosmetic surgeries– such as botulinum toxin, which means injecting Botox and Dysport to the face in order to reduce wrinkles– as opposed to spending it all on invasive cosmetic surgeries– such as nose reshaping, which is expensive.

Overall, we know that when the economy is good, more plastic surgeries are performed, which is a good general measure of consumerism in the economy. However, looking at the number of minimally cosmetic surgeries is an even more precise way to predict the economy than the total number of cosmetic plastic surgeries in the future.

Chonieconomics: The Men’s Underwear Index

Throughout the course of history, people have been caught with their pants down (so to speak) on various occasions by shifts in the economy—some sudden; some cyclical. Little did the gentlemen among these folks know that underneath said pants, was one of the more obscure metrics tracked as an indicator of the relative health of the economy.

The Men’s Underwear Index is, apparently, a real thing. So said Alan Greenspan in the 70’s.

underwear index_9 3

The orangutan, the zebra and the stork clearly lived in economic prosperity.

As we’ve discussed in class, economics often gets a bad rap because many people’s exposure to it consists of a bunch of old, white guys on TV talking about the most widely used economic indicator—the stock market—in what sounds like an alien language. However, despite it including the synthesis of a lot of real-time information, the stock market is a leading indicator (a measure of what people think is going to happen) and is, by nature, speculative. To some extent, the talking heads on TV are guessing, and they know it.

Chonies as an indicator, on the other hand, are referred to as lagging. (I know…sorry, gents.) A lagging indicator is simply a compilation of data points from what has already happened—in this case, purchases of men’s underwear. This empirical measurement has been a fairly solid indicator of what has happened with the economy since it came into existence almost half a century ago.

Per Esquire (repurposed from Business Insider), men purchase an average of 3.4 pairs of underwear per year. That number has tended to increase in times of economic prosperity and decrease in difficult economic times.

What I don’t understand is why this is considered some genius insight. It makes sense that in a down economy people would not spend money, primarily because they don’t have it.

The best explanation I’ve been able to find is that underwear is deemed a necessity, which sets it apart from other clothing items and makes it a better baseline. That hasn’t stopped economists from developing other obscure indicators as well. Hemlines, dry cleaning, ties and lipstick have all been referenced to measure the health of the economy, but the common thread through all of them is that people purchase more when the economy is good and they have the money to do so. Regardless of what CNBC analysts tell you, it’s as simple as that.

Greenspan trolled us all, but I suppose I should thank him. He gave me a reason to write about underwear in a class blog.

Optimistic Farmers Look Past Index Prices

When Farm Prices are low, farmers aren’t necessarily pessimistic. Farm Futures’ first survey of 2016 demonstrates that farmers are eager to plant more crops on their acreage no matter the circumstances.

At the beginning of this month, the Department of Agriculture released an index of prices received from farmers for their current month.  This index measures crop prices, livestock, and product prices. The outcome is farm prices – m/m % change is down -1.9% with an overall -5.7% and farm prices – y/y% change is down -7.1 with and overall -10.0%. The drops in numbers are mostly because of poor weather conditions earlier in the year.


graph 2

Though the chart tells the public one thing, farmers express another.

Like the economy, there are many factors to farming that can affect its status. According to the article Farm Futures’ 2016, planting intentions survey shows low prices won’t deter grower’s conditions. Bad weather that occurred last fall interrupted crops like the red wheat in the Midwest. Wheat grounds in other areas could shrink, with farms predicting only to plant 40.4 million acres in the fall, which are about 220,000 lower than last year.

“While profit margins remain in the red, farmers are reluctant to cut acreage, knowing that volatile crop prices can turn around quickly if weather problems emerge,” said Farm Futures market analyst Bryce Knorr, who conducted the survey.

Even though the percentages of farm prices are low, the survey mentioned earlier, Farm Futures’ first survey of 2016, gives a different attitude for agriculture.

After farmers took this survey, it showed that they plan on planting 89.65 million acres of corn which raises the number 1% from 2015. Soybeans could have a jump in growth as well. The report indicates that Farmers would like to plant 86.32 million acres of soybeans, which raises it 2.4% more than was previously estimated.

The fact that farmers are finding other ways to be productive, even though farm prices are low, gives the future hope. Even when the market is not doing the greatest, it does not necessarily mean it will stay that way. Food is a basic necessity that humans need; therefore food products are extremely important. Farmers and economists know this and that is what makes The Farm Prices graph so interesting. Obviously, farming will continue and more products will be created no matter what the economy looks like. Farmers’ eagerness to expand their product and invest more in other produce is a sign of adapting to the economy and its demand.

What chart should I keep my eyes on?

To sell or not to sell.

Business Insider publishes every year the list of The Most Important Charts in the World .

To put up the list, they ask some of the world’s most influential analysts, economists, hedge-funders and traders one question: What charts are you always keeping your eyes on?

Almost all the answerers – 50 experts in economy – give a different answer. And that does not make an ordinary reader like me wiser.

I believe the 50 professionals – among them Nobelist Paul Krugman and Bloomberg’s chief economist Michael McDonough – follow more or less the same economic indexes, but what is the most important for each, depends on the job they do and the decisions they have to make.

So there is no such thing as the most important chart in the world.


I have not really been keeping my eyes on any economics chart, but now I am about to sell a hut. It is a tiny seafront cottage in my hometown Helsinki. It is surrounded by 100 other tiny cottages in the area that used to be a recreational place for city’s policemen and public transit workers.

At the turn of the millennium the city of Helsinki, who owns the land, decided that it was time for all the residents of the city to enjoy this place. Anyone living in Helsinki was allowed to buy a cottage from the area – if somebody was willing to sell.

I was one of the first “outsiders” to buy one. I bought it from an old constable’s widow for €6,000. I was lucky. The area is charming and prices of the huts soon started to go up.

Last year one of my neighbors sold her hut for €50,000. Another sold his for €38,000.

I did not consider selling mine until this August. My study year in California turned out to be more expensive than I expected (this is why).

The question is now: should I sell it or wait until later? What chart should I keep my eyes on?


I looked again at the Business Insiders most recent list of ”the most important charts in the world” (February 2015).

None of those indexes seemed to relate to my situation – except for Eurozone charts that showed that the economic situation in Europe is nothing but deteriorating.

As I need the money, I decided to follow my instinct with help of one chart.


Consumer Confidence Index (CCI) is measured world wide and ”based on households’ plans for major purchases and their economic situation, both currently and their expectations for the immediate future”, as OECD explains it.

In the U.S. the consumer confidence went down the first half of the year 2015 but increased during the summer months.

In the Euro area the confidence was increasing the first four months of the year but has since decreased. Finland’s figures are in line with the European ones.

Every month national center of statistics interviews 1200 Finnish consumers and compares their opinions to a ”normal” state. Long-term median value of the CCI in Finland is 11,8.

In June 2015 it was 10,8. In July it was 6,9.

With this in mind I figured that I should sell my cottage for any price as fast as I can, before consumer confidence is in zero.

However, when comparing to last year’s index, the CCI shows that confidence is in fact increasing. In August 2014 it was only 2,2.

When taking closer look I realized that opinions varied a lot. According to the most recent CCI 30 percent of the Finns believe that the economic situation of Finland will get better in year’s time. 27 percent believe that it will deteriorate.

What can I learn from this?


I do not think consumers are well-informed with the economics. In my opinion media fails to tell about money and markets comprehensively, and even the best economists fail to predict the future.

However, economy are not just facts. It much about trust and feelings.

When one consumer reads that – according to the CCI – other consumers are gaining confidence in the economics, he might think that: yes, it is time to buy the hut of his dreams.

And I am the one to sell him that.

There still might be people who have courage to buy a trendy cottage for a good price.

American Cable Network To Develope Web-TV Services and Expand Into International Markets

Tencent's Digital Media Marketing Department manager gives speech regarding the collaboration between HBO and Tencen Video (v.qq.com)

Tencent’s Digital Media Marketing Department manager gives speech regarding the collaboration between HBO and Tencen Video (v.qq.com)

Web-TV service, such as Netflix and Hulu Plus, is growing rapidly, which has forced pay-television network HBO to release its own online-streaming services and step further into Asian market: to distribute TV dramas and movies through the Chinese Internet giant’s online video.

Globally, different from Netflix that directly launches its service in foreign countries, HBO licenses its programming to Tencent, a famous investment holding company whose services include social network, mass media, e-commerce and online games.

Its new deal with Tencent hasn’t disclosed the financial details or broadcast schedules. According to Wall Street Journal, HBO’s international business accounts for about one-quarter of the company’s $4.9 billion in annual revenue. And last year, it added 10 million users overseas, which is twice as many as HBO and Cinemas added domestically in the past decade.

Nonetheless, customers outside of the U.S. pay much less money than Americans for HBO’s programs, which, in other words, the company doesn’t generate a lot of revenue from licensing its programming.

Besides, the Chinese government censorship and local competitors – Youku Tudou Inc. and some internet-pirate sites – still make people feel uncertain about HBO’s future in Chinese market. Bloomberg reporter Xin Zhou said that a pay-to-view channel run by China’s state broadcaster CCTV aired a cut version of “Game of Thrones.” To maintain the program quality and satisfy the viewers without provoking the government seem to require a longtime negotiation among different parties.

HBO Go: An online-streaming site that is only available in the U.S.

HBO Go: An online-streaming site that is only available for cable subscribers in the U.S.

Thus, as HBO is shifting its sights on international markets, it’s also ready to create a broadband-only service, which further disrupts the pay-television industry.

In the U.S., since it has to split the revenue with cable distributors, HBO finds it’s getting tougher to profit and dominate the market with current business model. Netflix charges subscribers $7.99 to $11.99 per month, while HBO charges $13 to $15 per month. Although Netflix’s total subscribers were not even half them of HBO, its subscriber revenue inched past that of HBO in the second quarter of 2014: $1.146 billion compared to $1.141 billion for HBO.

Also, HBO didn’t plan to offer its online services to non-pay-television subscribers until Time Warner Inc. CEO Jeffrey Bewkes announced on Oct 16, 2014 that HBO will offer its own online-streaming in 2015. This announcement immediately led TWX stock to soar 8.7 percent.

TWX stock soared 8.7% in just over 30 minutes

TWX stock soared 8.7% in just over 30 minutes

The online-streaming service will bypass the cable middleman and deliver the shows directly to the viewers. It aims to adding 10 million broadband-only users who consume video online.

HBO’s series of plans do provide an alternative for cable providers.

What does the 10-year visa for China mean to the Americans?

A policy change that will enable U.S. and Chinese citizens to visit each other’s countries repeatedly within 10 years has been announced at the conference of world leaders in Beijing; and it has been already gone into effect. Business and short-term visit visas, which used to expire after one year, will be valid for 1o years and allow a larger number of population travel back and forth between the U.S. and China.

In 2013, 1.8-million Chinese visitors came to the United States and brought an estimated $21.1 billion to the economy.  The Federal government predicts the economic impact of the loosened visa restrictions could be $85 billion by 2021, according a white house statement reported by the Los Angeles Times.

ChineseTouristinUSMajority of the media coverages focused on the economic spur the incoming Chinese tourists may bring to the States. Nevertheless, few wrote about the other side of the story: the policy change will also have an effect on the U.S. citizens’ visa for China. The new 10-year visas available to US passport holders will make travel to China easier for those who qualify.

A policy making process sometimes is the joint-consideration of both international relations and market demand. In the case of the 10-year valid visa, it seems like the policy shift may have something to do to with China’s inbound tourism industry. Unlike the large surplus on manufacturing, China’s tourism industry has been suffering deficit ever after 2009. The deficit pushed the local travel agencies and accommodation providers to price their service lower, sometimes even lower than the cost, to keep the business running.

ChinaTravelServicesDeficit

It may not be just a stereotype for Chinese to picture the U.S. visitor as spenders. According to a report from BBC, the travellers from the United States were actually the No.2 travel spenders in Asia, closely followed by Germans.

_70431258_asia_outbound_travel_624-03

At the same time, foreign tourists have slowed down their adventures in China. In the year of the 2008 Beijing Olympic Games, the number of the foreign tourists in China reached its peak at 6.15 million. Since then, the number has been shrinking, though it did bounce up a little bit in the year of 2010. The United States of America-China Chamber of Commerce (USCCC) said in a statement that the relatively high standards for L visas are one reason Beijing has seen declining tourism numbers. Programs such as 72-hour, visa-free travel to Beijing have not been sufficiently easy or welcome to make the city attractive as a destination.

foreign-visitors-in-china-from-the-first-half-of-2008-2013million

The USCCC also clarified some requirements in order to obtain the new 10-year visa. In order to qualify for 10-year visas, US passport holders must have more than one-year validity remaining on their passport. And, each entry will only be good for 60 days.

“As international relations can change quickly without advanced notice, we urge you to take advantage of this new policy and apply for your China visa at your earliest convenience. In addition, if your passport expires in less than one year, we encourage you to consider renewing your passport,” said the USCCC in their website post.

It is uncertain, but worth expecting a growing number of tourists from the States coming to China for visits. As predicted by Huffington Post blogger Kathleen Peddicord, “the boom will bring more and more higher-end choices.”

However, according to Peddicord, “the biggest challenge to travel in this region is language”. It is normal that desk clerks in local small hotels, cab drivers, bus drivers, waiters, and sales speak no English at all. And it could remain a long-term challenge for the Chinese tourism industry to equip with the level of service to satisfy the international travellers.