You have probably heard the old saying, “One man’s trash is another man’s treasure,” more times than you can count. When I hear it, I think of uncovering some gem at a garage sale or, as my roommates in New York once did, finding perfectly usable bunk beds stacked on the curbside trash pile. But, would you ever consider using trash as a tool to measure the strength of an economy?
Economic indicators consist of wildly varying selection of measures, but one of the most well known measures is a nation’s GDP or Gross Domestic Product. The GDP measures the size of a nation’s economy. One major component of GDP is how much stuff people consume. Organizations track this by keeping tabs on the sales numbers for basic items such as clothes and food, and all the way up to large ticket purchases such as homes and cars.
The US definitely loves buying stuff. Consumption made up about 68% of the American GDP in 2014, according to the World Bank, which makes it by far the strongest and heaviest member of America’s economic family. And what’s the natural by product of our America’s insatiable appetite for stuff? Well, that would be waste. This leaves us with an obvious question: can we look at the amount of waste we produce to learn how our economy is performing?

Back in 2010, Bloomberg economists Michael McDonough and Bob Willis investigated that very question. No, they didn’t go around weighing garbage bags or following trash trucks. Instead, they measured how many train cars of trash traversed around the country. The American Association of Railroads tracks figures on the amount of steel and iron waste created, as well as municipal waste that cities, such as New York and Seattle, throw on trains headed out to landfills in other states.
They learned that by looking at these numbers one could determine growth or shrinkage of the economy. Bloomberg studied a period beginning in the first quarter of 2001 until the same period in 2010, and found that the number of cars carrying waste had a correlation of .82 with the growth of GDP, meaning that they grew in a nearly synchronized manner. Makes sense right? The more things created and consumed, means more things that are replaced, go bad or end up as leftovers in the process.
This chart, from Bloomberg in 2012, illustrates the strong relationship between our trash and our GDP dating all the way back to 1994:
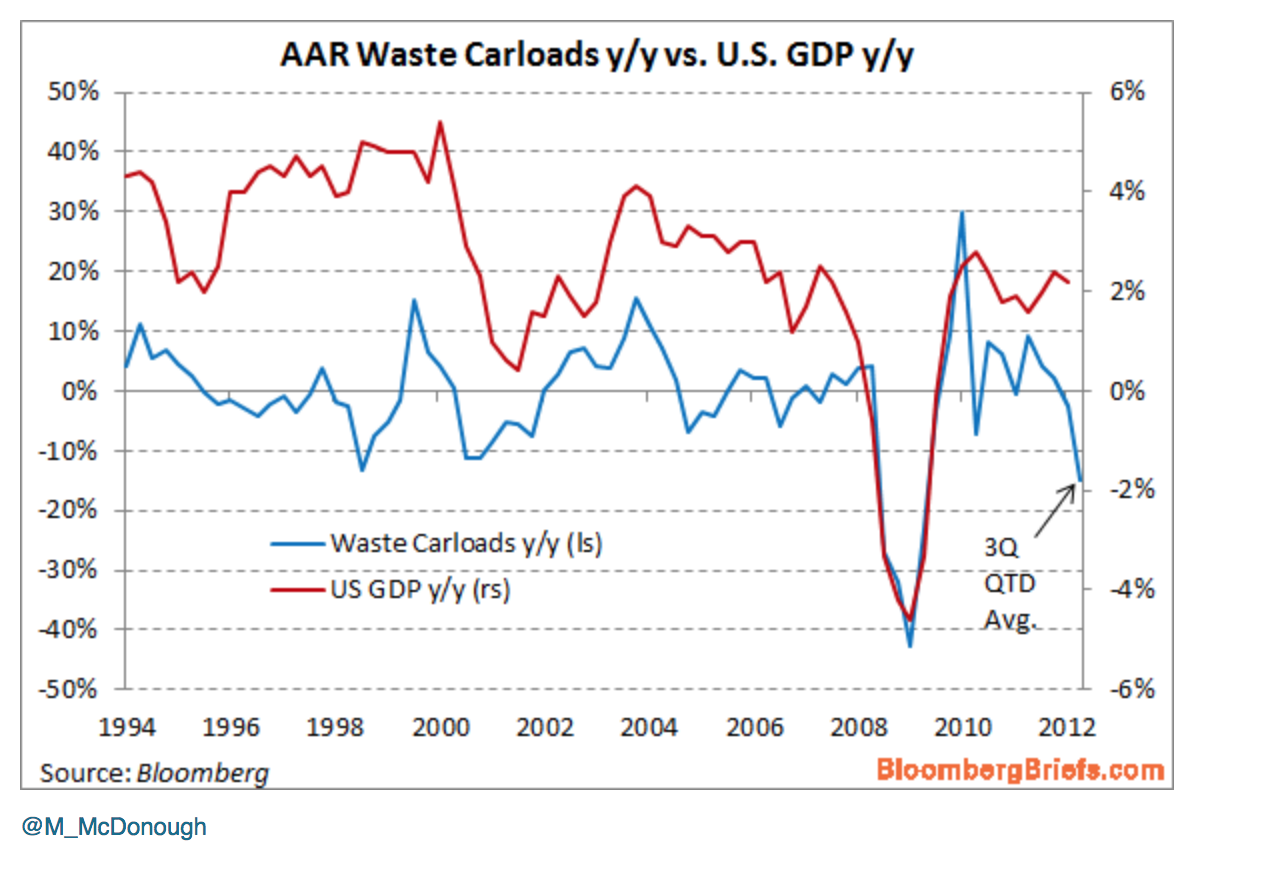
In a 2012 interview with Market Place’s Kai Ryssdall, McDonough described why measuring waste gives such insight into the growth of the economy. He said, “It’s holistic because it’s not isolated to a single part of the economy. It’s people throwing things out, it’s buildings being demolished — it’s everything… I mean, if you’re going to build a new building, there might be a building that’s already there. If you buy a couch, you might be throwing out an old couch. If you go out to McDonald’s and you buy something, you’re going to throw something out. ”
The only problem with this measure is that looking at waste will not tell you much about the future, but instead about what’s already happened. As waste comes about as the end product of consumer decisions. Even McDonough admits, “it’s more of a lagging indicator.” Though the AAR’s figures do become available before the BEA can calculate our GDP. So a slight advantage does exist for the particularly ardent trawler of trash stats.
Sadly though, it appears that anyone hoping to amass a fortune from tracking trash probably won’t uncover too much treasure.
Leave a Reply
You must be logged in to post a comment.