More than just Marihuana, It’s a Business

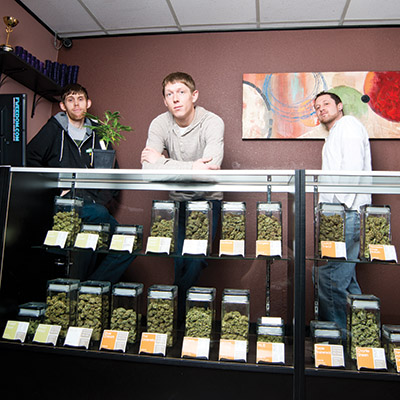
The Medical Marijuana industry has been a controversy in the United States for years.  It is a touchy subject that maybe an old man and his son would get in an argument about because of the interesting changes that have taken place through the generations. However, many are making an entrepreneurial leap of faith and creating Medical Marijuana as a business that thrives. This is the case for Nate Taylor who is a Seattle native and has spent the last five years in the industry with his Medical Marijuana Company called Fweedom Collective. Nate has done more than create Fweedom Collective as a well-known million dollar business in Seattle. Fweedom Collective has benefited consumers, the city of Seattle, and influenced the legal changes that are being processed today.

Three years ago recreational Marihuana was legalized in Washington State. Since then, the government has started to regulate the Medical Marijuana by joining it with Recreational Marijuana and push it all into one system. Before the law was passed, Medical Marihuana was only loosely regulated. Though this may seem beneficial for Nate’s business, it has definitely takin a toll on the company.

On Sunday, September 13th, I gave Nate a call. It was 12 P.M. and Nate answered to the sound of a football game, Seattle Seahawks vs. St. Lewis Rams, which was playing in the background. Nate is an avid Seahawk fan who attends the games frequently.  The Seahawks were down by nine points, It was the third quarter, and when asked if the Seahawks would come back he said, “Oh, for sure!” While the game was still playing he was more than willing to answer the questions I had for him, with an occasional burst of excitement or dismay from the game.

Many economists are probably wondering: has the Medical Marihuana industry been impacted by cyclical or secular shifts? When Nate was asked this question he said that the answer was most likely secular. If the economy goes down, people don’t stop spending money on the product, it is a necessity to them. However, they may buy less of it at a time.

With the economy changing and new technology constantly being developed, businesses have to adapt. Nate said that over the last few years Fweedom Collective has had to make some beneficial changes. It increased its Search Engine Optimization, worked on improving and creating more online orders, and developed different apps that profit the company. The business also increased its hours of operation due to demand. Nate noticed early on that people get off work later and by creating longer hours improved sales. These changes helped Fweedom Collective stay on track with today’s basic needs for consumers.

Seattle is a booming city, and many businesses have either expanded or moved there for better opportunities. Some of these big local businesses are Amazon, Expedia, T-Mobile, and Microsoft. Nate mentioned as long as these companies are prosperous, steadily growing and no economic down turn, the city benefits, including his company. “As crazy as it sounds”, Nate said. “When professional teams in Seattle perform well, spending has increased at Fweedom Collective.” After the Seahawks won the Super bowl in 2014, sales dramatically went up at Fweedom Collective.

Of course being in the Medical Marihuana business is not easy, especially since it is loosely regulated. Mentioned earlier, Recreational Marihuana was legalized in 2012, though this might seem like it would benefit Fweedom Collective right away, it actually has presented many challenges. “My industry is at the end of an area, the probation of Marihuana, therefore making it a grey area,” Nate continued, “a lot of changes are being made.” Even though the law was passed over three years ago, the government is still in the process of making regulations for recreational Marihuana and should be resolved by 2016. With no heavy guidelines, many smaller recreational businesses have entered the market and have changed the prices of products. He elaborated on how he has seen products that were priced at $13 drop to $10. “We constantly have to change prices and adapt to the environment around as more businesses are evolved,” Nate said. He also believes many of these stores are in it for the money and only want to be open for a short period of time. In July of 2016 Recreational Marihuana should be fully regulated.

In some cases today, the economy does not look at Medical Marihuana as a legitimate business. Therefore interest rates or access to capital do not play a major role in Fweedom Collective, for consumers anyway. The company only takes cash or credit cards. Nate mentioned that he could get a loan through his business if necessary. However, what affects the company the most is business loans because banks and financial institutions will not grant them to a business like Fweedom Collective. Nate said its loans come from private investors. Most likely when regulations are officially submitted for Recreational Marihuana, banks will be more willing to loan money.

The most surprising news that can be learned from this interview is the impact Fweedom Collective has had on the community it operates in. Nate elaborated on the positive impact the company has on its small location north of Seattle. “With our business being there it has helped the neighborhood out a lot, cleaning it up, put illegal deals off the streets and into a legal business, and crime rates have dropped.” Nate also mentioned his business has brought money to an area that was demolished and made it more commercialized.

After eight years, Nate Taylor and two of his coworkers, Sky Nielsen and Tyler Godfrey, took an idea and brought it to life. Now at 28, Nate is a successful business owner who is looking to expand in other areas. Though his business is succeeding, the Seahawks are not. They lost 31-34 to the Rams.


nate


The Big Mac Index: A Hungry Economy, to go

MMM1The Big Mac index was invented as a lighthearted guide to whether currencies are at their “correct” level. Based on the theory of purchasing-power parity (PPP), the index follows the notion that in the long run exchange rates should move towards the rate that would equalise the prices of an identical basket of goods and services (in this case, a burger) in any two countries.

Drawing on the example from the The Economist, the average price of a Big Mac in America in July 2015 was $4.79; in China it was only $2.74 at market exchange rates. So the “raw” Big Mac index says that the yuan was undervalued by 43% at that time.


Never intended to be a precise gauge of currency misalignment, the Big Mac Index has announced itself as a global standard for countries to position themselves in the world through the value of their currency. This could bring some joy to the office of the new CEO of McDonald’s following the fall in revenue by 11% in the last quarter.


MMM5


The figure above provides a detailed summary of the Big Mac Index. For example, South Korea, which lost its value against the dollar post 2000 has been on a downward trend and has been significantly devaluaed to 21%. So what does this mean? Well, devaluing the currency decreases the exchange rate of the South Korean Won against the dollar. Hence one dollar can now buy more of the Won. This has a direct impact on the both the economies. It would decrease the value of South Korean goods, making them competitive in the international market, increasing exports from the country and increasing imports in the United States, and worldwide. Simultaneously purchase of foreign goods is more expensive decreasing exports in South Korea. This directly sponsors growth in the economy through increase in net exports. This practice seems relevant to economies that are looking towards growth, for example developing countries. Hence through the chart we can confirm that Russia, India, China and South Africa, four of BRICS countries are focused on aggressive growth. Yes, from the looks of it even China.

For individuals like me, who come from India and other Asian countries to United States, we will have more of currency shock than culture shock. With 1$ woth Rs.66, I am having trouble managing my expenses, so good luck to those students coming to United States for studies. For now, I am considering on going back to India and saving on those precious dollars.

Sources:

http://www.economist.com/content/big-mac-index

http://bigmacindex.org/

The Economic Indicators on Fast Food in America


It is no secret that Americans love their fair share of fast food. Whether it’s sugary donuts or greasy burgers, Americans are suckers for fast food of any kind, hence making us the number one biggest consumer of fast food in the world. So what are some fast food economic indicators?

5851279-fastfood

According to “The Economist” magazine, during economic downturns, fast food restaurants across the country surprisingly do well amidst the downfall. Fast food restaurants did much better than pricey, more sophisticated restaurants during this period of time. This is because people would want to spend as little money as possible during these downturns, and thus choosing the less expensive food over costly ones. In the event of when long term recession makes even fast food restaurants fail, these fast food restaurant chains can still continue to survive by cutting their prices and do more advertisements across the country.

Contrary to the last paragraph, no amount of cheap food can stop some people from eating at home to save money. During the 2008 recession, unemployment rates were at an all time high, thus fewer and fewer consumers were dining out. This led to the merger of Wendy’s and Arby’s, which expanded the market share of both fast food chains, making it the 3rd largest food chain in USA. Due to this merger, the fast food chain also increased its costumer base, pulling consumers from 2 different fast food chains into 1. Therefore, I will not be surprised if more fast food chains do a merger in the future if there is ever going to be a recession again, as it will benefit the chains during this period of time.

Due to the health kick that everyone is in lately, consumers began to demand fruits and vegetables to be included in the menu of fast food restaurants. More and more Americans became more picky when it comes to the food they eat and the calories they burn each day. There was a sudden increase of menus with healthier options in well known fast food restaurants such as McDonald’s and Chickfila. They began introducing salads and fruit cups into their menus, some restaurants even began serving grilled chicken as a healthier alternative to fried chicken. According to QSR Magazine, 2011 sales for McDonald’s outperformed the company’s sales in 2009, by a whopping $1.5billion. The difference in sales was mainly due to the addition of fruit smoothies and salads into the fast food chain’s menu.

In conclusion, these are some of the economic indicators of the fast food chains in America. As long as there is never a repeat of the horrific 2008 recession in the near future, the future of the fast food industry seems to be bright in America.

The Olympics Indicator: It’s More Than Just a Sports Event

This just in: Los Angeles could become the only city to host three Summer Games other than London.

With the 2024 Summer Olympics nine years from now, Los Angeles was chosen Tuesday to be the new official U.S. bidder for the Games, replacing Boston after the city’s campaign surrendered to local opposition.

COLLISEUM-1-superJumbo

(The Los Angeles Coliseum/Source: The New York Times)

When we talk about economic opportunities related to sports events, we usually think of vast investments in sports venues, infrastructure, public transportation, and human capital, etc. However, historical data reveal that the Olympics hosting right has been an economic indicator of stock markets.

A study conducted by Bespoke Investment Group shows that under most circumstances, stocks markets rally during the Summer Games because investors are mostly distracted from gloomy headlines. Most of the times, the so-called Olympics Indicator is found to be a leading indicator of a rising stock market.

The study included the performance of the Dow Jones Industrial Average during the Summer Games since the 1900 Paris Olympics. It also calculated the market performance of hosting countries during the games since the 1984 Los Angeles Olympics.

The claim that investors are distracted by the games appears to be a little bit bizarre. However, from 1900 to 2008, the DOW had an average gain of four percent and the index was positive two thirds of the time. Therefore, if you buy $10,000 worth of stocks on the day of the opening ceremony and sell all of them on the closing day (that’s usually 14 days,) theoretically you can earn at least a brand new Apple Watch.

What about the stock markets of host countries? Since 1984, only two out of seven games have seen a negative growth in host countries’ stock markets. Both cases occurred because they were right in the middle of the dot-com bubble and the 2008 financial crisis, respectively. The average gain was 1.86% according to past performance of stock markets.

olympicsbespoke


(Source: Bespoke Investment Group)

Even though there is no strong evidence showing a causal relationship between the Olympics Games and stock markets, it can be drawn from historical data that stock markets tend to perform better during the games. That’s partly because markets gain a sense of optimism and counteract the negatives in most years.

For investors seeking short-term profits, don’t just sitting in the couch watching the games. The Olympics Games can be an indicator for a positive market. Buying some Nike or Adidas stocks may be a good decision.

Sources:

USOC names Los Angeles the official U.S. bidder for the 2024 Summer Olympics

The Olympics Indicator

What Summer Box Office Numbers Tell Us About the Economy

Baseball may longer be America’s only favorite past time. Americans have sought after a much more cost efficient alterative to let loose and relax than pay the high cost of a stadium seat. It seems that more individuals are heading to the big screen to unwind.

It has been noted that by economists that there may be a strong correlation between movie ticket sales and the health of our economy. During our economy’s peak, Americans had a much more disposable income to spend on vacations and were able to pay higher costs for entertainment. However, as a result of the recession many individuals have now become hesitant to spend money.

However, as our economy slowly begins to recover from the economic recession that occurred in the late 2000s it has been observed that Americans are watching more films, whether they are heading to a theater or relaxing on the couch at home streaming Netflix or popping in a Redbox rental.

It has been recorded that summer box office sales hit a record high in 2011, with a grand total of $4.4 billion in overall revenue. That being a notable increase of approximately 1 percent over the prior year, according to the National Association of Theater Owners.

Looking back and comparing how our economy was in 2011 to our 2015 economic numbers, one would certainly hope that he or she would see some sort of upward trend indicating that we are on our way to recovery.

Therefore, what would we hope to see in terms of box office numbers for this summer season? Certainly, we’d hope to see less individuals heading to the theater as a form of entertainment of course.

While we will not know the exact box office numbers for the summer of 2015 until after Labor Day weekend, it can be stated that there has been a substantial decrease when paralleled to our 2011 numbers.

Currently, the summer season has brought in approximately $3.8 billion revenue domestically. However, it is expected that there should not be any significant spike in numbers within the remaining week or so of the season.

It can be stated that this summer season is up 9.7% compared to last year, but that increase is suspected to be a result of more family movies being released this summer, such as Jurassic World. In addition, labor day falls at a later date this year and provides an additional eight days to the summer season.

So the method of observing summer box office sales and comparing them to the economy may seem unusual,  but it may be a valid economic indicator.


Quality of Life Index

Li Ka Shing, Hong Kong’s wealthiest man started his career as a high school drop out but he managed to grow his wealth alongside Hong Kong’s rapid financial boom. Anything good that has happened to him could be traced back to the fact that he was born in the right country, Hong Kong, at the right time, 1930s. He was not the only one to benefit from his birth, Warren Buffet, probably the world’s most successful investor was born around the same time in the United States. A quarter of a century ago, when The World in 1988 ranked 50 countries according to where would be the best place to be born in 1988, America indeed come top. But the question is, which country will be the best birthplace for the years to come?

To answer this, The economist has created a comparison of 80 countries which will provide the best opportunity for healthy, safe and prosperous in years ahead. The quality of life index (also known as the where-to-be-born index) links the results of subjective life satisfaction surveys – how happy people say they are- to objective determinants of the quality of life across countries. A high GDP per capita helps more than anything else however it is not all that counts. Things like crime and trust in government institution matter too. Overall, the index takes 11 indices into account, they are varied but all important considerations: some are factors hardly ever change (geography), and others change very slowly (social and cultural characteristics) and some factors depend on political environment and the state of the world economy.

Determinants of the Quality of Life

1. Material wellbeing

  • GDP per person, at ppp in $.

2. Health

  • Life expectancy at birth, years.

3. Political stability and security

  • Political stability and security ratings.

4. Family life

  • Divorce rate (per 1,000 population), converted into index of 1 (lowest divorce rates) to 5 (highest).

5. Community life

  • Dummy variable taking value 1 if country has either high rate of church attendance or trade-union membership; zero otherwise.

6. Climate and geography

  • Latitude, to distinguish between warmer and colder climes.

7. Job security

  • Unemployment rate %.

8. Political freedom

  • Average of indices of political and civil liberties. Scale of 1 (completely free) to 7 (unfree).

9. Gender equality

  • Ratio of average male and female earnings, latest available data.

10. Governance

  • Ratings for corruption

Surprising factors that weren’t included in the index are education levels, rate of GDP growth and income inequality. According to studies, education only had a small correlation to overall life satisfaction however, education levels can also impact political freedom, job security and gender equality.

A forward-looking element comes into play too. Although many of the determinants of the quality of life change rather slowly, these rankings are only a forecast. The2013 index will be for children born in that year and predict the year 2030 when they reach adulthood.

Small economies dominate the top ten places. Half of these countries are european but only one country is in the Euro Zone (Netherlands). The Nordic countries are ranked the highest whereas European economies with high unemployment rates lag behind (Greece and Spain) despite their advantage of a warm climate.

America, the number 1 country to be born in in 1988, is down in 16th place, despite their huge economy and political freedom, babies born today will inherit large debts of the boomer generation. None of the large manufacturing countries such as Brazil, India or China scored very impressively.

The Buttered Popcorn Index – A Deliciously Twisted Look At Economic History

movie_theaters_68947In an age where streaming movies on Netflix or Hulu has become the norm, many people assume the movie theater industry is a dying relic of a more financially stable time.

Every year, Hollywood releases reports blaming mediocre films for turning audiences away. Other people in the media think the industry is failing because younger generations are less interested in the big screen experience. Unfortunately, most of these reasons lack any statistical support.

The movie theater industry follows a rollercoaster-like business cycle that reaches its peak during different periods of time much like many sections of the U.S. economy. However, the unique characteristic of the movie theater business is that it thrives when most businesses are struggling to survive.

This is the Buttered Popcorn Index.

Throughout the history of U.S. cinema, there has been a trend in movie theater attendance as it correlates with the economic climate in the country.

During the Great Depression, the film industry had to cut costs in production and theaters had to lower ticket prices. This led to an enormous surge in the film industry with roughly 60 to 80 million people heading to the movies each week.

In 1982, movie theater attendance climbed 10 percent while the unemployment rate increased at a similar pace. However, as the economy healed, attendance dropped about 12 percent.

Screen Shot 2015-09-01 at 8.56.58 PM

Now let’s look at our most recent recession. In 2008, the movie theaters earned roughly thirty million dollars less than in 2007. In 2009, the summer box office had an enormous spike in ticket sales after declining in 2008. The chart above shows how, between 2008 and 2009, theaters earned over one hundred million dollars more than 2008.

Screen Shot 2015-09-01 at 8.57.19 PM


Movie theaters have not been able to maintain the 1.42 billion people they brought in during the rescission. The Hollywood Reporter released statistics in 2014 stating the number of people going to the movies had dropped six percent from 2013, which was the lowest in twenty years.

Ticket prices have played a large role in how people perceive the movie theater experience. Between 2001 and 2015, The price for move tickets increased from $5.66 to $8.12. The prices have blown up dramatically within the last fifteen years, yet there were more people going to the theater in 2009.

One of the main reasons why movie theaters had a surge during the recession was because even with the rise in prices, tickets have remained below ten dollars. Therefore, when times are tough for people, less of them look at going to the movies as an expense and more as one of the few remaining affordable options for entertainment.

“Generally, when economic downturns hit, we have seen an increase in box office and attendance in six of the eight last recessions,” said spokesman for the National Association of Theater Owners Patrick Corcoran in an interview in 2011,  “People seek relief in forgetting their problems, so they go to the movies, and it is the least expensive form of entertainment.”

Another reason for the success of the movie theater business in 2009 was the types of movies being released. Happier films like Pixar’s Up and the comedy film The Hangover raked in close to $300 million each during the summer months. This suggests many people were looking for an inexpensive way to enjoy themselves in a tough economic climate.

The Buttered Popcorn Index demonstrates that no matter what era it is, people tend to flock to movies to escape the realities of their financial situation.

The Plastic Surgery Index

When hearing the word economy, any keyword that is related to finance, such as “GDP,” might pop into your head, but what about the phrase “plastic surgery?” A few years ago, economy was exclusively linked to plastic surgery when the American Society of Plastic Surgeons (ASPS) revealed its statistics.

In comparing the numbers from 2008 to 2009, the ASPS found that the total number of cosmetic procedures fell 1 percent and the surgical procedures fell 9 percent. These statistics created a correlation between the U.S. economy and plastic surgery, and thus the Plastic Surgery Indicator was born.

During times of economic instability, people cut down unnecessary spending as their first priority, and plastic surgery appears to be on the top of the list. The total number of plastic surgeries fell during economic hardship, but when the economy is rising, the total number of surgical procedures also rises because people have a restored confidence in the market.

In 2011, 13.8 million cosmetic plastic surgeries, including surgical and minimally- invasive, were performed in the U.S., which is a five percent increase from 2010, according to the American Society of Plastic Surgeons.

“While the rate of economic recovery in the U.S. is still uncertain, 2011 proved to be a good year for plastic surgery,” said ASPS President Malcolm Z. Roth, MD. “Consumer confidence was up, auto sales rose 10 percent, so it is not surprising that we would also see increased demand for plastic surgery procedures.”

However, if you only focus on the total number of surgical procedures that were performed each year, a large part of the indicator is being missed.

In 2011, the total number of surgical procedures was 11.5 million, 2.1 of which were invasive cosmetic surgical procedures, such as breast augmentations and facelifts. In 2013, the total number of surgical procedures was 13.8 million, and only 1.58 of which were invasive cosmetic surgical procedures.

Even though the statistics from the American Society of Plastic Surgeons show an increase in the total number of surgeries from 11.5 to 13.8 million, it shows a decrease in the number of invasive cosmetic surgery procedures from 2005-2011.

If less invasive cosmetic surgeries were performed, you may be wondering how did the total number of cosmetic surgeries increase? Minimally invasive surgical procedures are the answer.

Due to the fact that people have less discretionary income to spend, people are more willing to pay for minimally invasive cosmetic surgeries– such as botulinum toxin, which means injecting Botox and Dysport to the face in order to reduce wrinkles– as opposed to spending it all on invasive cosmetic surgeries– such as nose reshaping, which is expensive.

Overall, we know that when the economy is good, more plastic surgeries are performed, which is a good general measure of consumerism in the economy. However, looking at the number of minimally cosmetic surgeries is an even more precise way to predict the economy than the total number of cosmetic plastic surgeries in the future.

Chonieconomics: The Men’s Underwear Index

Throughout the course of history, people have been caught with their pants down (so to speak) on various occasions by shifts in the economy—some sudden; some cyclical. Little did the gentlemen among these folks know that underneath said pants, was one of the more obscure metrics tracked as an indicator of the relative health of the economy.

The Men’s Underwear Index is, apparently, a real thing. So said Alan Greenspan in the 70’s.

underwear index_9 3

The orangutan, the zebra and the stork clearly lived in economic prosperity.

As we’ve discussed in class, economics often gets a bad rap because many people’s exposure to it consists of a bunch of old, white guys on TV talking about the most widely used economic indicator—the stock market—in what sounds like an alien language. However, despite it including the synthesis of a lot of real-time information, the stock market is a leading indicator (a measure of what people think is going to happen) and is, by nature, speculative. To some extent, the talking heads on TV are guessing, and they know it.

Chonies as an indicator, on the other hand, are referred to as lagging. (I know…sorry, gents.) A lagging indicator is simply a compilation of data points from what has already happened—in this case, purchases of men’s underwear. This empirical measurement has been a fairly solid indicator of what has happened with the economy since it came into existence almost half a century ago.

Per Esquire (repurposed from Business Insider), men purchase an average of 3.4 pairs of underwear per year. That number has tended to increase in times of economic prosperity and decrease in difficult economic times.

What I don’t understand is why this is considered some genius insight. It makes sense that in a down economy people would not spend money, primarily because they don’t have it.

The best explanation I’ve been able to find is that underwear is deemed a necessity, which sets it apart from other clothing items and makes it a better baseline. That hasn’t stopped economists from developing other obscure indicators as well. Hemlines, dry cleaning, ties and lipstick have all been referenced to measure the health of the economy, but the common thread through all of them is that people purchase more when the economy is good and they have the money to do so. Regardless of what CNBC analysts tell you, it’s as simple as that.

Greenspan trolled us all, but I suppose I should thank him. He gave me a reason to write about underwear in a class blog.

What Men’s Underwear Tells about Economy

Many know more or less about the lipstick index, or the hemline index that both indicate certain relationship between economics and female fashion trends. Has anyone ever wondered what men’s fashion have to do with the economics? The Men’s Underwear Index tells you everything about the hidden ties between the sales of men’s underwear and current economic conditions.


The revenue generated by men’s underwear usually stays stable because they are regarded as daily necessity instead of luxury items. However, when the economy faces a downturn, men’s underwear industry is likely to suffer from a “prolonged purchase”, according to Marshal Cohen, because male tend not to purchase new pairs of underwear until the economy gets better. As a result, men’s underwear industry is likely to witness a decrease in sales when economy is bad.


On the other hand, however, since men’s underwear companies have discovered the underlying connection between the Men’s Underwear Index (MUI) and the economics, they start to utilize predictions for men’s underwear sales as an indicator for economy conditions as a whole. In the early 2000s, men start to explore a world where their choices of underwear are no longer limited to basic black and white boxers, since companies started to make colorful and modern designs underwear with high-tech materials. These advancements signify a growing economy, which is reflected by increasing sales numbers during the time. Had the economy been growing at a stable rate, the estimated sales of men’s underwear would look like this:

MUI 1


However, as time approaches the year of 2008, the relatively stable men’s underwear industry has observed a phenomenon, which men are increasingly willing to purchase single pairs of underwear instead of multi-packs of underwear. During the recession, men’s underwear sales dropped by 2.3 percent; and it is not until in 2010 when sales began to slowly climb up again. This transition represents the change of men’s habits during times when smooth economic growth is challenged: they tend to purchase underwear only when they absolutely need to. Of course, there are men who still purchase underwear regular basis during times when economy is slowing down; but what the MUI indicates is a big picture from which people can tell the economic conditions according to increase/decrease in men’s underwear sales numbers.

MUI

Overall, the Men’s Underwear Index can be regarded as a reliable economic indicator, thanks to its stable sales behavior throughout the years. When an economic downturn arrives, men are less likely to shop for underwear on a frequent basis, therefore extending the purchasing cycle and lowering sales in the long run.


http://www.huffingtonpost.com/2012/10/09/underwear-sales-growth-economy_n_1952214.html


http://www.washingtonpost.com/wp-dyn/content/article/2009/08/30/AR2009083002761.html?hpid=topnews


http://www.businessinsider.com/mens-underwear-index-economy-indicator-2014-9