Uber just completed 2 billion rides on July of 2016 internationally, proving as consumers’ best friend when it comes to transportation.
To the majority of the Trojans, Uber is an excellent app.
Thanks to the recent program between USC and Uber, the Trojans have been saving money and going home safely after late excursions.
Proving how Uber is the students’ beloved smartphone app, the recent findings in Uber demand curve shows how Uber service is more beneficial to the customers than the drivers and the company itself.
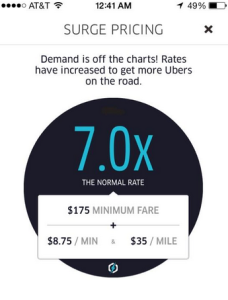
Uber, Steven Levitte (author of Freakonomics), and other researchers mapped out Uber demand curve to investigate the impact Uber has brought to the consumer welfare. If the researchers were to map demand curve for regular transportation service, it could have been harder because there is more than one factor. For the transportation service like Taxi, the price may be affected by not only the supply of the drivers but also by the weather, time of the day and other competing services. Different from aforementioned factors affecting transportation demands, Uber’s metrics are unique in two folds: 1. Uber records every occasion where a customer declines the offered price with regular factors such as the time, place, price, and a surge factor; 2. Uber rounds up or down to one decimal place the surge factor it generates to determine how much to charge customers for a given trip.
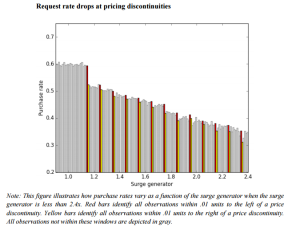
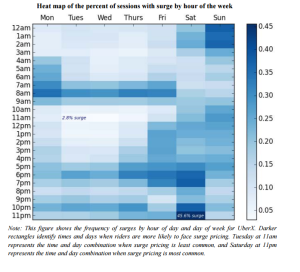
The Study looked into 48 million ride interactions over the first 24 weeks of last year from Uber’s four biggest U.S. markets: New York, San Francisco, Chicago, and Los Angeles. According to the data, the customers follow through 62% of the time without surge pricing (which is almost 80% of the time), and 39% when the surge is above 2 (3.5% of the time). The demand did not match the price. In simple economics, the demand should be high as the supply is scarce; however, the Uber data shows the opposite. As shown in the graph, the demand decreased by 40% as the price doubled.


On the conclusion of the study, the authors stated that Uber demand curve is highly inelastic and made $6.8 billion consumer surplus last year alone. This surplus is twice greater than how much the drivers were paid and six times what Uber itself earned last year. This may be a good news for the college students whose goal is always to save money, but it is clearly not a great news for Uber which has lost $1.2 billion in the first half of 2016.


Leave a Reply
You must be logged in to post a comment.