What are bonds?
Bonds are low-risk, fixed-income securities. Governments, in this case the US, issue bonds to raise funds. The US Treasury Department issues and auctions the bonds. There are several types of bonds including: short-term, long-term and inflation-protected bonds. Bond lifetimes range between a few months to 30 years.
Bondholders acquire these financial instruments to have a claim or stake in the government’s money. What makes bonds attractive to investors are the interest rates. The government pays bondholders semi-annually the full face-value of the bond plus the interest rate.
Current events
News outlets have been citing the inversion of the yield curve following the Federal Reserve’s (Fed) recent statements. The yield curve is a measure of bond maturity over time. This data gives investors, financial institutions and economists a sense of the value of investment. An inversion occurs when short-term bond yield rates are higher than long-term yield rates. Bond value fluctuates based on myriad economic factors.
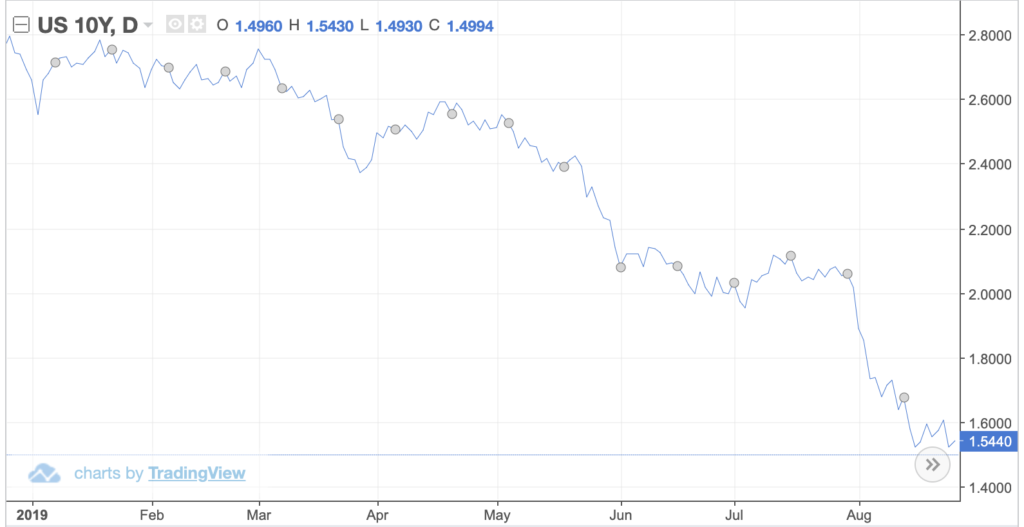
In the chart above, 10-year bond yields have steadily declined since the start of 2019. This means that bonds are losing their value. Ultimately, bondholders are losing money from what should have been a low-risk investment.
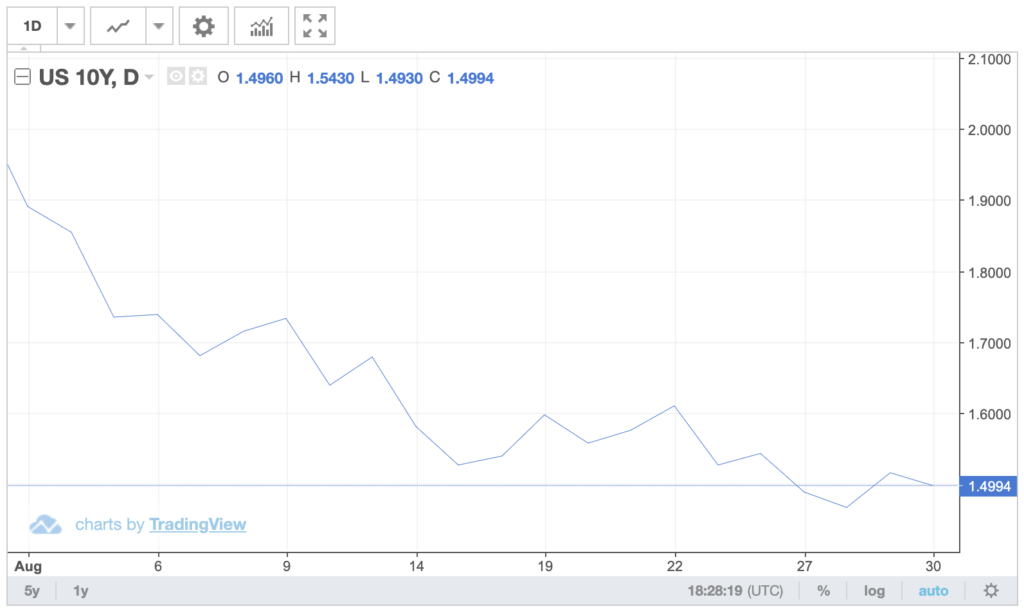
The following chart shows a more in-depth view of 10-year bond yields for this month. The 10-year bond yield has reached somewhat of a historic low.
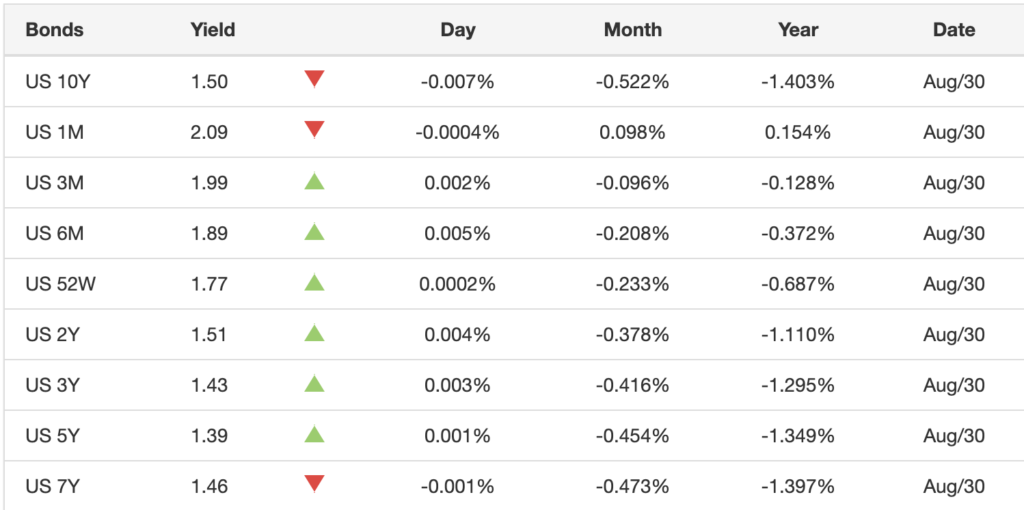
The details of the current inversion rests in the numbers. The long-term yield spread (2-year to 10-year bonds) rates are lower than the short-term spread (1-month to 1-year bonds). Even within the subsets of bonds there are inversions. For instance, the 1-year yield (1.77) is lower than the 1-month yield (2.09).
Why this matters?
Bonds are losing value. Investors and financial institutions are anxious. More importantly, though, is that the past four recessions (1981, 1991, 2001, 2008) were predicted by a preceding inverted yield curve. This is the reason why media outlets, governments and economists are worried.
The last yield curve inversion
The last time the yield curve inverted was in December 2005. The Fed became aware of a housing bubble in progress and raised the fed funds rate – the rate at which banks lend money to each other – to 4.25 percent. The goal behind this was to curb lending; making it more difficult for institutions and individuals to borrow money. That affected the 2-year yield curve by raising it to 4.41. percent, while the 10-year yield dropped to 4.39 percent. Over time the Fed kept altering the fed funds rate which also affected yield rates. The curve remained inverted for years after that.
What followed was the worst recession since the Great Depression. Economies across the world were affected by the housing bubble.