The Olympics Indicator: It’s More Than Just a Sports Event

This just in: Los Angeles could become the only city to host three Summer Games other than London.

With the 2024 Summer Olympics nine years from now, Los Angeles was chosen Tuesday to be the new official U.S. bidder for the Games, replacing Boston after the city’s campaign surrendered to local opposition.

COLLISEUM-1-superJumbo

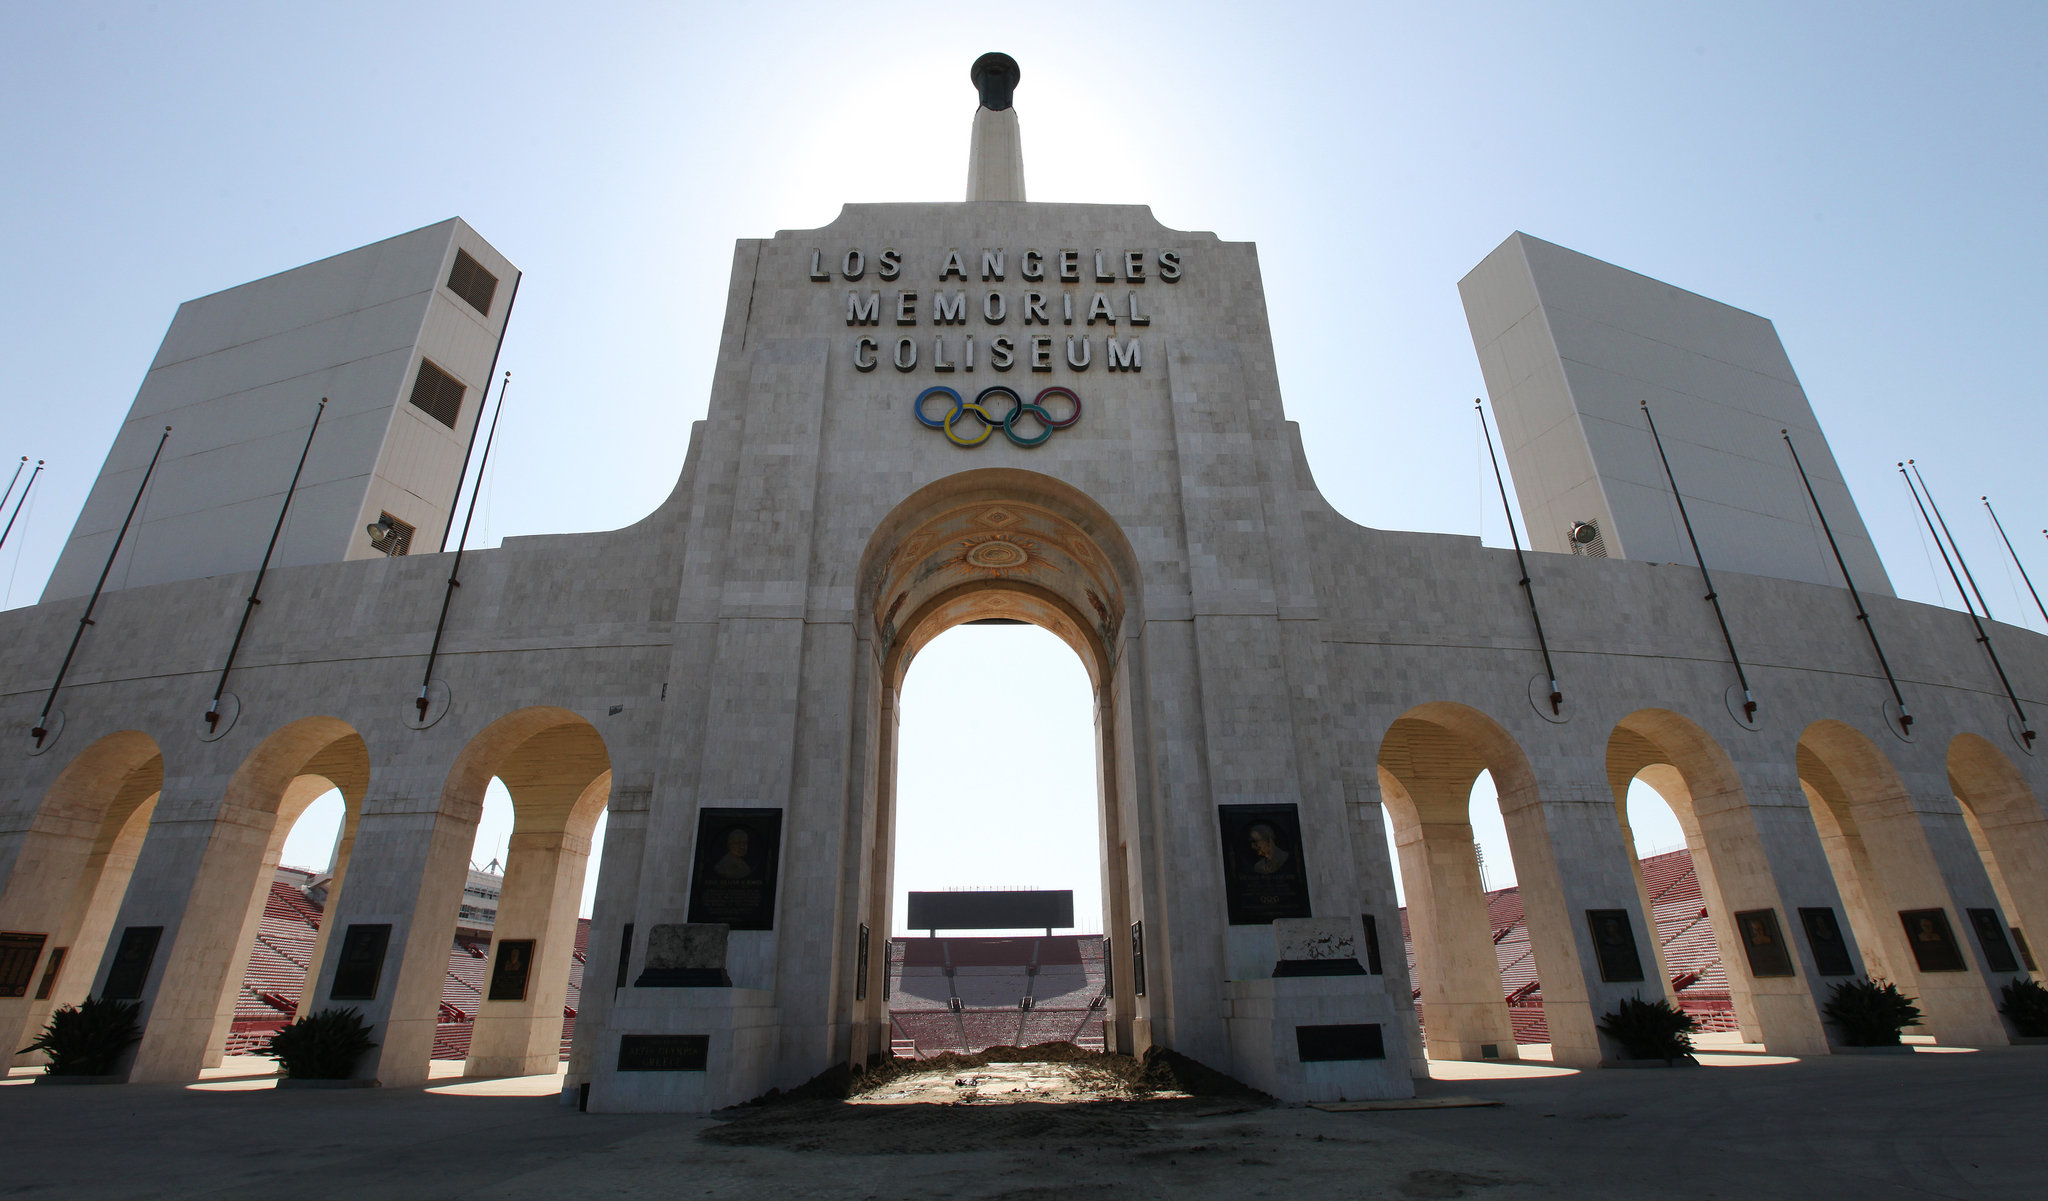
(The Los Angeles Coliseum/Source: The New York Times)

When we talk about economic opportunities related to sports events, we usually think of vast investments in sports venues, infrastructure, public transportation, and human capital, etc. However, historical data reveal that the Olympics hosting right has been an economic indicator of stock markets.

A study conducted by Bespoke Investment Group shows that under most circumstances, stocks markets rally during the Summer Games because investors are mostly distracted from gloomy headlines. Most of the times, the so-called Olympics Indicator is found to be a leading indicator of a rising stock market.

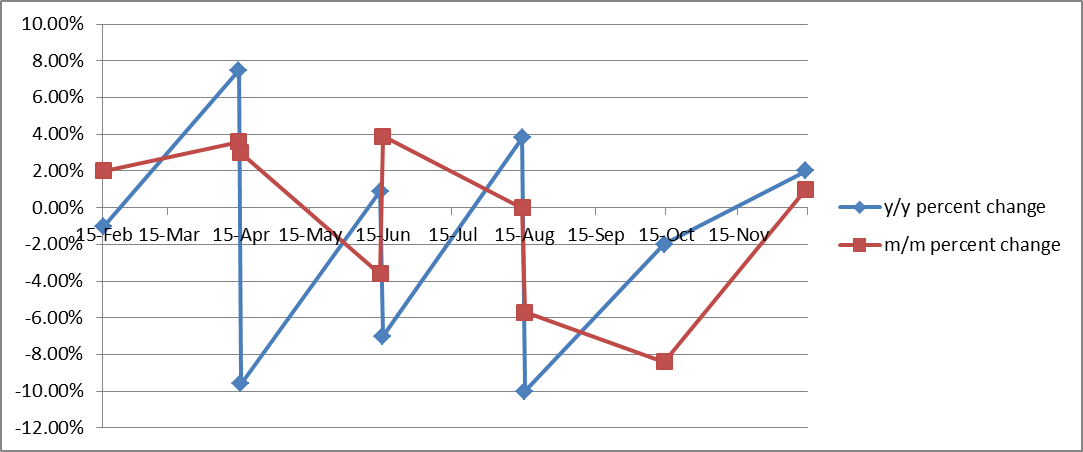
The study included the performance of the Dow Jones Industrial Average during the Summer Games since the 1900 Paris Olympics. It also calculated the market performance of hosting countries during the games since the 1984 Los Angeles Olympics.

The claim that investors are distracted by the games appears to be a little bit bizarre. However, from 1900 to 2008, the DOW had an average gain of four percent and the index was positive two thirds of the time. Therefore, if you buy $10,000 worth of stocks on the day of the opening ceremony and sell all of them on the closing day (that’s usually 14 days,) theoretically you can earn at least a brand new Apple Watch.

What about the stock markets of host countries? Since 1984, only two out of seven games have seen a negative growth in host countries’ stock markets. Both cases occurred because they were right in the middle of the dot-com bubble and the 2008 financial crisis, respectively. The average gain was 1.86% according to past performance of stock markets.

olympicsbespoke


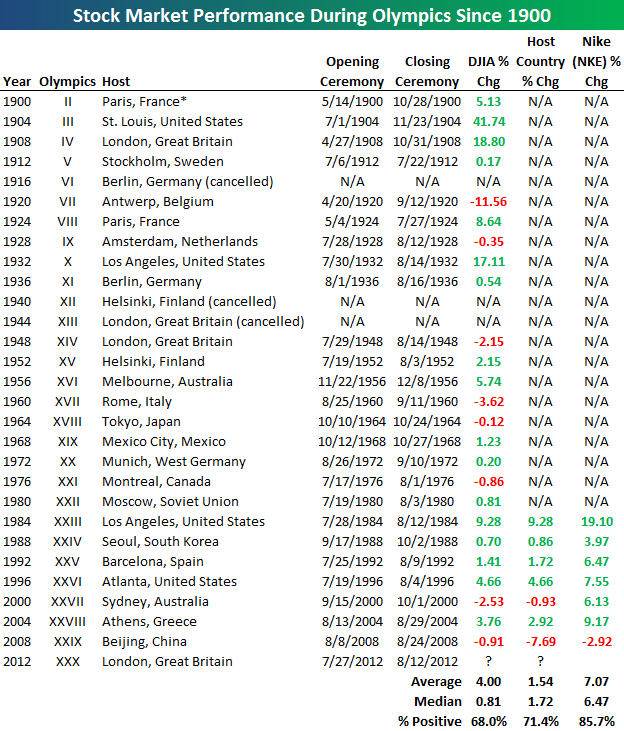
(Source: Bespoke Investment Group)

Even though there is no strong evidence showing a causal relationship between the Olympics Games and stock markets, it can be drawn from historical data that stock markets tend to perform better during the games. That’s partly because markets gain a sense of optimism and counteract the negatives in most years.

For investors seeking short-term profits, don’t just sitting in the couch watching the games. The Olympics Games can be an indicator for a positive market. Buying some Nike or Adidas stocks may be a good decision.

Sources:

USOC names Los Angeles the official U.S. bidder for the 2024 Summer Olympics

The Olympics Indicator

What Summer Box Office Numbers Tell Us About the Economy

Baseball may longer be America’s only favorite past time. Americans have sought after a much more cost efficient alterative to let loose and relax than pay the high cost of a stadium seat. It seems that more individuals are heading to the big screen to unwind.

It has been noted that by economists that there may be a strong correlation between movie ticket sales and the health of our economy. During our economy’s peak, Americans had a much more disposable income to spend on vacations and were able to pay higher costs for entertainment. However, as a result of the recession many individuals have now become hesitant to spend money.

However, as our economy slowly begins to recover from the economic recession that occurred in the late 2000s it has been observed that Americans are watching more films, whether they are heading to a theater or relaxing on the couch at home streaming Netflix or popping in a Redbox rental.

It has been recorded that summer box office sales hit a record high in 2011, with a grand total of $4.4 billion in overall revenue. That being a notable increase of approximately 1 percent over the prior year, according to the National Association of Theater Owners.

Looking back and comparing how our economy was in 2011 to our 2015 economic numbers, one would certainly hope that he or she would see some sort of upward trend indicating that we are on our way to recovery.

Therefore, what would we hope to see in terms of box office numbers for this summer season? Certainly, we’d hope to see less individuals heading to the theater as a form of entertainment of course.

While we will not know the exact box office numbers for the summer of 2015 until after Labor Day weekend, it can be stated that there has been a substantial decrease when paralleled to our 2011 numbers.

Currently, the summer season has brought in approximately $3.8 billion revenue domestically. However, it is expected that there should not be any significant spike in numbers within the remaining week or so of the season.

It can be stated that this summer season is up 9.7% compared to last year, but that increase is suspected to be a result of more family movies being released this summer, such as Jurassic World. In addition, labor day falls at a later date this year and provides an additional eight days to the summer season.

So the method of observing summer box office sales and comparing them to the economy may seem unusual,  but it may be a valid economic indicator.


Quality of Life Index

Li Ka Shing, Hong Kong’s wealthiest man started his career as a high school drop out but he managed to grow his wealth alongside Hong Kong’s rapid financial boom. Anything good that has happened to him could be traced back to the fact that he was born in the right country, Hong Kong, at the right time, 1930s. He was not the only one to benefit from his birth, Warren Buffet, probably the world’s most successful investor was born around the same time in the United States. A quarter of a century ago, when The World in 1988 ranked 50 countries according to where would be the best place to be born in 1988, America indeed come top. But the question is, which country will be the best birthplace for the years to come?

To answer this, The economist has created a comparison of 80 countries which will provide the best opportunity for healthy, safe and prosperous in years ahead. The quality of life index (also known as the where-to-be-born index) links the results of subjective life satisfaction surveys – how happy people say they are- to objective determinants of the quality of life across countries. A high GDP per capita helps more than anything else however it is not all that counts. Things like crime and trust in government institution matter too. Overall, the index takes 11 indices into account, they are varied but all important considerations: some are factors hardly ever change (geography), and others change very slowly (social and cultural characteristics) and some factors depend on political environment and the state of the world economy.

Determinants of the Quality of Life

1. Material wellbeing

  • GDP per person, at ppp in $.

2. Health

  • Life expectancy at birth, years.

3. Political stability and security

  • Political stability and security ratings.

4. Family life

  • Divorce rate (per 1,000 population), converted into index of 1 (lowest divorce rates) to 5 (highest).

5. Community life

  • Dummy variable taking value 1 if country has either high rate of church attendance or trade-union membership; zero otherwise.

6. Climate and geography

  • Latitude, to distinguish between warmer and colder climes.

7. Job security

  • Unemployment rate %.

8. Political freedom

  • Average of indices of political and civil liberties. Scale of 1 (completely free) to 7 (unfree).

9. Gender equality

  • Ratio of average male and female earnings, latest available data.

10. Governance

  • Ratings for corruption

Surprising factors that weren’t included in the index are education levels, rate of GDP growth and income inequality. According to studies, education only had a small correlation to overall life satisfaction however, education levels can also impact political freedom, job security and gender equality.

A forward-looking element comes into play too. Although many of the determinants of the quality of life change rather slowly, these rankings are only a forecast. The2013 index will be for children born in that year and predict the year 2030 when they reach adulthood.

Small economies dominate the top ten places. Half of these countries are european but only one country is in the Euro Zone (Netherlands). The Nordic countries are ranked the highest whereas European economies with high unemployment rates lag behind (Greece and Spain) despite their advantage of a warm climate.

America, the number 1 country to be born in in 1988, is down in 16th place, despite their huge economy and political freedom, babies born today will inherit large debts of the boomer generation. None of the large manufacturing countries such as Brazil, India or China scored very impressively.

The Buttered Popcorn Index – A Deliciously Twisted Look At Economic History

movie_theaters_68947In an age where streaming movies on Netflix or Hulu has become the norm, many people assume the movie theater industry is a dying relic of a more financially stable time.

Every year, Hollywood releases reports blaming mediocre films for turning audiences away. Other people in the media think the industry is failing because younger generations are less interested in the big screen experience. Unfortunately, most of these reasons lack any statistical support.

The movie theater industry follows a rollercoaster-like business cycle that reaches its peak during different periods of time much like many sections of the U.S. economy. However, the unique characteristic of the movie theater business is that it thrives when most businesses are struggling to survive.

This is the Buttered Popcorn Index.

Throughout the history of U.S. cinema, there has been a trend in movie theater attendance as it correlates with the economic climate in the country.

During the Great Depression, the film industry had to cut costs in production and theaters had to lower ticket prices. This led to an enormous surge in the film industry with roughly 60 to 80 million people heading to the movies each week.

In 1982, movie theater attendance climbed 10 percent while the unemployment rate increased at a similar pace. However, as the economy healed, attendance dropped about 12 percent.

Screen Shot 2015-09-01 at 8.56.58 PM

Now let’s look at our most recent recession. In 2008, the movie theaters earned roughly thirty million dollars less than in 2007. In 2009, the summer box office had an enormous spike in ticket sales after declining in 2008. The chart above shows how, between 2008 and 2009, theaters earned over one hundred million dollars more than 2008.

Screen Shot 2015-09-01 at 8.57.19 PM


Movie theaters have not been able to maintain the 1.42 billion people they brought in during the rescission. The Hollywood Reporter released statistics in 2014 stating the number of people going to the movies had dropped six percent from 2013, which was the lowest in twenty years.

Ticket prices have played a large role in how people perceive the movie theater experience. Between 2001 and 2015, The price for move tickets increased from $5.66 to $8.12. The prices have blown up dramatically within the last fifteen years, yet there were more people going to the theater in 2009.

One of the main reasons why movie theaters had a surge during the recession was because even with the rise in prices, tickets have remained below ten dollars. Therefore, when times are tough for people, less of them look at going to the movies as an expense and more as one of the few remaining affordable options for entertainment.

“Generally, when economic downturns hit, we have seen an increase in box office and attendance in six of the eight last recessions,” said spokesman for the National Association of Theater Owners Patrick Corcoran in an interview in 2011,  “People seek relief in forgetting their problems, so they go to the movies, and it is the least expensive form of entertainment.”

Another reason for the success of the movie theater business in 2009 was the types of movies being released. Happier films like Pixar’s Up and the comedy film The Hangover raked in close to $300 million each during the summer months. This suggests many people were looking for an inexpensive way to enjoy themselves in a tough economic climate.

The Buttered Popcorn Index demonstrates that no matter what era it is, people tend to flock to movies to escape the realities of their financial situation.

The Plastic Surgery Index

When hearing the word economy, any keyword that is related to finance, such as “GDP,” might pop into your head, but what about the phrase “plastic surgery?” A few years ago, economy was exclusively linked to plastic surgery when the American Society of Plastic Surgeons (ASPS) revealed its statistics.

In comparing the numbers from 2008 to 2009, the ASPS found that the total number of cosmetic procedures fell 1 percent and the surgical procedures fell 9 percent. These statistics created a correlation between the U.S. economy and plastic surgery, and thus the Plastic Surgery Indicator was born.

During times of economic instability, people cut down unnecessary spending as their first priority, and plastic surgery appears to be on the top of the list. The total number of plastic surgeries fell during economic hardship, but when the economy is rising, the total number of surgical procedures also rises because people have a restored confidence in the market.

In 2011, 13.8 million cosmetic plastic surgeries, including surgical and minimally- invasive, were performed in the U.S., which is a five percent increase from 2010, according to the American Society of Plastic Surgeons.

“While the rate of economic recovery in the U.S. is still uncertain, 2011 proved to be a good year for plastic surgery,” said ASPS President Malcolm Z. Roth, MD. “Consumer confidence was up, auto sales rose 10 percent, so it is not surprising that we would also see increased demand for plastic surgery procedures.”

However, if you only focus on the total number of surgical procedures that were performed each year, a large part of the indicator is being missed.

In 2011, the total number of surgical procedures was 11.5 million, 2.1 of which were invasive cosmetic surgical procedures, such as breast augmentations and facelifts. In 2013, the total number of surgical procedures was 13.8 million, and only 1.58 of which were invasive cosmetic surgical procedures.

Even though the statistics from the American Society of Plastic Surgeons show an increase in the total number of surgeries from 11.5 to 13.8 million, it shows a decrease in the number of invasive cosmetic surgery procedures from 2005-2011.

If less invasive cosmetic surgeries were performed, you may be wondering how did the total number of cosmetic surgeries increase? Minimally invasive surgical procedures are the answer.

Due to the fact that people have less discretionary income to spend, people are more willing to pay for minimally invasive cosmetic surgeries– such as botulinum toxin, which means injecting Botox and Dysport to the face in order to reduce wrinkles– as opposed to spending it all on invasive cosmetic surgeries– such as nose reshaping, which is expensive.

Overall, we know that when the economy is good, more plastic surgeries are performed, which is a good general measure of consumerism in the economy. However, looking at the number of minimally cosmetic surgeries is an even more precise way to predict the economy than the total number of cosmetic plastic surgeries in the future.

Chonieconomics: The Men’s Underwear Index

Throughout the course of history, people have been caught with their pants down (so to speak) on various occasions by shifts in the economy—some sudden; some cyclical. Little did the gentlemen among these folks know that underneath said pants, was one of the more obscure metrics tracked as an indicator of the relative health of the economy.

The Men’s Underwear Index is, apparently, a real thing. So said Alan Greenspan in the 70’s.

underwear index_9 3

The orangutan, the zebra and the stork clearly lived in economic prosperity.

As we’ve discussed in class, economics often gets a bad rap because many people’s exposure to it consists of a bunch of old, white guys on TV talking about the most widely used economic indicator—the stock market—in what sounds like an alien language. However, despite it including the synthesis of a lot of real-time information, the stock market is a leading indicator (a measure of what people think is going to happen) and is, by nature, speculative. To some extent, the talking heads on TV are guessing, and they know it.

Chonies as an indicator, on the other hand, are referred to as lagging. (I know…sorry, gents.) A lagging indicator is simply a compilation of data points from what has already happened—in this case, purchases of men’s underwear. This empirical measurement has been a fairly solid indicator of what has happened with the economy since it came into existence almost half a century ago.

Per Esquire (repurposed from Business Insider), men purchase an average of 3.4 pairs of underwear per year. That number has tended to increase in times of economic prosperity and decrease in difficult economic times.

What I don’t understand is why this is considered some genius insight. It makes sense that in a down economy people would not spend money, primarily because they don’t have it.

The best explanation I’ve been able to find is that underwear is deemed a necessity, which sets it apart from other clothing items and makes it a better baseline. That hasn’t stopped economists from developing other obscure indicators as well. Hemlines, dry cleaning, ties and lipstick have all been referenced to measure the health of the economy, but the common thread through all of them is that people purchase more when the economy is good and they have the money to do so. Regardless of what CNBC analysts tell you, it’s as simple as that.

Greenspan trolled us all, but I suppose I should thank him. He gave me a reason to write about underwear in a class blog.

What Men’s Underwear Tells about Economy

Many know more or less about the lipstick index, or the hemline index that both indicate certain relationship between economics and female fashion trends. Has anyone ever wondered what men’s fashion have to do with the economics? The Men’s Underwear Index tells you everything about the hidden ties between the sales of men’s underwear and current economic conditions.


The revenue generated by men’s underwear usually stays stable because they are regarded as daily necessity instead of luxury items. However, when the economy faces a downturn, men’s underwear industry is likely to suffer from a “prolonged purchase”, according to Marshal Cohen, because male tend not to purchase new pairs of underwear until the economy gets better. As a result, men’s underwear industry is likely to witness a decrease in sales when economy is bad.


On the other hand, however, since men’s underwear companies have discovered the underlying connection between the Men’s Underwear Index (MUI) and the economics, they start to utilize predictions for men’s underwear sales as an indicator for economy conditions as a whole. In the early 2000s, men start to explore a world where their choices of underwear are no longer limited to basic black and white boxers, since companies started to make colorful and modern designs underwear with high-tech materials. These advancements signify a growing economy, which is reflected by increasing sales numbers during the time. Had the economy been growing at a stable rate, the estimated sales of men’s underwear would look like this:

MUI 1


However, as time approaches the year of 2008, the relatively stable men’s underwear industry has observed a phenomenon, which men are increasingly willing to purchase single pairs of underwear instead of multi-packs of underwear. During the recession, men’s underwear sales dropped by 2.3 percent; and it is not until in 2010 when sales began to slowly climb up again. This transition represents the change of men’s habits during times when smooth economic growth is challenged: they tend to purchase underwear only when they absolutely need to. Of course, there are men who still purchase underwear regular basis during times when economy is slowing down; but what the MUI indicates is a big picture from which people can tell the economic conditions according to increase/decrease in men’s underwear sales numbers.

MUI

Overall, the Men’s Underwear Index can be regarded as a reliable economic indicator, thanks to its stable sales behavior throughout the years. When an economic downturn arrives, men are less likely to shop for underwear on a frequent basis, therefore extending the purchasing cycle and lowering sales in the long run.


http://www.huffingtonpost.com/2012/10/09/underwear-sales-growth-economy_n_1952214.html


http://www.washingtonpost.com/wp-dyn/content/article/2009/08/30/AR2009083002761.html?hpid=topnews


http://www.businessinsider.com/mens-underwear-index-economy-indicator-2014-9


Optimistic Farmers Look Past Index Prices

When Farm Prices are low, farmers aren’t necessarily pessimistic. Farm Futures’ first survey of 2016 demonstrates that farmers are eager to plant more crops on their acreage no matter the circumstances.

At the beginning of this month, the Department of Agriculture released an index of prices received from farmers for their current month.  This index measures crop prices, livestock, and product prices. The outcome is farm prices – m/m % change is down -1.9% with an overall -5.7% and farm prices – y/y% change is down -7.1 with and overall -10.0%. The drops in numbers are mostly because of poor weather conditions earlier in the year.


graph 2

Though the chart tells the public one thing, farmers express another.

Like the economy, there are many factors to farming that can affect its status. According to the article Farm Futures’ 2016, planting intentions survey shows low prices won’t deter grower’s conditions. Bad weather that occurred last fall interrupted crops like the red wheat in the Midwest. Wheat grounds in other areas could shrink, with farms predicting only to plant 40.4 million acres in the fall, which are about 220,000 lower than last year.

“While profit margins remain in the red, farmers are reluctant to cut acreage, knowing that volatile crop prices can turn around quickly if weather problems emerge,” said Farm Futures market analyst Bryce Knorr, who conducted the survey.

Even though the percentages of farm prices are low, the survey mentioned earlier, Farm Futures’ first survey of 2016, gives a different attitude for agriculture.

After farmers took this survey, it showed that they plan on planting 89.65 million acres of corn which raises the number 1% from 2015. Soybeans could have a jump in growth as well. The report indicates that Farmers would like to plant 86.32 million acres of soybeans, which raises it 2.4% more than was previously estimated.

The fact that farmers are finding other ways to be productive, even though farm prices are low, gives the future hope. Even when the market is not doing the greatest, it does not necessarily mean it will stay that way. Food is a basic necessity that humans need; therefore food products are extremely important. Farmers and economists know this and that is what makes The Farm Prices graph so interesting. Obviously, farming will continue and more products will be created no matter what the economy looks like. Farmers’ eagerness to expand their product and invest more in other produce is a sign of adapting to the economy and its demand.

Gators & GDP

Alligator

Alligator

After reading dozens of lists of strange economic indicators, ranging from things like unclaimed corpses to baby diaper rashes, I settled on researching more about the Alligator Population Index. Believe it or not, generally when there are more alligators in the world, the economy usually is not doing so well.

The reason? Well think about it. Alligator skin is typically used to make high priced luxury goods like handbags, shoes, belts and more. Basically anything that comes in leather comes in alligator skin, except it is usually around triple the price. These items are sold in stores like Neiman Marcus, Bergdorf Goodman, Saks Fifth Avenue, and Bloomingdales. They’re produced by brands like Gucci, Hermes, Manolo Blahnik and Jimmy Choo.

And who buys these goods? Generally it is the people who have the most money to spend. The trend starts from there. If the rich are not dropping $25,000 on an alligator skin handbag, then Gucci is not buying alligator skin from the tanneries, and then the tanneries are not buying the alligators from the farmers.

So the rich are watching their funds by not buying luxury goods. Then Gucci cuts back by not buying the skins at all. Then the tanneries have no reason to buy from the farmers. And the farmers lose A LOT of money.

A New York Times article from 2009 tells the story of Tommy Fletcher, a Floridian man who was forced to shut down his alligator farming business after 5 years. In 2008, Louisiana farmers gathered over 500,000 alligator eggs fro the wild. But in 2009, for the first time in a very long time, most farmers collected none.

The article names the economy as the “lead culprit.” It discusses how “even wealthy customers began balking at the price of alligator skin products, which can range from the expensive to the wildly expensive.” Once considered a bumper crop, there was now a large surplus in the alligator skin market. Alligator farming is a business that cannot sustain itself on even a shaky economy. It is an expensive business from top to bottom. It’s expensive to buy the eggs, raise the gators, buy the skin, produce the product, and then buying the finished product.

Since that large 2009 dip in alligator products, it has since shown signs of bouncing back, with the reopening of a few farms, and the re-production of products by the high-end brands.

http://www.nytimes.com/2009/11/30/us/30gator.html?_r=0

What chart should I keep my eyes on?

To sell or not to sell.

Business Insider publishes every year the list of The Most Important Charts in the World .

To put up the list, they ask some of the world’s most influential analysts, economists, hedge-funders and traders one question: What charts are you always keeping your eyes on?

Almost all the answerers – 50 experts in economy – give a different answer. And that does not make an ordinary reader like me wiser.

I believe the 50 professionals – among them Nobelist Paul Krugman and Bloomberg’s chief economist Michael McDonough – follow more or less the same economic indexes, but what is the most important for each, depends on the job they do and the decisions they have to make.

So there is no such thing as the most important chart in the world.


I have not really been keeping my eyes on any economics chart, but now I am about to sell a hut. It is a tiny seafront cottage in my hometown Helsinki. It is surrounded by 100 other tiny cottages in the area that used to be a recreational place for city’s policemen and public transit workers.

At the turn of the millennium the city of Helsinki, who owns the land, decided that it was time for all the residents of the city to enjoy this place. Anyone living in Helsinki was allowed to buy a cottage from the area – if somebody was willing to sell.

I was one of the first “outsiders” to buy one. I bought it from an old constable’s widow for €6,000. I was lucky. The area is charming and prices of the huts soon started to go up.

Last year one of my neighbors sold her hut for €50,000. Another sold his for €38,000.

I did not consider selling mine until this August. My study year in California turned out to be more expensive than I expected (this is why).

The question is now: should I sell it or wait until later? What chart should I keep my eyes on?


I looked again at the Business Insiders most recent list of ”the most important charts in the world” (February 2015).

None of those indexes seemed to relate to my situation – except for Eurozone charts that showed that the economic situation in Europe is nothing but deteriorating.

As I need the money, I decided to follow my instinct with help of one chart.


Consumer Confidence Index (CCI) is measured world wide and ”based on households’ plans for major purchases and their economic situation, both currently and their expectations for the immediate future”, as OECD explains it.

In the U.S. the consumer confidence went down the first half of the year 2015 but increased during the summer months.

In the Euro area the confidence was increasing the first four months of the year but has since decreased. Finland’s figures are in line with the European ones.

Every month national center of statistics interviews 1200 Finnish consumers and compares their opinions to a ”normal” state. Long-term median value of the CCI in Finland is 11,8.

In June 2015 it was 10,8. In July it was 6,9.

With this in mind I figured that I should sell my cottage for any price as fast as I can, before consumer confidence is in zero.

However, when comparing to last year’s index, the CCI shows that confidence is in fact increasing. In August 2014 it was only 2,2.

When taking closer look I realized that opinions varied a lot. According to the most recent CCI 30 percent of the Finns believe that the economic situation of Finland will get better in year’s time. 27 percent believe that it will deteriorate.

What can I learn from this?


I do not think consumers are well-informed with the economics. In my opinion media fails to tell about money and markets comprehensively, and even the best economists fail to predict the future.

However, economy are not just facts. It much about trust and feelings.

When one consumer reads that – according to the CCI – other consumers are gaining confidence in the economics, he might think that: yes, it is time to buy the hut of his dreams.

And I am the one to sell him that.

There still might be people who have courage to buy a trendy cottage for a good price.