For the average person, economic indicators can be difficult to read. How can one look at the statistics released by Trading Economics and understand how the price of palm oil can affect his or her life?

In searching for a method of explanation for non-academics, I came across interesting publications. Business Insider detailed many unusual indicators, including “The First Date Indicator” and the “Plastic Surgery Indicator.” These seemed quite obvious to me. In tough times, individuals try to combat their loneliness and turn to dating. In times of prosperity and confidence, people allow themselves to splurge on plastic surgery.
But one stood out among the rest and urged me to research further: The Big Mac Index created by The Economist. It was meatier than the rest, an asset that economists could actually utilize in their projections. It gives the common person an idea of how their currency holds up against the rest.
Essentially, this index looks at the global prices of McDonald’s Big Macs and compares them. It’s based on the Purchasing Power Parity (PPP) theory that a basket of goods should eventually cost the same in various countries. The values of these goods can indicate the exchange rates for currencies.
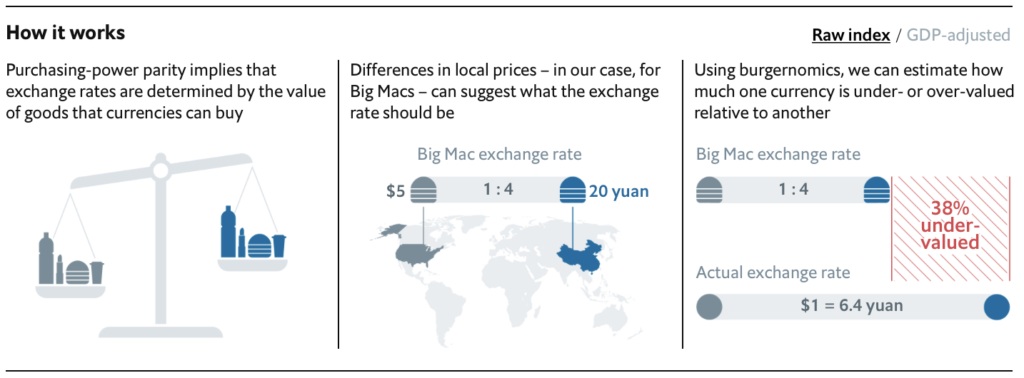
By looking at Big Mac prices, one may be able to elucidate the status of an economy and possible under or overvaluations. While this index is not precise, it can provide some interesting data.
Where it Falls Short
Naturally, prices will be lower in poorer countries, as labor is cheaper. Additionally, places like India have dietary restrictions that would prevent a Big Mac from performing well. The model uses a poultry version of this product so that India can be included in the index, but it isn’t the same. Israel provides kosher beef, while Islamic countries provide halal beef, both of which would affect price and production.
Moreover, some places consider McDonalds a western novelty, while others see it in a more casual light. Because of this, McDonald’s creates different marketing strategies for different countries. They may push harder with a more effective approach in the U.S. than in Sri Lanka. Overall, while McDonald’s is a single corporation, it can have a very different meaning between nations.
How it Surpasses Expectations
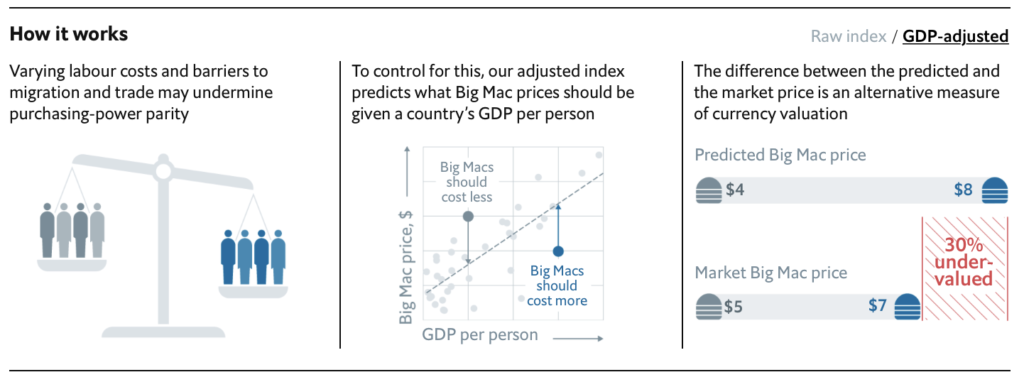
When the Economist first created this index, it was meant to be more amusing than reliable. What began as a fun tool to judge misalignments between currencies started to be taken seriously. In response, The Economist added an adjustment of GDP per person, making it more accurate.
It is now referenced to explain PPP in academic articles and textbooks, according to The Economist. One researcher, Li Lian Ong, went as far as to say that he believed the Big Mac Index could have been used to predict the Asian currency crisis. While seemingly trivial, this indicator makes a great deal of sense. One can study the movement of exchange rates in the long run, while also studying their currency’s purchasing power in other countries.
What it Tells Us Today
The Big Mac Index was created in 1986 and has since fizzled out. Most of the information on it comes from the early 2000’s and stops around 2011. Despite this, current data is still available.
The table to the right is the data reported by The Economist in July of 2018. The Key Takeaways are:
- Cheap currencies are inching closer to the dollar.
- Only three countries have higher priced Big Macs than the U.S. (Switzerland, Norway, and Sweden).
- The Euro is undervalued, but considerably less than before.
Over & Underevaluations
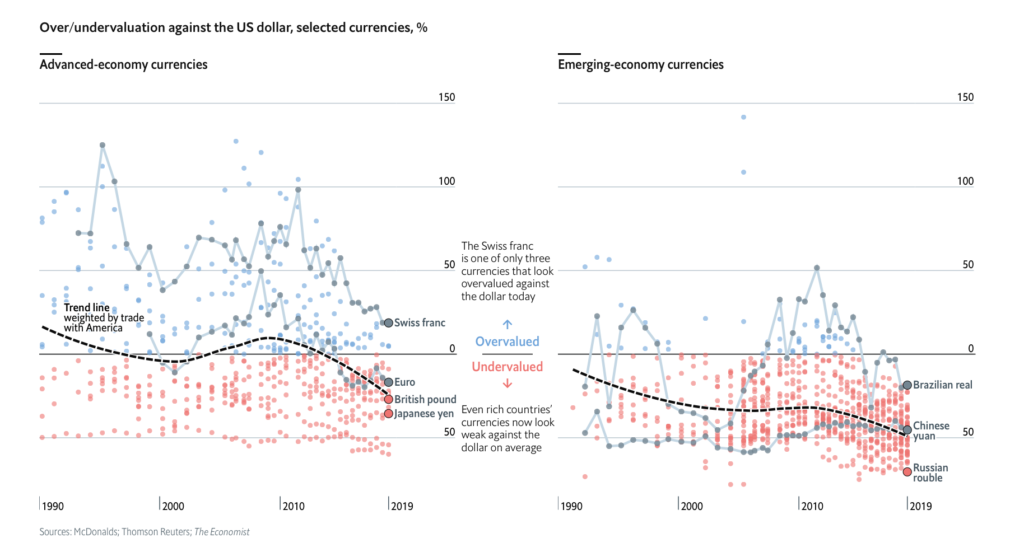
The above graphic illustrates that almost all currencies are undervalued when compared to the dollar, specifically countries with emerging economies. This makes the dollar seem very robust. But checking statistics dating back to the birth of the Big Mac Index in 1986, undervalued currencies typically grow within a ten year period.
Like all economic indicators, the Big Mac Index cannot accurately tell us what will happen in the coming years. It allows us to study the past, present, and potential futures. Some people are its biggest allies, while others are its biggest critics. Personally, I know it isn’t the most telling or reliable indicator, but I think it’s a delicious way to digest economic data.
Sources
- “Beefed-up Burgernomics.” The Economist, The Economist Newspaper, 30 July 2011, www.economist.com/finance-and-economics/2011/07/30/beefed-up-burgernomics.
- “The Big Mac Index Shows Currencies Are Very Cheap against the Dollar.” The Economist, The Economist Newspaper, 12 Jan. 2019, www.economist.com/graphic-detail/2019/01/12/the-big-mac-index-shows-currencies-are-very-cheap-against-the-dollar.
- “The Big Mac Index.” The Economist, The Economist Newspaper, 10 July 2019, www.economist.com/news/2019/07/10/the-big-mac-index.
- Boesler, Matthew. “The 41 Most Unusual Economic Indicators.” Business Insider, Business Insider, 11 Oct. 2013, www.businessinsider.com/unusual-economic-indicators-2013-10.
- Ong, L.I.. (2003). The Big Mac index: Applications of purchasing power parity. 10.1057/9780230512412.
- “Our Big Mac Index Shows Fundamentals Now Matter More in Currency Markets.” The Economist, The Economist Newspaper, 20 Jan. 2018, www.economist.com/finance-and-economics/2018/01/20/our-big-mac-index-shows-fundamentals-now-matter-more-in-currency-markets.
- Pakko, Michael R., and Patricia S. Pollard. Burgernomics: A Big Mac Guide to Purchasing Power Parity. Nov. 2003, files.stlouisfed.org/files/htdocs/publications/review/03/11/pakko.pdf.
Leave a Reply
You must be logged in to post a comment.