Popcorn Concessions and Recessions

When the world around us seems so grim, why not escape to a new one all together?


That’s the psychology behind what a handful of economist have dubbed the “buttered popcorn index,” an economic indicator which suggests that in times of recession, Americans turn to the comfort of plush velvet seats, caloric popcorn, and the thrill of being transported to a different time or place via the big screen.


In 2009, while the stock market performed terribly, domestic movie ticket sales were up over 17 percentage points, bringing what Media by the Numbers estimated to be around $1.7 billion in revenue. While some may try to argue that the impressive sales were the result of increased ticket prices, the data also indicates that the number of Americans heading to the movies had also increased almost 16%. Could this phenomenon be explained by something other than the economy, like the quality of the movies premiering at the time?


A basic look at the films racking in profit during 2009 indicates an emphatic no to the question posed above. For example, Paul Blart: Mall Cop was one of a handful of films that performed well at the time, bringing in $83 million in January of 2009. Today, the film’s crude humor and weak plot line would likely cause any rational adult to be staggered by the figure, particularly given the economic landscape at the time. But, that’s exactly the point—Americans in 2009 not only tolerated bad movies, but they actually found solace in them.


Paul Blart: Mall Cop does not stand alone in this category. Talking more broadly about a handful of films out at the time, Rodger Smith, the executive editor of Global Media Intelligence, said that it would “take a very generous person to call these pictures anything other than middle-of-the-road, at best.”


History indicates a similar phenomenon in past recessions. In 1982, theater attendance “jumped 10.1 percent to about 1.18 billion…as unemployment rose sharply past 10 percent” before admissions fell nearly 12% as the economy simultaneously picked up. Furthermore, some have said that the Great Depression was “the heyday of movie attendance in America” with many flocking to the cinema to see a film.


When the Great Recession rolled around, some predicted that box offices wouldn’t see the same bump as they had in past recessions. Many consumers were now proud owners of DVDs, high-definition TVs, and a grocery list of purchased movies in their iTunes databases. While a logical prediction, in 2009 Americans demonstrated their undying love and appreciation for a trip to the movies, even in the toughest of times. More broadly, maybe that also explains why movie ticket sales seem to be so high today—although our economy is thriving, and there are many fantastic films to see, perhaps factors such as our tumultuous political landscape, deepening partisanship divides, and wavering relations with other nations are driving Americans yet again to escape into the world of motion picture.


Sources:

http://articles.latimes.com/2008/oct/29/business/fi-hollyecon29

https://www.theguardian.com/world/2009/feb/02/usa-mediabusiness

https://www.newyorker.com/business/james-surowiecki/movies-really-are-recession-proof

https://business.financialpost.com/business-insider/the-40-most-unusual-economic-indicators

Online Celebrity Industry: The Lipstick Effect In China

(Photo credit to China Daily USA)

The online star industry is booming in China, with countless internet celebrities posing videos on the Chinese music video platforms such as Tik Tok and Kuaishou. According to the South China Morning Post, Tik Tok has 150 million daily active users in China, and its market value is more than 20 billion dollars. Kuaishou has 120 million daily active users now, and it helped the company in receiving the Tencent’s 350 million dollar investment in 2017.

Unlike other popular Chinese social media such as WeChat and Weibo, these platforms are relatively young. Tik Tok was launched in 2016, and Kuaishou was established in 2014. Tik Tok is well-known for the videos of young female bloggers who are dressed in fashionable clothing and with gorgeous makeup. Famous online cosmetics stars sometimes earn the same amount of money as some Chinese movie stars such as Fan Bingbing and Zhang Ziyi do. Kuaishou, ironically, is criticized by the China Central Television news for the videos of underage pregnant women. According to the New York Times, Yang Qingning, a 19-year-old online blogger, posted the videos of her pregnancy and baby in Kuaishou and attracted millions of followers in 2017. Behind these ridiculous mini-videos, there are a thousand strings attached.

A CCTV reporter criticizes the underage pregnant Kuaishou bloggers.  (Video credit to the New York Times)

The lipstick effect is that women tend to buy more appearance-enhancing items during times of the economic recession. When the economy is depressed, people usually downsize spending on everything. Therefore, one of the explanations for the lipstick effect is to ensure women’s reproductive success. Financially insecure women are willing to attract wealthy partners by using more makeups. For example, L’Oréal, one of the world’s biggest cosmetics companies, had sales growth of 5.3 percent in the United States in 2008, when the rest of the economy suffered from the great recession. Researchers also find that women who are living in a harsh financial situation have stronger needs for immediate reproduction than those living in a financially stable environment.

During the great recession, American female workers hoped to enhance their appearance to keep their jobs or to appeal to men. With the development of the internet and social media, young Chinese females find an easy way to show their appearances or professions online. Even better, they can earn money by posing mini-videos related to sexual connotations. In China, the infrastructure construction on the countryside cannot satisfy people’s needs, although the GDP grew 6.9 percent in 2017. With the Chinese government’s strict control of its mainstream media, the majority of people living in the countryside has limited access to the outside world. Therefore, the internet is the only place they go. For instance, one anonymous man had pretended to be a China Southern Eastern flight attendant in Tik Tok for two years by posing the photos and videos that he found on the flight attendant’s other social media. He received 30,000 followers and sold his account to another online blogger. He said he could not tolerate the life of pretending an attractive, professional and young female attendant.

The lipstick effect is always related to the sexual attraction. With the assistance of the internet, online celebrities in China now are selling their images to people around the country. They can probably find their ideal partners or at least earn some money.


Sources:

Hill, S., Rodeheffer, C., Griskevicius, V., Durante, K., & White, A. (n.d.). Boosting beauty in an economic decline: mating, spending, and the lipstick effect. Journal of personality and social psychology103(2), 275–91. doi:10.1037/a0028657

Netchaeva, E., & Rees, M. (n.d.). Strategically Stunning: The Professional Motivations Behind the Lipstick Effect. Psychological Science27(8), 1157–1168. doi:10.1177/0956797616654677

https://www.scmp.com/tech/social-gadgets/article/2150528/most-popular-iphone-app-tik-tok-hits-150-million-daily-users

https://www.scmp.com/news/china/society/article/2159157/chinas-male-online-cosmetics-stars-and-booming-new-industry

https://www.nytimes.com/2018/04/06/technology/china-censor-teen-moms.html

https://www.bbc.com/news/world-asia-china-36802769

https://www.scmp.com/news/hong-kong/economy/article/1930485/how-lipstick-effect-can-create-gloss-economic-downturn-hong

The Economic Story Behind Lipstick Sales

The rise in consumer spending is always perceived as a signpost for positive economic growth among analysts, there are, however, exceptions to this rule. Apart from the traditional economic indicators such as the unemployment rate and trade balance, there are sayings that lipstick sales can also serve as an indicator to measure the economic health of the country.

The Leading Lipstick Indicator, also known as the Lipstick Index, was coined by the Leonard Lauder, chairman of Estée Lauder, in 2011 when he witnessed the company’s lipstick sales doubled after the September 11 attacks. The idea behind the Index is that people are inclined to save up amid uncertainties and more prone to small luxuries.

History tells us that the uptick in lipstick spending often happens during economic recessions. The U.S. experienced an 11% surge in lipstick sales during the fall of 2001, while the spending on cosmetic products was up 25% back in the Great Depression. A jump in the Index mirrors a drop in consumer confidence because of the shift to relatively inexpensive luxuries.

Though the Index does not have the backing of official analysis and research to support its recession measurement, the shift in consumer behaviors heralds a diminishing consumer confidence when women forgo the pursuit of lavish handbags and jewelries and turn to affordable indulgences like lipsticks.

Despite not seeing similar lipstick sales trend in 2008, another cosmetic product is emerging as an indicator measuring economic strength. According to an interview conducted by the TIME magazine, nail-enhancing products are outpacing lipsticks that send women into a frenzy, said Lauder. The release of new lipstick shades does not excite women as much as it did decades ago. Instead of splurging on what they already own in their closets, people began to hunt for trending products in the beauty market. During the economic downturn from 2008 to 2011, the sales of nail-related goods increased exponentially by 65%, once again buttressing the analysis that people tend to avoid big purchases and pamper themselves with small luxurious products in times of economic hardship.

As time goes by, the lipstick effect has evolved as a term to describe the rise of smaller-ticket purchases amid economic downturns. As people are pulling back on opulent enjoyment, the odds of a falling economy grow.

So everyone, be wary the next time when you are about to purchase a lipstick. It might signal a slowdown in the economy!

Sources:

What Lipstick Tells Us About the Economy


https://www.economist.com/unknown/2009/01/23/lip-service

Consumer Confidence: An Underappreciated Indicator

In the world of economics, real numbers, unsurprisingly, have always been the pinnacle of people’s attention. Economy is about money, and what better way to talk about money than numbers representing actual money involved in the economy. However, there is always more to the big picture than meets the eye, and besides the buzz around more commonly used economic indicators, such as Consumer Price Index, and Producer Price Index, the less talked-about, and lesser-known Consumer Confidence deserves much more recognition than it currently gets. Consumer Confidence is, in fact, monumental, in that it reflects on many of the most important areas of the economy, such as housing, unemployment, and inflation. Furthermore, unlike CPI and PPI, trailing indicators that document the past, Consumer Confidence, a leading indicator, often times paints us an accurate picture of what the economy looks like in the foreseeable future, and that is where the key difference lies. Although there is much to be learnt from the history and the recent past, we study economics for the future, and more time and energy ought to be devoted to analyzing stats that predict economy in the future, rather than the past.


Consumer Confidence is, in itself, a comprehensive, yet somewhat abstract indicator due to the many factors that come into play when it is calculated. When being asked to consider future expenditure, consumers would weigh their economic circumstances carefully, and give their opinions, namely, confidence level. The higher the Consumer Confidence in general, the more consumer-friendly the current market and economy is, and the more consumption will be taking place. Because it is measured by opinion polls and surveys filled out by the general public, the results are directly from the consumers themselves, and so is highly representative of the overall consumption in the next six months. It is relatively abstract because the Consumer Confidence numbers will be a result of many aforementioned factors combined, without clearly stating how each is faring in specific. Still, it does its job in predicting the general trend of consumption in an economy.


While indicators like CPI and PPI presents a picture faithful to economy in the past, Consumer Confidence takes advantage of conditions of the near past and present to make an outline for the future. Granted, we could look at the pattern of recent CPI and PPI, and predict that it is highly probable that the trend will continue. But, these indicators being what they are, in essence, trailing indicators, they have no way of estimating a change in the pattern ahead of time. In economics, timing is crucial, and a leading indicator like Consumer Confidence has the benefit of providing people with the convenience of being able to know what happens ahead of time. The leeway helps governments to be Johnny on the spot when making new policies, and can prevent them from losing money. More analysis on Consumer Confidence can prove quite valuable for governments in the long run, for it will help stabilize the economy, and kill off potential financial setbacks before they take form.

Pick A Pickle to Understand Urbanization in China

We can always rely on food to tell changes in an economy.

Zhacai (榨菜) is a type of pickled mustard plant stem similar to Korean Kimchi. In China, it is popular among low-income group, particularly transient workers. By looking at the change in the sales of zhacai in different regions, one might tell where the workers were flowing into, which reflects how the cities has developed.

There has been large demand for labor forces as China embraces aggressive urbanization since its Reform and Opening-up. More and more breadwinners of rural households have attempted to opt out the life as farmers to pursue an imaginarily decent one in modern cities. In 1950, 13% of people in China lived in cities; by 2010, the urban share of the population had grown to 45%. The idea of using zhacai as an economic indicator was brought up in 2013 by Prof. Ba Shusong, Deputy Secretary General of China Society of Macroeconomics. He predicted that transient workers in east coastal areas would go back to their hometowns in west central China, as labor-intensive industries in the coastal areas had begun to migrate to the central regions since 2008 due to rising costs in land and resource.

According to the financial statements of Chongqing Fuling Zhacai, the biggest zhacai manufacturer in the country, from 2010 to 2012, the sales in Central China, Northwest China and Central Plains increased by 67.4%, 65.2% and 56.8% respectively, while the growth rate of South China was only 8.82% during the same period, which was the lowest in the nine sales regions of the country. The data then consolidate the argument of Prof. Ba.

The concept, however, is not entirely academically accurate. A migrant worker, for instance, might stop buying zhacai because of rising income levels or changing dietary preferences, while he himself was not migrating to anywhere else. Such changes would not reflect the physical move of the consumers.

Despite that, government officials in Guangdong Province might felt a huge relief seeing this number, for it suggests that their pressure on resettling the migrant population will be greatly reduced. Officials in the west central China, however, would have to feel a little bit of anxiety, because they might need to cope with tens of millions of people returning to the towns – they would then be crowded with problems of employment, health care and public services…

Indexes and Indicators

If you’re reading this, you’re most likely in college or at least very familiar with higher education. If so, you may be aware of the yearly increase colleges make to their final Cost of Attendance (COA). Yes, part of that may be because of the increased expenses and simply an administrative decision, but there is another underlying reason the cost goes up in small (though sometimes not-so-small) increments. Take the tuition of University of Southern California, for example.


The Widney House, then known as Hodge Hall at the University of Southern California circa 1880. 

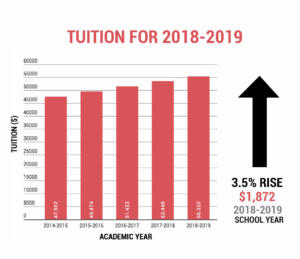
The original cost of tuition when USC was first founded in 1880 was a whopping $15.00 per term. Today, that is about the cost of a single dining hall meal at USC (if not cheaper). But if we examine even the past few years, the tuition at the University of Southern California has increased 3.5% or more every year. The economy experiences inflation and the American dollar’s value starts to depreciate. In other words, you have to start paying more money for the same products, like your panini sandwiches.  

Graphic made by Baylee Nagda from the Daily Trojan Newspaper


The inflation, or the “weaker dollar,” versus deflation, or the “stronger dollar” refers to how much value the same dollar bill holds. Though it is important to note that this is not true in every case—sometimes, the rising prices may simply signal a bustling economy and the dollar will increase along with the stimulated economy. 

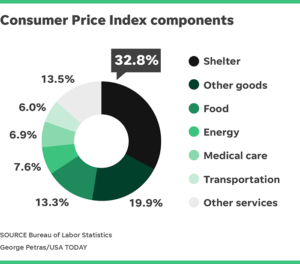
But why is this important? The strength of the dollar in any nation’s economy can be a strong economic indicator. One way of measuring inflation is through the Consumer Price Index, or CPI for short. It takes a general list of essential things most Americans or the citizens of a certain nation buys and tracks its cost. Seeing where the trend lies in the Consumer Price Index can let us know as Americans, consumers, investors, and global citizens how the foreseeable economic future will be shaped to some degree. This knowledge can influence what we choose to do or not do with our money, influencing decisions.


In more specific breakdowns, these statistics are differentiated by Urban consumers and non-Urban consumers. The Bureau of Labor Statistics from the US Department of Labor reveals a monthly Consumer Price Index summary— this past month in July of 2018, the Bureau reported that the CPI has increased 0.2 percent.


Graphic by George Petras from USA Today. 


However, Dan Caplinger of the USA Today speculates that the inflation rate isn’t always accurately reflected in our everyday lives. He explains that the statistics for the Consumer Price Index that is taken are averages of the general population. This includes different categories of the workforce such as employed, unemployed and the growing group of the baby boomer generation that is starting to retire. Thus, different age brackets and income brackets. Age inevitably has a stronghold of influence on our personal spending, but also the allocation of money even within our “necessities.” An example would be that health care is most likely to cost more the older you get. Yet, some may argue that in the bigger picture of economic activity, a specific demographic will only change consumer behavior so much. Ultimately, consumers will spend when the economy is favorable and spending becomes attractive. 


Understanding that the primary goal of CPI statistics are for tracking the economy rather than personal accuracy is important to note. This means that the CPI statistics are not going to be accurate in every neighborhood of the United States, but are referenced as the average cost of an item during a certain time period. Considering all of these factors, we can extrapolate from this data to give us guiding clues about how the economy is going to behave.

The Corruption Perceptions Index

It seems as though daily someone gives another push to the revolving door that is scandal in the Trump administration. Last week, it got quite the shove, as Trump’s former personal attorney Michael Cohen said in court that the president had directed him during the 2016 campaign to pay off two women who claimed they had affairs with Trump. Cohen’s accusation implicates the president in a federal crime.

Many across the country—and across the world—see the Trump administration and the United States as heavily corrupt. The U.S. is, however, the 16th least corrupt country in the world, according to the Corruption Perceptions Index (CPI), that is.

The CPI is published yearly by Transparency International (TI), an NGO dedicated to fighting global corruption. It is perhaps the best-known measure of corruption worldwide. The CPI ranks 180 territories on a scale from 0 to 100. The closer the country’s score is to 100, the better that country prevents government corruption. A score below 50 implies the country has deeply-rooted issues with corruption, while a score below 30 suggests the country is capable of meddling in a U.S. presidential election wherein the winner of that election might go against all American intelligence officials and deny the country guilty of any wrongdoing. Just kidding. But it does suggest that corruption for the country is as basic as borscht.

The CPI takes into consideration the results of 10 surveys and studies conducted by a range of institutions. Sources include the World Bank, the African Development Bank, data from the Economist Intelligence Unit, and executives at the World Economic Forum. Transparency International evaluates the quality of studies gathered and employs a team of both in-house and independent researchers to assist in original data collection.

Participation in corruption can affect an organization in negative ways whose effects are felt long-term. In many cases, corruption causes inefficiency, especially when funds are wrongfully used. Bad press is sure to follow instances of realized corruption, likely causing customers to lose confidence in its business practices. An organization’s damaged reputation discourages possible business partners from becoming involved.

At this point, the company might need an entire public relations campaign to regain its footing, costing both time and money. This dedication of resources might rob another area of the company of the attention it needs, exposing inefficiencies and potential financial losses. This scenario can be applied to an entire country and its economy.

Corruption is discouraged when there are tools of accountability in place. They promote a culture that values stout ethical practices while maintaining a system of punishment for those who breach standards. Companies can minimize corruption by implementing easy ways to report offenses.

It’s still unclear whether or not Trump will ever be prosecuted for any instances of corruption, but it’s doubtful that he’ll retain the services of Michael Cohen if he is.

Invisible influence—why traditional supply and demand aren’t the only forces driving commodity prices

If you’re like me, and every other average American, you’re happy to reach for your 1.96 cups of coffee each morning. You’re probably even happier that market prices for commodity coffee have been in sharp decline since 2015 and that, if you’re reading this, you’re living in the US where the average price of a cup of coffee is $2.70. Life is good for the caffeine addict and the general consumer alike—commodity prices are down. Theoretically, this means that abundant supply and stable demand have reconciled to make low prices and happy consumers.

As a zealous consumer of coffee, it is simple to examine the economy from my perspective as a consumer, my perspective where lower prices equate to a “better” economy. That perspective, however, is not only narrow-minded, but also ignorant. A full economic picture must examine each step of the supply chain, green coffee grower to distributor. Why? Because each player takes a cut of that $2.70 you pay at Starbucks each morning before your 8am lecture, morning meeting, or daily workout.

The free-market economy suggests that prices are determined by two factors—supply and demand.

Coffee

These economic rules may seem fairly pedestrian, but may be visually represented by the above graph showing the steady decline in coffee prices in the late 90s and early 2000s. General consensus credits this decline in the commodity price of coffee to a new entrant in the coffee producer scene—Vietnam (“The Global Coffee Trade,” Stanford Graduate School of Business). In contrast, 2014 yielded abnormally high coffee prices due to a prolonged drought in Brazil which rendered inadequate supply to satiate the appetites of worldwide caffeine consumers. With coffee demand growing relatively uniformly worldwide, market price fluxes appear to be most strongly correlated with supply disruptions.

Supply volatility, however, is not the singular issue.

Here’s the reality—coffee farmers cannot live on their negotiated wages, are subject to the whims of climate (even more so in the past decade), and lack the infrastructure needed to process and roast their coffee beans, leaving them with little bargaining power. While processors like Nestle and P&G certainly take advantage of their roasting infrastructure and supply chain, there is a deeper truth about commodity pricing—consumers demand superior products at low prices. How can free markets support and satisfy all members of the economy, producer to consumer, while operating under these parameters?

An attempt at a short answer to a long question about coffee economics, supply, and demand is this: because consumers, coffee enthusiasts like you and me, want lower prices, companies will fight on our behalf to get those lower prices. That is their role as competitive businesses. When we think about supply and demand, we cannot merely consider how much we demand, but what exactly we are demanding. We—I—demand high quality, superior tasting, convenient, caffeine-rich coffee at a good price every time I step into the coffee shop.  Those are intangible properties I associate with my tangible good. If I’m not willing to pay for those intangibles at the coffee shop, a coffee grower in Brazil will be paying for them instead.


Consumer Sentiment as an Economic Indicator

Getting people to purchase a good or service is the primary goal of any functioning company in the world. Corporations spend millions of dollars to understand what makes people tick, on research analysis, focus groups, in-depth marketing, and surveys, and what might influence them to purchase products. The level of confidence that households on a wide scale have in the economy and vis-a-vis their personal finances is extremely vital to any organization. Consumer sentiment helps companies better understand how much of a good to produce, as well as where best to sell. Whether it is an apparel company like Nike attempting to figure out how many shoes to produce this year while projecting its American sales figures, or a technology company such as Apple setting its targets for a new iPhone, companies highly desire the latest consumer attitudes on the economy.

For decades, consumer confidence has been tracked by the The Conference Board by Nielsen, a global provider of information and analytics on the buying and watching habits of people around the world. The consumer confidence index helps measure the health of the U.S. economy and is “based on consumers’ perceptions of current business and employment condition, and their expectations for business, employment, and income for the next six months.” The company surveys thousands of households every month, with five questions total — two related to present economic conditions and three regarding expectations. Each question can be answered positively, negatively, or neutrally. Since 1985, the index has been set to 100. Today, the index is at 95.3 for the month of August 2018, the lowest in a year.

To explain the low confidence, “consumers voiced the least favorable views on pricing for household durables in nearly ten years, since October 2008. Vehicle buying conditions were viewed less favorably in August than anytime in the last four years, with vehicle prices being judged less favorably than anytime since the close of 1984. Home buying conditions were viewed less favorably in early August than anytime in the past ten years, with home prices judged less favorably than anytime since 2006.” In other words, some of the most important things that people purchase, that they spend the largest amount of money on and use nearly every day for a long period of time – cars and homes – have highly unfavorable prices and supply. With cars, the decline in consumer favorability could be explained by a sudden shift in preference from sedans (long a staple of the American economy and road) to more costly, larger cars like SUVs and crossovers, without the adequate supply to satisfy rising demand; additionally, this year marks the highest average cost of a used car in 13 years.

All types of organizations – including investment firms, manufacturers, retailers, global financial management firms, as well as governments – see the sentiments of consumers as key to planning strategy and actions for the foreseeable future. According to Yahoo, because weak consumer confidence may indicate declining consumer spending, manufacturers will likely decrease their inventories in advance. Asset management firms or institutional investors might not invest in new projects and companies involved in the large-scale selling of goods, such as retailers like Walmart. Construction of homes will decline due to lower demand. Governments would need to ready for future tax revenues reduction and quickly figure out where its spending cuts will likely have the least significant impact.

The consumer confidence index is considered to be a leading economic indicator for the United States economy. Additionally, the Organization for Economic Cooperation and Development (OECD) considers consumer confidence a global leading economic indicator. Thus, by analyzing consumer confidence, investors, companies and governments alike will get a better sense of what they should do to reflect the latest attitudes about the economy.

Sources:

https://www.wsj.com/articles/america-has-fallen-out-of-love-with-the-sedan-1535169698

https://www.usatoday.com/story/money/cars/2018/06/15/used-cars-price-hit-record-high/700362002/

https://tradingeconomics.com/united-states/consumer-confidence

https://finance.yahoo.com/news/why-consumer-confidence-important-economic-170019558.html