Motor Vehicle Sales Predict the Future of the U.S. Economy

(Photo Credit to Brookings.edu)

Motor vehicles have become a major part of the U.S. economy since its creation. They continue to rule the streets of the U.S. in the forms of cars, trucks, and buses. Although it has become such an integral part of our daily lives, the total sales of motor vehicles are the key to predicting the future of the U.S. economy. 

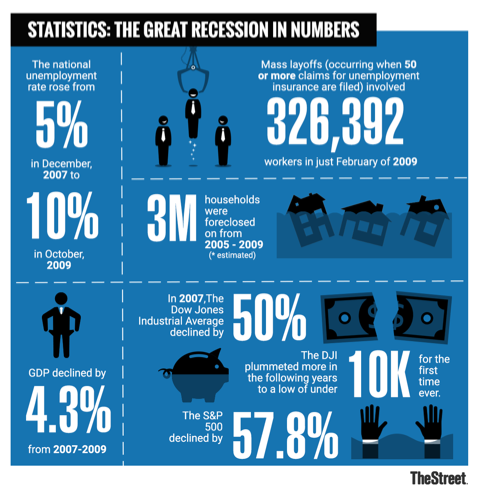
In the last 29 years, the U.S. economy has gone through tremendous ups and downs. The lowest the economy has fallen in the last 29 years was from 2007 to 2009. This period is known as the Great Recession. During the Great Recession, the unemployment rate doubled from 5% to 10%, about 3M households were foreclosed on from 2005 to 2009, and the GDP in the U.S. declined by 4.3%. For those living in the U.S. during this time, it became clear that there was something very wrong with the economy. 

To indicate how the economy is transforming through any time, economists may analyze the Gross Domestic Product, the Consumer Price Index, or the interest rate. However, an economic indicator that may not seem as apparent as the GDP, for example, is the total motor vehicle sales in the U.S. 

According to Julia Kagan at Investopedia, the total motor vehicle sales is “the number of domestically produced units of cars, SUVs, mini-vans and light trucks that are sold.” The total number of motor vehicle sales in the U.S. is measured by the reported sales by individual manufacturers on the first business day of every month. Although one may categorize the sale of motor vehicles as a part of consumer spending in general, motor vehicles play such an integral role in our society that it may act as an economic indicator.   

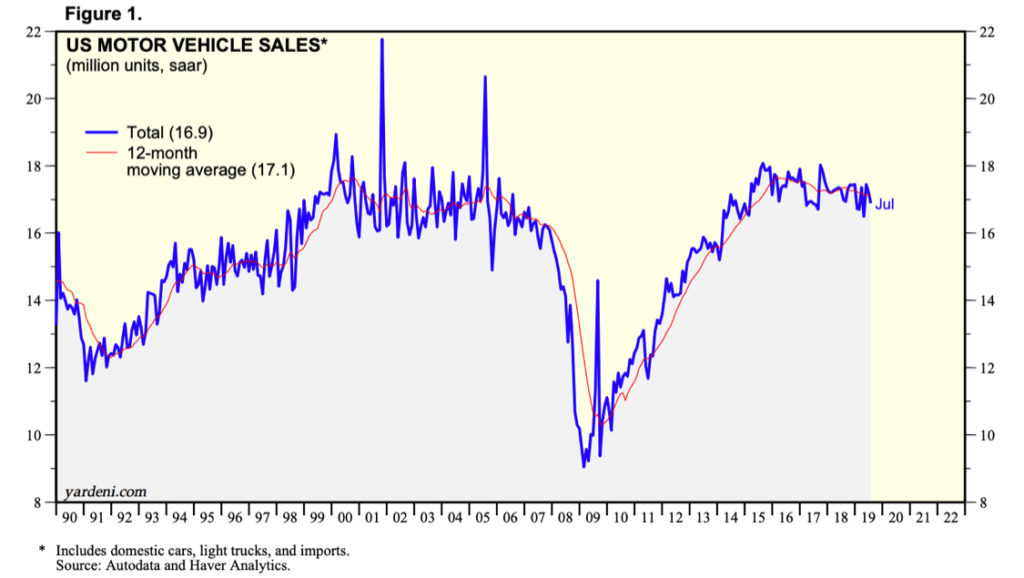
In Figure 1, it is clear that leading up to the Great Recession, the total vehicle sales in the U.S. was steadily positive from the period of 1991 to the middle of 2007. Then, the Great Recession occurred, and all motor vehicle sales dropped significantly until the beginning of 2009. Although there are various factors associated with this significant drop, it is important to note that, during this time, the Big Three automakers in the U.S. had to ask Congress for help similar to the bank bailout. At that point, General Motors Company and Chrysler LLC faced bankruptcy, and the Ford Motor Company needed help to compete with other automakers. Eventually, sales began to rise and have now started falling. 

In 2019, the first-quarter auto sales have dropped by nearly 2.5% from the previous year, according to J.D. Power and LMC Automotive. This is due to auto manufacturers producing more expensive cars rather than cheaper cars, which helps the used car industry but hurts the new vehicle market. However, it is important to also think about the demand for new cars. The demand for new cars may be decreasing due to various economic factors that relate to consumer confidence. Therefore, the total motor vehicle sales in the U.S. acts as an economic indicator that is telling of the future of the U.S. economy. 

(Photo Credit to Huntington Beach Ford)

Sources

https://www.investopedia.com/terms/m/motor_vehicle_sales.asp

https://www.cnbc.com/2019/03/26/us-auto-sales-are-falling-and-cars-are-more-expensive-than-ever.html(J.D. Power and LMC Automotive)

https://www.yardeni.com/pub/ecoindauto.pdf(Figure 1)

https://www.thestreet.com/politics/what-was-the-great-recession-14664025(Statistics: The Great Recession in Numbers)

https://www.history.com/topics/21st-century/great-recession-timeline

https://www.thebalance.com/auto-industry-bailout-gm-ford-chrysler-3305670

The Morning Beverage Brewing The American Economy

American adults are drinking record high amounts of coffee and the price of coffee is dropping along with it. According to Reuters, sixty-four percent of American adults had a cup of coffee in their previous day as of 2018. Some have labeled coffee as “black gold” because of its value in the global economy.  

Yet, the world’s largest coffee chain, Starbucks Coffee, is closing its doors at over 150 store locations in 2019. To many, it may feel like there is a Starbucks on every corner and the closing of these locations may seem insignificant but in the past, the trends of Starbucks have indicated the state of the economy as well future consumer trends.

In 1983, Starbucks CEO, Howard Schultz, began shifting the stores focus as a coffee bean retailer into a chain of American cafes. According to CNBC, sales soared from $2B to $9.4B between the years 2000 and 2007. There was a significant hit in 2007 and the American economy began to face the great recession. According to the New York Times, Starbucks had to close 600 of its stores at the height of the American recession in 2008. The company laid off more than 12,000 employees and the stock price dropped more than 24 percent of that year. The annual percentage change (rate of inflation) was at 3.8% in 2008 during this time.

In a study done by the NCA USA Economic Report, consumers spent $74 billion on coffee in 2015. With the coffee industry accounting for 1.6% of the total U.S GDP. The industry is keen on depicting consumer spending given the majority of adult Americans are drinking coffee.  

(Graphic created by NCAUSA)


Starbucks will be closing 150 stores in 2019, which is triple the number of stores that it closes annually. The result of this can be mere over-saturation of Starbucks cafes that flood the corners of American cities which leads to a lack of store loyalty to individual locations. This may also be a result of consumers beginning to show less interest in sugary beverages. Whatever the cause may be, the important takeaway is that  there is a possibility of an American recession in the near foreseeable future. 

The Dow Jones dropped 800 points on August 14th as a result of a global economic slowdown. The U.S is currently facing a trade war in China which can hurt chains like Starbucks who have 3,300 stores sprawled across their country as well as imports for various mugs and equipment that are produced in China. The global influence that Starbucks has, stands as a representation of  not only what is happening with American consumers but also for what is yet to come. Starbucks began experimenting with a new line of luxury store locations named “Starbucks Reserve” and has seen wide success, but if consumer spending does not reflect positively, This shift towards a fancy coffee cafe may hurt them in the future of their business.

Additional Sources:

https://www.reuters.com/article/us-coffee-conference-survey/americans-are-drinking-a-daily-cup-of-coffee-at-the-highest-level-in-six-years-survey-idUSKCN1GT0KU

https://fortune.com/2018/06/19/starbucks-store-closing/

https://www.nasdaq.com/markets/coffee.aspx?timeframe=10y

http://www.ncausa.org/industry-resources/economic-impact

The Juiciest Economic Indicator

For the average person, economic indicators can be difficult to read. How can one look at the statistics released by Trading Economics and understand how the price of palm oil can affect his or her life?

In searching for a method of explanation for non-academics, I came across interesting publications. Business Insider detailed many unusual indicators, including “The First Date Indicator” and the “Plastic Surgery Indicator.” These seemed quite obvious to me. In tough times, individuals try to combat their loneliness and turn to dating. In times of prosperity and confidence, people allow themselves to splurge on plastic surgery. 

But one stood out among the rest and urged me to research further: The Big Mac Index created by The Economist. It was meatier than the rest, an asset that economists could actually utilize in their projections. It gives the common person an idea of how their currency holds up against the rest.

Essentially, this index looks at the global prices of McDonald’s Big Macs and compares them. It’s based on the Purchasing Power Parity (PPP) theory that a basket of goods should eventually cost the same in various countries. The values of these goods can indicate the exchange rates for currencies.

https://www.economist.com/news/2019/07/10/the-big-mac-index

By looking at Big Mac prices, one may be able to elucidate the status of an economy and possible under or overvaluations. While this index is not precise, it can provide some interesting data.

Where it Falls Short

Naturally, prices will be lower in poorer countries, as labor is cheaper. Additionally, places like India have dietary restrictions that would prevent a Big Mac from performing well. The model uses a poultry version of this product so that India can be included in the index, but it isn’t the same. Israel provides kosher beef, while Islamic countries provide halal beef, both of which would affect price and production.

Moreover, some places consider McDonalds a western novelty, while others see it in a more casual light. Because of this, McDonald’s creates different marketing strategies for different countries. They may push harder with a more effective approach in the U.S. than in Sri Lanka. Overall, while McDonald’s is a single corporation, it can have a very different meaning between nations.

How it Surpasses Expectations

When the Economist first created this index, it was meant to be more amusing than reliable. What began as a fun tool to judge misalignments between currencies started to be taken seriously. In response, The Economist added an adjustment of GDP per person, making it more accurate. 

https://www.economist.com/news/2019/07/10/the-big-mac-index

It is now referenced to explain PPP in academic articles and textbooks, according to The Economist. One researcher, Li Lian Ong, went as far as to say that he believed the Big Mac Index could have been used to predict the Asian currency crisis. While seemingly trivial, this indicator makes a great deal of sense. One can study the movement of exchange rates in the long run, while also studying their currency’s purchasing power in other countries. 

What it Tells Us Today

The Big Mac Index was created in 1986 and has since fizzled out. Most of the information on it comes from the early 2000’s and stops around 2011. Despite this, current data is still available.

The table to the right is the data reported by The Economist in July of 2018. The Key Takeaways are:

  • Cheap currencies are inching closer to the dollar.
  • Only three countries have higher priced Big Macs than the U.S. (Switzerland, Norway, and Sweden).
  • The Euro is undervalued, but considerably less than before.

Over & Underevaluations

https://www.economist.com/graphic-detail/2019/01/12/the-big-mac-index-shows-currencies-are-very-cheap-against-the-dollar

The above graphic illustrates that almost all currencies are undervalued when compared to the dollar, specifically countries with emerging economies. This makes the dollar seem very robust. But checking statistics dating back to the birth of the Big Mac Index in 1986, undervalued currencies typically grow within a ten year period.

Like all economic indicators, the Big Mac Index cannot accurately tell us what will happen in the coming years. It allows us to study the past, present, and potential futures. Some people are its biggest allies, while others are its biggest critics. Personally, I know it isn’t the most telling or reliable indicator, but I think it’s a delicious way to digest economic data.

Sources

  1. “Beefed-up Burgernomics.” The Economist, The Economist Newspaper, 30 July 2011, www.economist.com/finance-and-economics/2011/07/30/beefed-up-burgernomics.
  2. “The Big Mac Index Shows Currencies Are Very Cheap against the Dollar.” The Economist, The Economist Newspaper, 12 Jan. 2019, www.economist.com/graphic-detail/2019/01/12/the-big-mac-index-shows-currencies-are-very-cheap-against-the-dollar.
  3. “The Big Mac Index.” The Economist, The Economist Newspaper, 10 July 2019, www.economist.com/news/2019/07/10/the-big-mac-index.
  4. Boesler, Matthew. “The 41 Most Unusual Economic Indicators.” Business Insider, Business Insider, 11 Oct. 2013, www.businessinsider.com/unusual-economic-indicators-2013-10.
  5. Ong, L.I.. (2003). The Big Mac index: Applications of purchasing power parity. 10.1057/9780230512412. 
  6. “Our Big Mac Index Shows Fundamentals Now Matter More in Currency Markets.” The Economist, The Economist Newspaper, 20 Jan. 2018, www.economist.com/finance-and-economics/2018/01/20/our-big-mac-index-shows-fundamentals-now-matter-more-in-currency-markets.
  7. Pakko, Michael R., and Patricia S. Pollard. Burgernomics: A Big Mac Guide to Purchasing Power Parity. Nov. 2003, files.stlouisfed.org/files/htdocs/publications/review/03/11/pakko.pdf.


21st Century: Internet Speed as an Economic Indicator

The Internet’s impact on global growth is rising rapidly. The Internet accounted for 21 percent of GDP growth over the last five years among the developed countries MGI studied, a sharp acceleration from the 10 percent contribution over 15 years.
(McKinsey Analysis)

The next time you are in a public place take a look around you. Nine out of ten people you see have just recently been on the internet. And among young adults ninety-nine out of every one hundred have recently been online. The internet has changed our lives in the way that we are able to do work, exchange and discover new ideas, socialize, and communicate with one another. However, it is not often that we think about the significance of this transformation in economics and how it can be used to measure economic growth. 

Individuals from large enterprises, individual consumers, and small up and coming entrepreneurs all benefit from the enormous opportunities the internet has created such as building a competitive environment, boosting infrastructure and access, providing purchasing power, as well as nurturing human capital. In harmony these components have maximized economic growth and prosperity. 

If internet were a sector, it would have a greater weight in GDP than agriculture or energy. (McKinsey Analysis)

If measured as a sector of the GDP, internet related consumption and expenditures, would be larger than the agriculture and energy sectors. In the McKinsey Global Institute study on broadband internet and economic growth and prosperity, internet accounted for 3.4% of the GDP in the 13 nations researched.  

Internet speed can be used as an economic indicator because it correlates with a given countries internet contribution of GDP. Countries with a strong internet supply in terms of speed and broadband connectivity strength correlate with a higher internet contribution to GDP. For example, Sweden and The United States have the best “internet ecosystems” in the world and this correlates with their internet contribution to GDP. Which is respectively 3.9% in Sweden and 4.7 % in the United States. The average internet connection speed in Sweden is 22.5 Mb/s and 18.7 Mb/s in the United States. When compared to Germany which has a lower average connection of 15.3 Mb/s, internet related expenditures only account for 1.9% of the Germany’s GDP.  

Internet Contribution to GDP (McKinsey Analysis)

However, it is important to highlight that in most studies on developed nations it is noted that this positive correlation of broadband strength and economic growth reaches a threshold and other economic indicators should be used in conjunction when accessing economic growth. 

Sources:

https://www.statista.com/topics/2237/internet-usage-in-the-united-states/

https://www.businessinsider.com/mckinsey-report-internet-economy-2011-5

https://en.wikipedia.org/wiki/List_of_countries_by_Internet_connection_speeds

https://www.mckinsey.com/~/media/McKinsey/Business%20Functions/McKinsey%20Digital/Our%20Insights/Essays%20in%20digital%20transformation/MGI_Internet_matters_essays_in_digital_transformation.ashx

More fashion brands are joining the acquisition game

In September, multiple news outlets reported Michael Kors’ move to buy Italian fashion house Gianni Versace for about €2 billion ($2.35 billion). The acquisition marked one of the first attempts by an American fashion company to run a high-end European brand.

Michael Kors was known for “affordable luxury”. Despite the CEO’s working background in fashion brand, the brand is widely popular among investors and fans for its handbags that are no less than $500. Versace, on the contrary, sells clothes and bags with the price of no less than $1500. The Italian fashion brand is best known for proactive designs and its popularity among high-profile movie stars. However, the revenue of Versace stagnated at roughly €700 million in 2017.

Donatella Versace, Versace’s chief designer, said MK could help her company to develop the accessories business and provide them with the expertise in digital commerce. Michael Kors said in an announcement that they expected Versace to grow to $2 billion in annual sales, while still targeting at the luxury part of the brand.

The stock of Michael Kors, which has gained more than 45 percent in the past year, fell 8.2 percent on Sept. 24 after the publication of reports about the deal. Private equity firm Blackstone Group, which bought a 20 percent stake in the firm four years ago, announced that it would sell its holding.

Traditional fashion companies are facing the threat of rising fast fashion brand, which produce clothes, bags, accessories year around at a surprisingly cheap price. The increasing online shopping choices are also squeezing the traditional brands out. Meanwhile, they have to compete against each other.

Last year Michael Kors bought Jimmy Choo, a shoe brand, for $1.2 billion, aiming to forge a “global fashion luxury group”, as said by its chief executive John Idol.

There were a handful of precedents to form luxury conglomerates in the fashion industry. Both LVMH and Kerring, the French holding companies, own more than a dozen brands each and have been growing faster than U.S. competitors. Last year, Coach joined the acquisition game and bought Kate Spade and changed its name to Tapestry to portray itself as a holding company.

The Wall Street Journal predicted that more M&A cases in luxury brands could follow, since “deteriorating sales provide an incentive to cash out”.


The Digital Age of What Used To Be Late Night

In the world of late night television, the year 2018 has seen, interestingly, two polar opposite states from two types of big-time players. On the network side, it is the same old story. As the most polarizing president in decades keeps making waves in office, CBS’ Late Show maintains a firm lead over NBC’s The Tonight Show, while ABC seems to be okay with its Jimmy Kimmel Live! sitting in third place year after year. The irony lies in that, while the new bloods are doing the same things they have been doing for years in the same format that has been around for decades, the two titans of the past have, somewhat quietly, branched out to accommodate a new age of entertainment.


In the last part of his glorious 33 years in late night television, David Letterman was a very different man from the young eccentric-costume-wearing, hydraulic-press-operating, watermelon-and-paint-dropping gap-toothed man on NBC who was synonymous with coolness. Despite social media gaining traction, Letterman was oblivious, and carried on as a broadcaster, and a broadcaster alone. Similarly, when Conan O’Brien was outcast from his Tonight Show gig and moved to basic cable, he stayed with the hour-long network format he had known his entire late night career, and kept banging out shows nightly as usual. However, they have both significantly shaken up their past image of sticklers in 2018 by stepping into digital platforms.


In early 2018, David Letterman came out of retirement from hosting and started an interview program on Netflix streaming. In October, Conan O’Brien announced he would be launching a podcast the next month, as his show switches from the hour-long format to a 30-minute format that does not include interviews. Both announcements took many by surprise, as the two oldest and most staunch defenders and supporters of network broadcast injected a strong dose of modernity into their veins.


Granted, there are obvious reasons to not make a big deal out of these decisions. David Letterman had been retired for over two years, and one could argue he was trying to overcome boredom with his Netflix deal. And while Conan O’Brien was still doing the grind, not many watched anyways, and long gone was he mainstream relevance. It was quite likely they chose the new platforms simply because their alternatives were not that good. And that point is well taken.


However, one would be foolish not to recognized the way technology has reshaped the entertainment infrastructure. Without the new digital platforms and genres such as Netflix streaming and podcasts, Letterman would stay bored at home-be it Montana, Manhattan or Connecticut, and O’Brien would still be making shows for basically nobody. Online platforms have gradually been taking talents away from traditional broadcast, especially in primetime programming. Though they have yet posed a threat to network late night shows, Letterman and O’Brien’s acceptance, which contrasts their past attitudes greatly, brings the competitiveness of digital entertainment to a new high. Networks had better already been taking measures, otherwise it would really be all too late when Jay Leno puts out a comedy special on Hulu.

Labeling carbon like calories: can food labels change consumer choice?

The United States emitted 6,511 million metric tons of carbon dioxide in 2016. Approximately 8% of those emissions are associated with agricultural industry. Globally, agriculture accounts for 24% of global emissions. Livestock alone accounts for about 14.5% to 18% of global totals, making the impact of animal production alone greater than that imposed by the entirety of global transportation. These emissions are warming the planet and cause for grave economic concern, should inaction remain the dominant strategy.

Pie chart showing emissions by sector. 25% is from electricity and heat production; 14% from transport; 6% from residential and commercial buildings; 21% from industry; 24% from agriculture, forestry and other land use; 10% from other energy uses.

Source: EPA

According to Drawdown, the self-proclaimed  “most comprehensive plan ever proposed to reverse global warming,” shifting to plant-rich diets is ranked the fourth most impactful solution (out of 80), reducing atmospheric CO2 by 66.11 gigatons.

If 50 percent of the world’s population restricts their diet to a healthy 2,500 calories per day and reduces meat consumption overall, we estimate at least 26.7 gigatons of emissions could be avoided from dietary change alone. If avoided deforestation from land use change is included, an additional 39.3 gigatons of emissions could be avoided, making healthy, plant-rich diets one of the most impactful solutions at a total of 66 gigatons reduced.

 Despite the well-documented research of the benefits of a plant-rich diet, there has been little impact on global meat consumption. Global meat consumption in all categories has increased linearly since the 1960s and doesn’t appear to be slowing down.

Source: Our World in Data

A recent paper authored by Joseph Poore of Oxford University and published in Science indicates both alarming new research regarding food emissions and hopeful solutions. Poore’s findings indicate that animal products, particularly red meat, contribute substantially more to carbon impact than any plant based food. Average greenhouse gas emissions, or kilograms of CO2 equivalent, for 100g of protein from beef are 50 kgCO2eq. For peas, that number is 0.4 kg.

Source: SciencePoore offers a powerful solution: give more power to the consumer. Food consumption is a uniquely personal choice requiring individual change, making any restriction on consuming foods with a high carbon impact (namely, animal products) rather impossible. Poore, and I, contend that labeling a food’s carbon impact is a viable action that may yield substantial results. In practice, this would look like an added piece of information required on nutrition labels. Carbon impact, like calorie content, would be required. On unpackaged food, carbon would be labeled on grocery store tags. Enforcement of a policy such as this not only democratizes information regarding food impact, but also allows customers to make conscious choices about the foods he chooses to purchase.

The execution of a policy such as this must be nuanced, to be sure, and there are several questions that must be answered. Who will absorb the costs to obtain this information? Will all ground beef be labeled with the same carbon footprint, or will the label vary by supplier? How would we educate the public so that they understand the meaning of these new labels?


Providing more information to the consumer nearly always sounds like a good idea. But there are very real costs associated with a benefit such as this. Labeling all food products requires impact studies and manufacturing changes. Simply updating a food label costs businesses, on average, $6,000 per SKU, a significant cost for firms that produce hundreds of food items. We could imagine that labeling carbon may cost much more, as there are no current metrics to update—the information would have to be completely created. This information would be gleaned from impact studies, research that derives from tracing each ingredient to its origin and calculating its carbon impact in each setting, an activity that is sure to be much more costly than traditional nutrition labels, where information can be tested in a lab. Supply chains are rarely transparent or easy to track, and doing so will cost substantial amounts of money in compliance. There is also the matter of verification. Should companies be charged with labeling the carbon impact of each product, it would be easy, and almost predicted, that some of those numbers may be inaccurate and therefore, counterproductive. To execute this policy successfully there must be verification agencies in place—auditing for environmental impacts, not just financial ones.

To many companies, $6,000 or more per item is pocket change. For others, like emerging start-ups in the food industry, it’s the end of the company. For some farmers and suppliers of meat and produce, it’s unthinkable. For a policy such as this to be effective, all foods, not simply packaged foods, must be labeled. This puts extraordinary pressure on small players in the industry, many of which are those providing the healthiest, least polluting items. This dynamic indicates the need for government subsidies to assist financing large projects such as this.

Government subsidies may cause public outcry, particularly given the intense budget negotiations and lobbying power in Washington. In 2017, the United States government issued $16,185,786,300 dollars in farm subsidies, over $7 billion of which was allocated to commodities alone. If we were to allocate a fraction of these subsidies away from crops that we artificially overproduce, we could provide substantial funding for these impact studies that may assist in tangibly relieving the environmental impact of carbon in the food system.

As with all new ideas, these suggestions are bound to bring warranted debate and discussion, but the debates alone should not discourage us from enacting such policies. As with any action, there are trade-offs. An investment in labeling carbon is a plausible first step towards investing in a new version of the economic growth that considers environmental health in addition to financial.

Amazon and Delivery Services in America

For some reason, America’s current postal delivery system has never been updated; we’ve been operating on a centuries-old system. But as technology continues to improve, the demand for convenience has risen too. Magically finding your purchases on your doorstep within days of ordering is not special but now an expectation. People are pushing the boundaries of convenience— grocery deliveries and subscription box services are a testament of that.

The services that make this new preference for convenience possible are many times the postal delivery services. For many postal services such as USPS, package deliveries are quickly becoming a key part of their business, if not the focal point. Yet, surprisingly, the U.S. Postal Service lost almost $4 billion in 2018 even as package deliveries rose because it is not enough to offset the sharp decline in first-class letters caused by the internet and email. In addition to the decline in letters, the rising wages for workers and rising gas prices means higher overall transportation costs to produce delivery services. As the delivery service industry becomes pressed for profits (or rather any revenue), companies such as FedEx, USPS, and others rely heavily on packages to sustain their businesses and Amazon is a major customer. According to a Postal Service worker, around 75 percent to 80 percent of the daily packages they deliver have the blue tape with the scattered Amazon logo—most are Amazon packages.

In particular, the United States Postal Service is especially dependent on Amazon. It is an independent agency of the U.S. in which the federal government is responsible for to ensure insular areas also receive service; according to their website, they are the only delivery service that reaches every address in the nation which is over 155 million residences and businesses. However, they do not receive any federal tax dollars, so the partnership with Amazon is a logical choice. For Amazon, delivery is one of the most important pillars of their business considering that one of the main selling points of the yearly Amazon Prime membership is free two-day shipping. In a mutually beneficial contract, Amazon and USPS agreed on strict guidelines such as adding a delivery day on Sunday for only Amazon’s packages and ensuring the priority delivery—even if the workers may be overworked.

Amazon’s priority on shipping is reflected in their fiscal statements as well, but takes up a significant part of their expenses. In 2015, Amazon spent $11.5 billion on shipping, 46 percent of its total operating expenses that year. With the holiday season coming up, Amazon is reportedly hiring thousands of delivery drivers because they are expecting to send 8.5 million to 9 million packages per day during the peak parts of the holidays, according to the president of the delivery tracking and management technology company ShipMatrix, Satish Jindel. This means the tech-giant is looking to hire seasonal workers in addition to the services the existing American delivery companies such as the U.S. Post Office, FedEx, and other partners and is only one example of how they spend their money on shipping.


With such a budget, allocating a little under half of the operating budget on shipping, Amazon has been looking at alternative options for their shipping. Earlier this year in February, Amazon announced that they would begin testing a new method of delivery service to replace United Parcel Service and other services and is supposedly called Ship with Amazon or Shipping with Amazon. Amazon said in a statement, “We’re always innovating and experimenting on behalf of customers and the businesses that sell and grow on Amazon to create faster, lower-cost delivery choices.” Sooner or later, these preparations will shake the industry of parcel delivery.


References:


https://www.bloomberg.com/opinion/articles/2018-04-04/congress-not-amazon-messed-up-the-u-s-postal-service

http://about.usps.com/who/profile/

https://medium.com/s/powertrip/confessions-of-a-u-s-postal-worker-we-deliver-amazon-packages-until-we-drop-dead-a6e96f125126

https://www.bloomberg.com/opinion/articles/2018-02-09/amazon-s-delivery-dream-is-a-nightmare-for-fedex-and-ups

https://www.nytimes.com/reuters/2018/11/05/business/05reuters-amazon-com-delivery.html


Spotify Buys Back their Company

Just two days ago, one of the largest music streaming providers, Spotify, announced that it would buy back up to $1 billion dollars worth of stock. This technology company is most well known for their smooth streaming services and custom designed playlists, and new weekly tailored music picks for the user and with these features, Spotify has accumulated at total of 191 million active users per month. In addition to the users that listen for free (with advertisements), a total of 87 million users have a premium subscription. But even with active usership, Spotify was unsatisfied with the state of their company.


Image result for spotify

The buyback of Spotify’s own stock is essentially rooted in their internal belief that the company is valued higher than the current stock prices— the stock is undervalued in their eyes. To explain the logic behind the belief, it is important to examine that with the rise of competitors such as Amazon Prime streaming service and Apple Music, the competition in the music streaming sphere has intensified recently. In addition to this competition, Spotify as a company has been keeping up but sales have recently been declining. The revenue rose 31% but according to the third-quarter reports of 2018, the operating loss was at $6.8 million. When these figures balance out, this can understandably be seen as grounds for concern for the company, investors, and stakeholders.


Just six months ago in April, Spotify decided to go public and become a publicly traded company. Since their IPO or initial public offering, investors have only been skeptical about whether it is a good investment and the revenue was relatively modest. Since the IPO, the company lost nearly $10 billion in market value. In short, the business is struggling to grow with less shareholding power, and thus, executive power to make the risky business decisions needed to challenge the growth rate.


In buying back their stock, Spotify’s intends to invest in itself through allocating their capital—the total outstanding shares of the company shrink. Spotify is sending a clear economic message into this world: even if no one believes in us, we believe in ourselves. This repurchase program is projected to begin in the fourth quarter of this year and generally end by late April of 2021. This is a long time—in fact, this means Spotify will be actively buying back stock by the time I graduate college—but by the end of this period, Spotify is confident in their ability to grow as a company.

Joe Costigan, the director of equity research Bryn Mawr Trust explains, “corporations are confronted by this and there are two things that they know: If they buy assets outside of their industry, they’re probably not going to get the returns they need to justify their purchase. If they buy their own assets back via share repurchases, it’s more of a known quantity,”


Typically, buybacks of stock are often a response to the state of the market such as when the GDP is stalling and there is not enough spending on the government or consumer level. Yet in the case of Spotify, the low-growth situation leads decision makers to avoid creating additional capacity. 


In terms of the relevance of Spotify with the larger state of our economy, the buyback of shares sometimes occurs in a bull market. In the midst of ample competition, it is strategic to work towards improving a company and increasing value. A more streamlined decision making process leads to better allocation of Spotify’s capital, which theoretically should increase productivity levels and create the possibility of absolute advantage within the music streaming sphere.


Spotify plans to buy back up to $1 billion in stock

https://www.businesswire.com/news/home/20181105005454/en/Spotify-Announces-Stock-Repurchase-Program-1.0-Billion

https://www.ntu.org/foundation/detail/what-do-stock-buybacks-mean-for-the-economy

https://www.marketwatch.com/story/why-stock-buybacks-are-losing-their-fizz-2014-06-15


How hard will the iPhone fall?

By Roy Pankey


Eyes widen. Mouths drool. Kids ask for a raise in allowance. People wait in line for days. Sometimes fights break out over it. Everyone always wants it. It’s the latest, greatest iPhone. This thin, handheld device only makes a tiny splash if you drop it in a toilet (I would know!) but it has caused economic waves worldwide.

It’s hard to believe Apple unveiled its first iPhone a little more than a decade ago. They seem to have been around for much longer, as they’ve become almost an icon of American culture. Like all icons, though, the iPhone will eventually fade away and will be replaced by something else. And that day might not be so far away.

The iPhone has been the most profitable product by far for Apple, the company that makes the smartphone. Consumer spending on new iPhone models is so reliable that economists are now surprised if Apple’s stock price doesn’t go up. As of 2015, the iPhone was responsible for between 60 and 70 percent of Apple’s yearly profits. (The new models that year were the 6 and 6 Plus, costing a mere $750 by today’s standards.)

When looking at the iPhone’s impact on the country’s economy, Michael Feroli, an economist for JPMorgan Chase, told the New York Times a few years ago there was a definite correlation between releases of new iPhones and jumps in overall sales at electronics stores.

On a global level, smartphones are making their name known. The business accounted for almost six percent of Chinese exports. In terms of value added, iPhone exports in Ireland, where Apple has its European headquarters, have made up 25 percent of the country’s economic growth.


Apple’s Irish Headquarters (Source: Irish Times)


But all of this could mean serious trouble if the smartphone industry continues to shrink.

According to the April World Economic Outlook published by the International Monetary Fund (IMF) earlier this year, shipments of smartphones worldwide fell during 2017 for the first time ever.

“By decomposing the cycle from trend for Chinese exports of smartphones, regression results show that the trend is nonlinear and may have reached its peak in September 2015, suggesting that future global demand for smartphones may grow more slowly,” it wrote.


(Source: Business Insider)


The iPhone industry is closely connected to several others associated with the making of the phone, including parts providers, factories where those parts are assembled, distributors who deliver the new phones, and the retailers who sell them. And that’s just to get the iPhones in the hands of consumers. App developers also depend on the smartphones for their business.

Earlier this fall, Apple released not two but three new iPhones. Best guesses say upwards of 90 million units have been made so far. Apple is expected to produce the same number during the first half of 2019. But what happens to 90 million iPhones if no one wants to buy them.


Sources:

Apple Insider  –  https://appleinsider.com/articles/18/04/19/apples-iphone-now-key-to-global-economy-growth-claims-imf

BGR  –  https://bgr.com/2018/07/10/iphone-9-iphone-11-vs-iphone-x-apple-discontinue-2017-model/