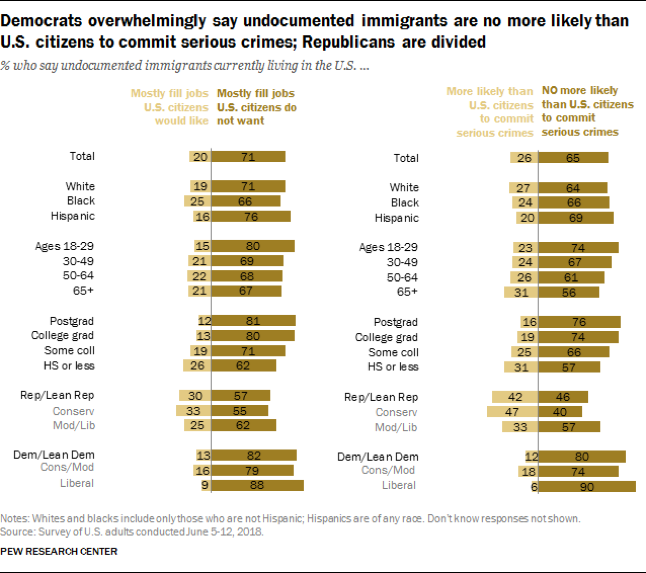
The world emitted 32.5 gigatons, or 32.5 billion metric tons, in 2017. Globally, agriculture accounts for 24% of these greenhouse gas emissions, with livestock accounting for about 14.5% to 18%. This makes animal production alone more polluting than the entire global transportation industry. And though agriculture isn’t always the most popular topic when it comes to policy conversations around climate change, the data make a compelling argument to change the way we consume livestock.

Source: EPA
According to Drawdown, the self-proclaimed “most comprehensive plan […] to reverse global warming,” a shift to plant-rich diets is the fourth most impactful solution (out of 80) to achieve this goal, with the potential to reduce atmospheric CO2 by 66.11 gigatons.
If 50 percent of the world’s population restricts their diet to a healthy 2,500 calories per day and reduces meat consumption overall, we estimate at least 26.7 gigatons of emissions could be avoided from dietary change alone. If avoided deforestation from land use change is included, an additional 39.3 gigatons of emissions could be avoided, making healthy, plant-rich diets one of the most impactful solutions at a total of 66 gigatons reduced.
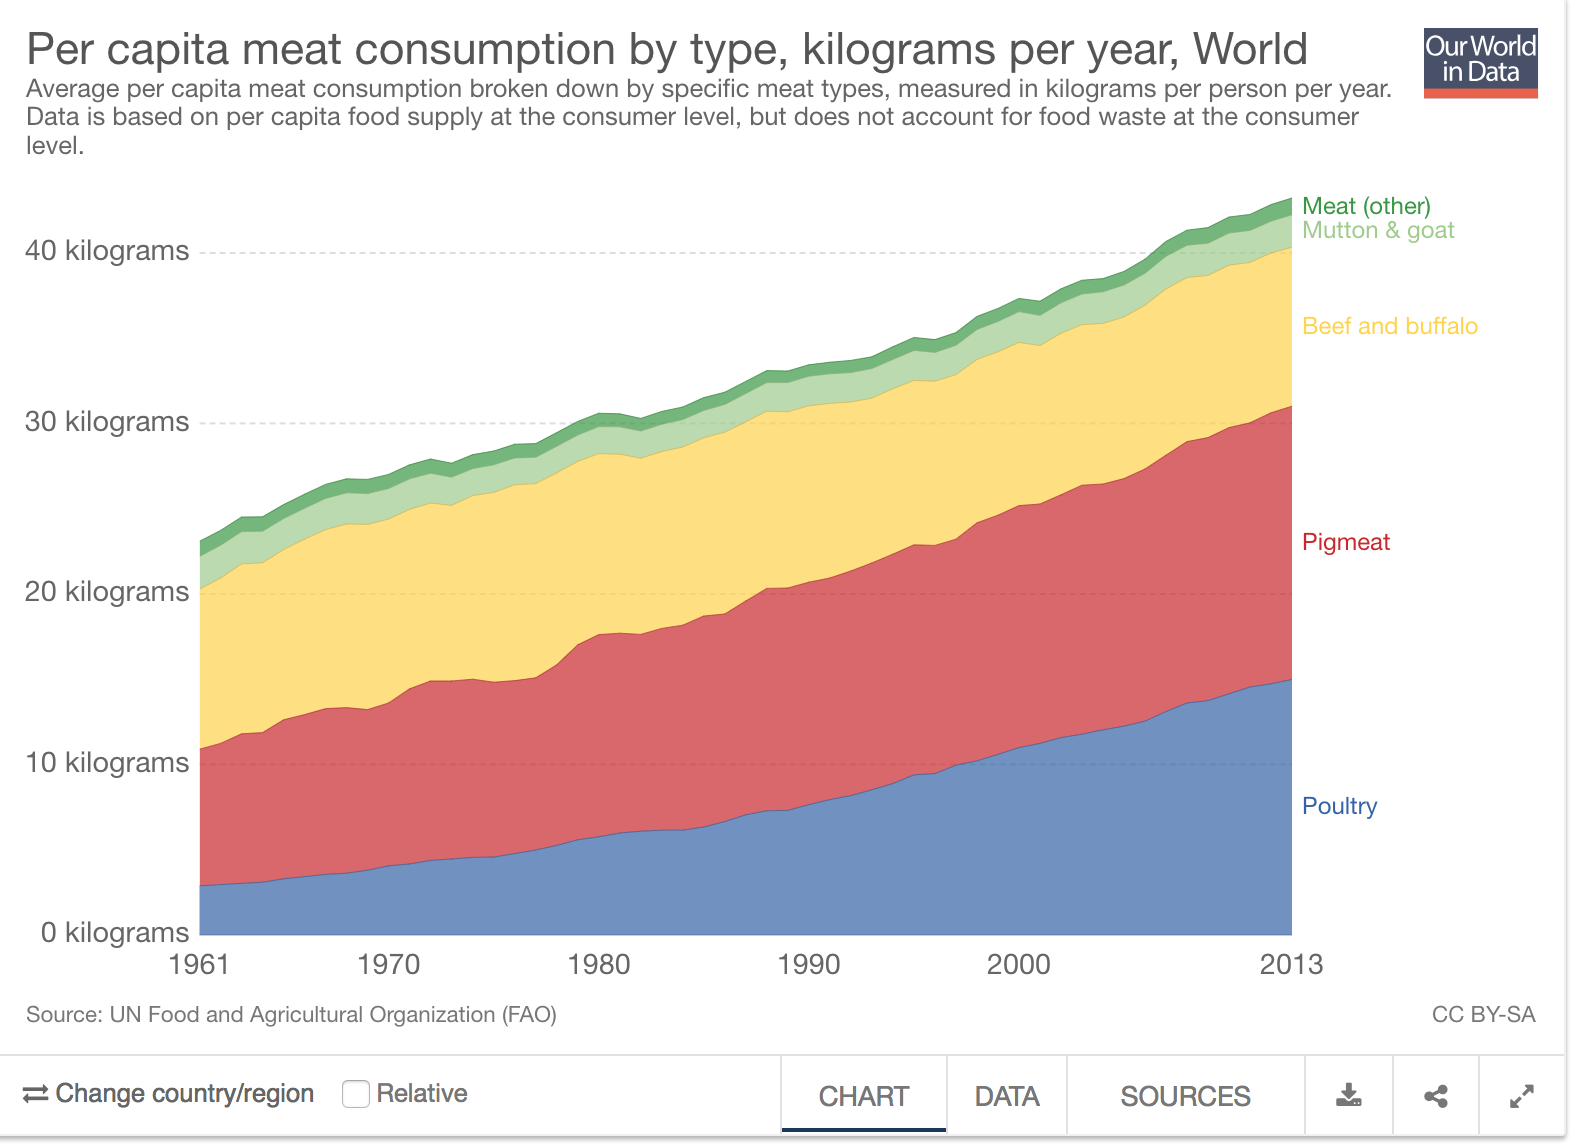
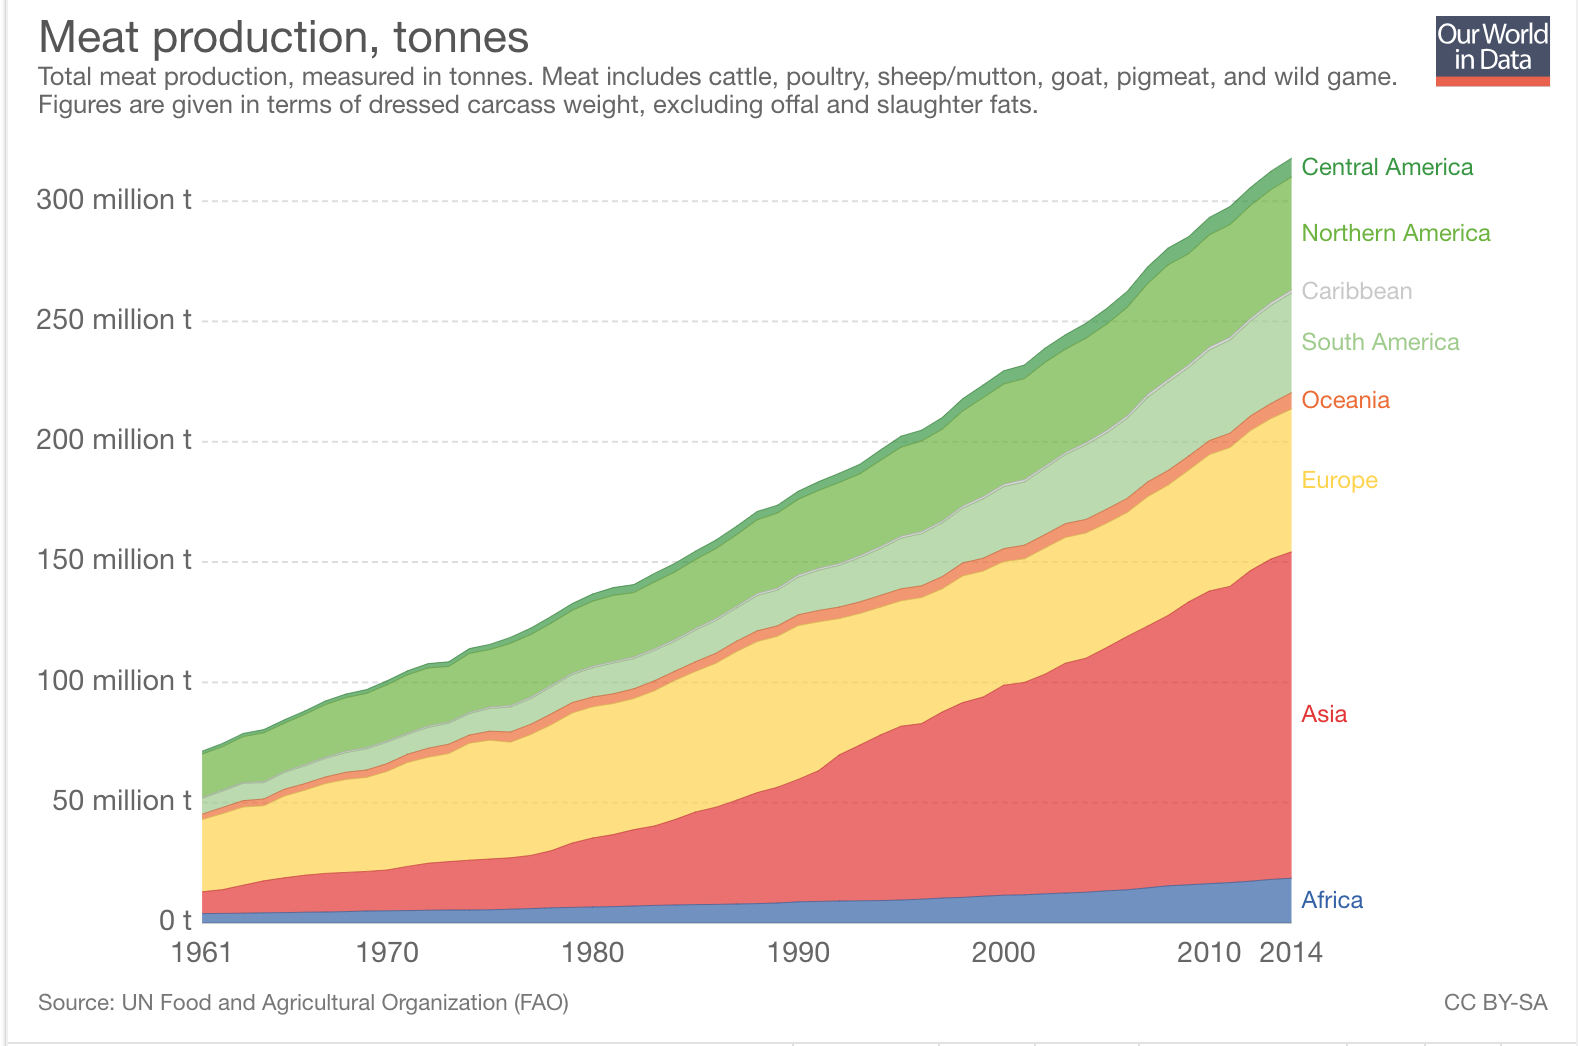
Despite the well-documented research on the benefits of a plant-rich diet, global meat demand has remained untouched, and consumption in all animal categories has increased linearly since the 1960s. It doesn’t appear to be slowing down.
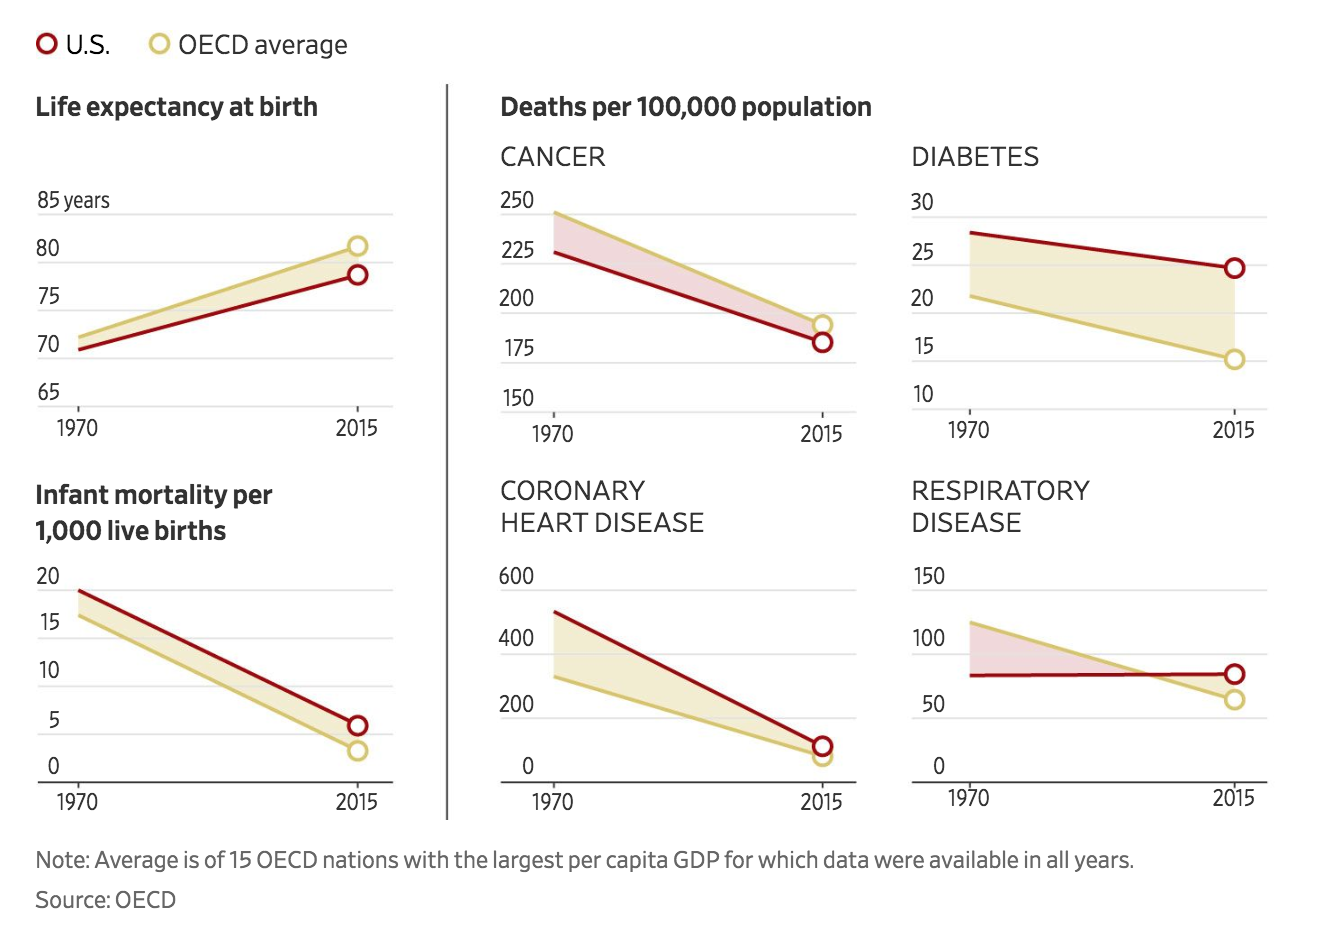
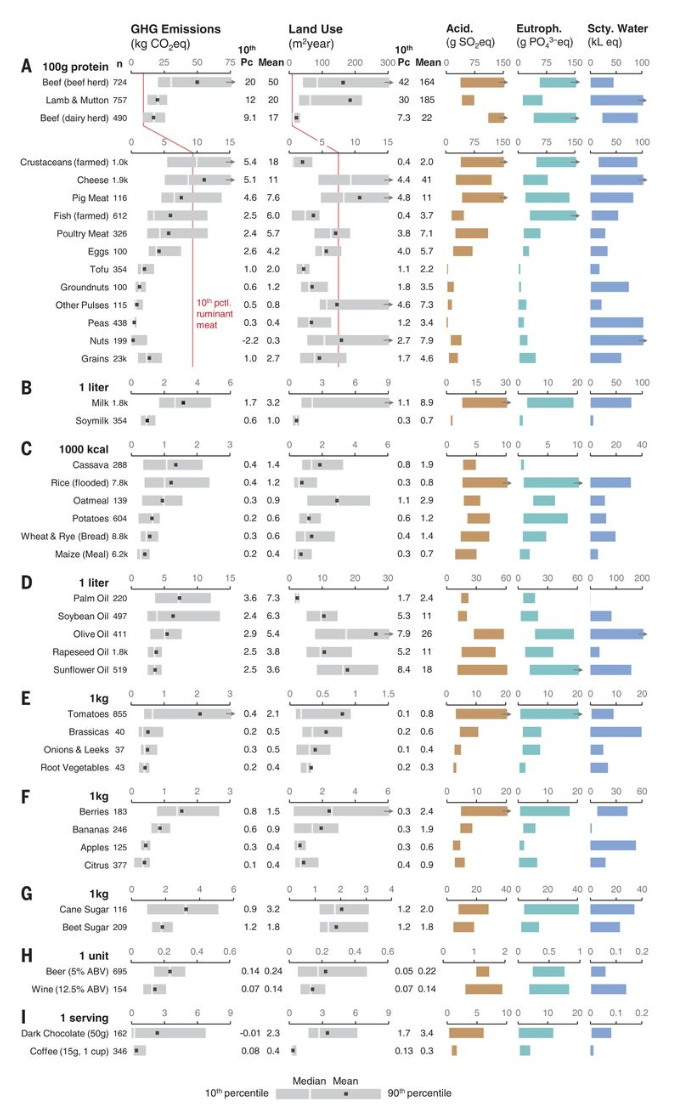
A recent paper authored by Joseph Poore of Oxford University and published in Science indicates both alarming new research regarding food emissions and revisits pragmatic solutions. Poore’s findings corroborate existing research that animal products, particularly red meat, contribute substantially more to greenhouse gas emissions than any plant based food. Average emissions, or kilograms of CO2 equivalent, for 100g of protein in beef are 50 kgCO2eq. For peas, that number is 0.4 kg, or 0.8%. Beef emissions are unequivocally higher, even when factoring in high quantities of “food miles” that many plants bear. Food miles indicate the distance, say, an avocado from Mexico has to travel to the café in Notting Hill where you enjoy your avocado toast on a Sunday morning.
Poore revisits a powerful solution: give more power to the consumer. Food consumption is a uniquely personal choice involving individual preferences and dietary requirements, making any restriction on high carbon food consumption undesirable. Poore advocates for labeling a food’s carbon impact, a measure that would aim to reduce the overall demand for animal products. Reducing demand would theoretically reduce production, as is necessary in the free market, profit-maximizing model. In practice, carbon labeling would look like an additional piece of information required on nutrition labels. Carbon impact, like calorie content, would be required.
On unpackaged food, carbon may be labeled on the grocery store tags or on the glass panes that shelter the meat counter. Enforcement of a policy such as this not only democratizes information regarding food impact, but also allows customers to make conscious choices about the foods he chooses to purchase.
Providing more information to the consumer nearly always sounds like a good idea. But there are very real costs associated with a benefit such as this. Labeling all food products requires impact studies and manufacturing changes. Simply updating a food label costs businesses, on average, $6,000 per SKU, a significant cost for firms that produce hundreds of food items. We could imagine that labeling carbon may cost much more, as there are no current metrics to update—the data would have to be created for the first time. This information would be gleaned from impact studies, research that derives from tracing each ingredient to its origin and calculating its carbon impact throughout the supply chain, an activity that is sure to be much more costly than traditional nutrition labels, where information can be tested and obtained in a lab. Supply chains are rarely transparent or easy to track, and doing so will cost substantial amounts of money for companies to comply. There is also the matter of verification. Should companies be charged with labeling the carbon impact of each product, it would be easy, and almost predicted, that some of those numbers may be inaccurate and, therefore, counterproductive. To execute this successfully there must be verification agencies in place—auditing for environmental impacts, not just financial ones.
To many companies, $6,000 or more per item is pocket change. For others, like emerging start-ups in the food industry or small family farms, it’s the end of a company. That said, food giants are constantly updating their labels to market their product’s “new look, same great taste!” Carbon labels gives companies a new excuse to rebrand! This does, however, puts extraordinary pressure on small players in the industry like family grocers, many of whom are providing the healthiest, least polluting items. This dynamic indicates the need for government subsidies to assist financing large projects such as this.
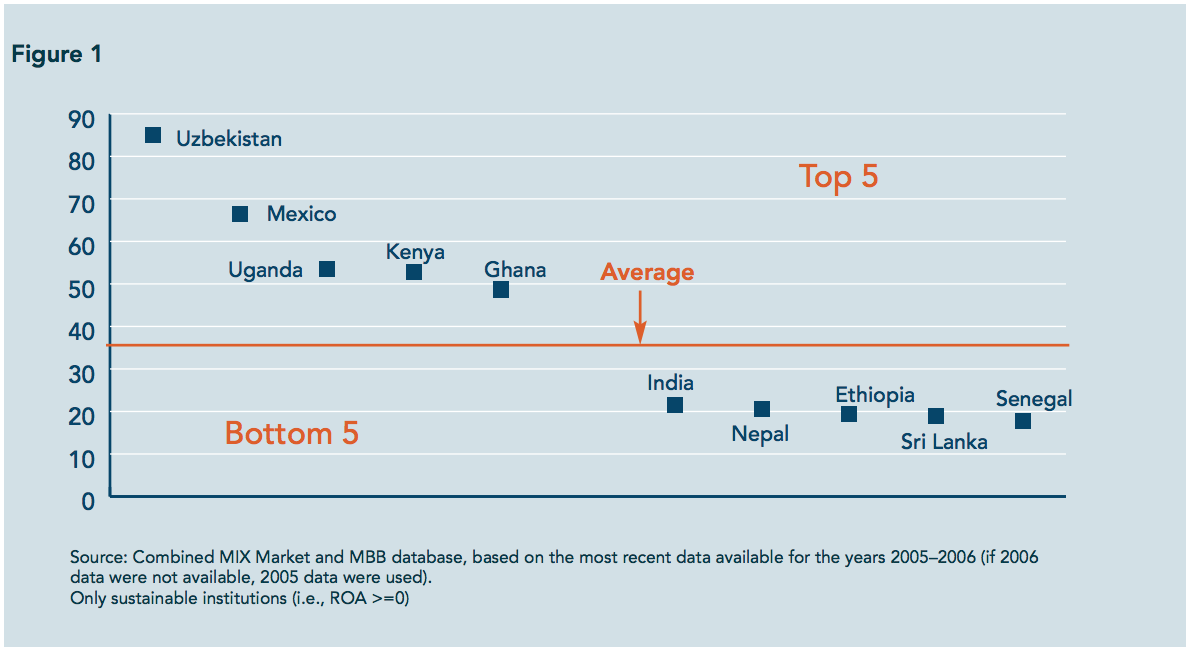
Government subsidies may cause public outcry, particularly given the intense budget negotiations and lobbying power in Washington. In 2017, the United States government issued $16,185,786,300 dollars in farm subsidies, over $7 billion of which was allocated to commodities. Over $5 billion dollars was allocated to corn subsidies alone in 2017, a crop that’s primary use is—yes—to feed livestock.
 Source: World of Corn
If we were to allocate a fraction of these subsidies away from crops that we artificially overproduce, we could provide substantial funding for these impact studies that may assist in tangibly relieving the environmental impact of carbon in the food system. This money would not be difficult to find—the low-hanging inefficiency fruit in the budget office is bountiful and ripe. The Economist reports that “between 2007 and 2011 Uncle Sam paid some $3m in subsidies to 2,300 farms where no crop of any sort was grown. Between 2008 and 2012, $10.6m was paid to farmers who had been dead for over a year.”
By offering initial subsidies to domestic companies, we could numb the pain of a potentially jarring regulation to offset the initial start-up costs associated with new research and a new labels. After this research and methodology improves and becomes standardized, government subsidies could eventually be eliminated, and costs to individual companies would be normalized.
Do we really need to put a carbon label on kale, though? Can’t we trust the common consumer be educated enough to distinguish between environmentally impactful foods and benign ones? Not really, and it’s not because consumers are inept. Adrian Williams, an agricultural researcher commissioned by the British government to study the carbon imprint of different foods, addressed this succinctly in a 2008 New Yorker essay.
“Everyone always wants to make ethical choices about the food they eat and the things they buy… And they should. It’s just that what seems obvious often is not. And we need to make sure people understand that before they make decisions on how they ought to live.”
Perhaps the most glaring hurdle to implementing these labels is educating consumers enough that they understand them. In 2007, Tesco, the largest supermarket chain in Britain, pledged to put carbon labels on all 70,000 of their products. Four years into the project, the grocer abandoned the initiative “because the message [was] too complicated” after labeling only 500 products. Though the move to change business strategy was multi-faceted, Tesco’s decision ultimately came down to two elements: no one else followed suit, and consumers didn’t know how to read them.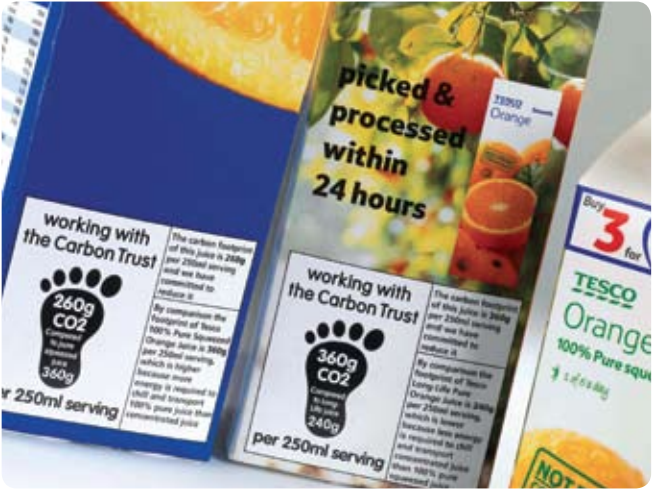
Developed with the Carbon Trust, most of these labels appeared like black and white footprints with the correlated grams of CO2 emitted printed in the middle. And while these labels offer a point of comparison in the lower corner, most consumers simply look over this fact. When I myself was living in London for a few months, I saw these labels frequently and had no idea what they were, and I didn’t bother to find out, either.
These labels must not only be designed better, but we must also educate the public about what they mean. This means more media coverage, more government campaigns, and more exposure to the labels at a young age. Demand and, therefore, the carbon impact of the food system, will not change if consumers don’t know what’s going on.
As with all new ideas, these suggestions are bound to bring warranted debate and discussion, but the debates alone should not discourage us from enacting such policies. As with any action, there are trade-offs. An investment in labeling carbon is a plausible first step towards investing in a new version of economic growth that considers environmental health in addition to financial.
A common argument against carbon labeling is the question of where in the supply chain tracking begins. And doesn’t it all get too complicated? We can get wrapped up in the idea of where the carbon tracking starts and if the gasoline the farmer used to buy the seed that planted the corn should be accounted for in that model. But those nuances, while crucial in the execution, miss the point. Carbon labeling gives us the benefit of comparison between products. It doesn’t matter where in the supply chain it starts, as long as its standardized and a true reflection of reality. The most crucial element of this all is that the average man going grocery shopping on his way home from work can easily see that a pound of ground beef produces a lot more carbon than a pound of turkey. It’s then up to the consumer how far he wants to exercise his carbon freedoms. Maybe he’ll become a vegetarian, but maybe he’ll just choose to eat turkey tonight. That may be where we are as a society right now. And that’s okay.
Because there will not be a strong economic advantage to choose a food item lower on the carbon impact scale, it’s necessary to note that this measure alone will not sufficiently change market conditions to reduce emissions. It is, however, a powerful way for early adopters to advocate through purchases, and an effective way to spread information about the impacts of individual choices on the environment.
On a practical level, this is a policy for consumer education. On a philosophical level, this is a policy to get people closer to the goods they consume, exposing, label by label, what’s really going on in the supply chain.
To be clear, labeling carbon will not curb emissions enough to actually meet the IPCC’s goal of 1.5 degrees C of warming. True and meaningful action requires putting a real price on carbon reflective of its value and integrating the environment into our economic fabric. This policy must be part of an ecosystem of changing action, thought, and discussion. This policy is forcing consumers to literally look at their choices in black and white and show them the environmental costs of a lifestyle. Carbon labeling is not going to save the icecaps, but it may be our best chance at bringing consumers closer to the goods we consume.