If you’re reading this, you’re most likely in college or at least very familiar with higher education. If so, you may be aware of the yearly increase colleges make to their final Cost of Attendance (COA). Yes, part of that may be because of the increased expenses and simply an administrative decision, but there is another underlying reason the cost goes up in small (though sometimes not-so-small) increments. Take the tuition of University of Southern California, for example.

The Widney House, then known as Hodge Hall at the University of Southern California circa 1880.
The original cost of tuition when USC was first founded in 1880 was a whopping $15.00 per term. Today, that is about the cost of a single dining hall meal at USC (if not cheaper). But if we examine even the past few years, the tuition at the University of Southern California has increased 3.5% or more every year. The economy experiences inflation and the American dollar’s value starts to depreciate. In other words, you have to start paying more money for the same products, like your panini sandwiches.
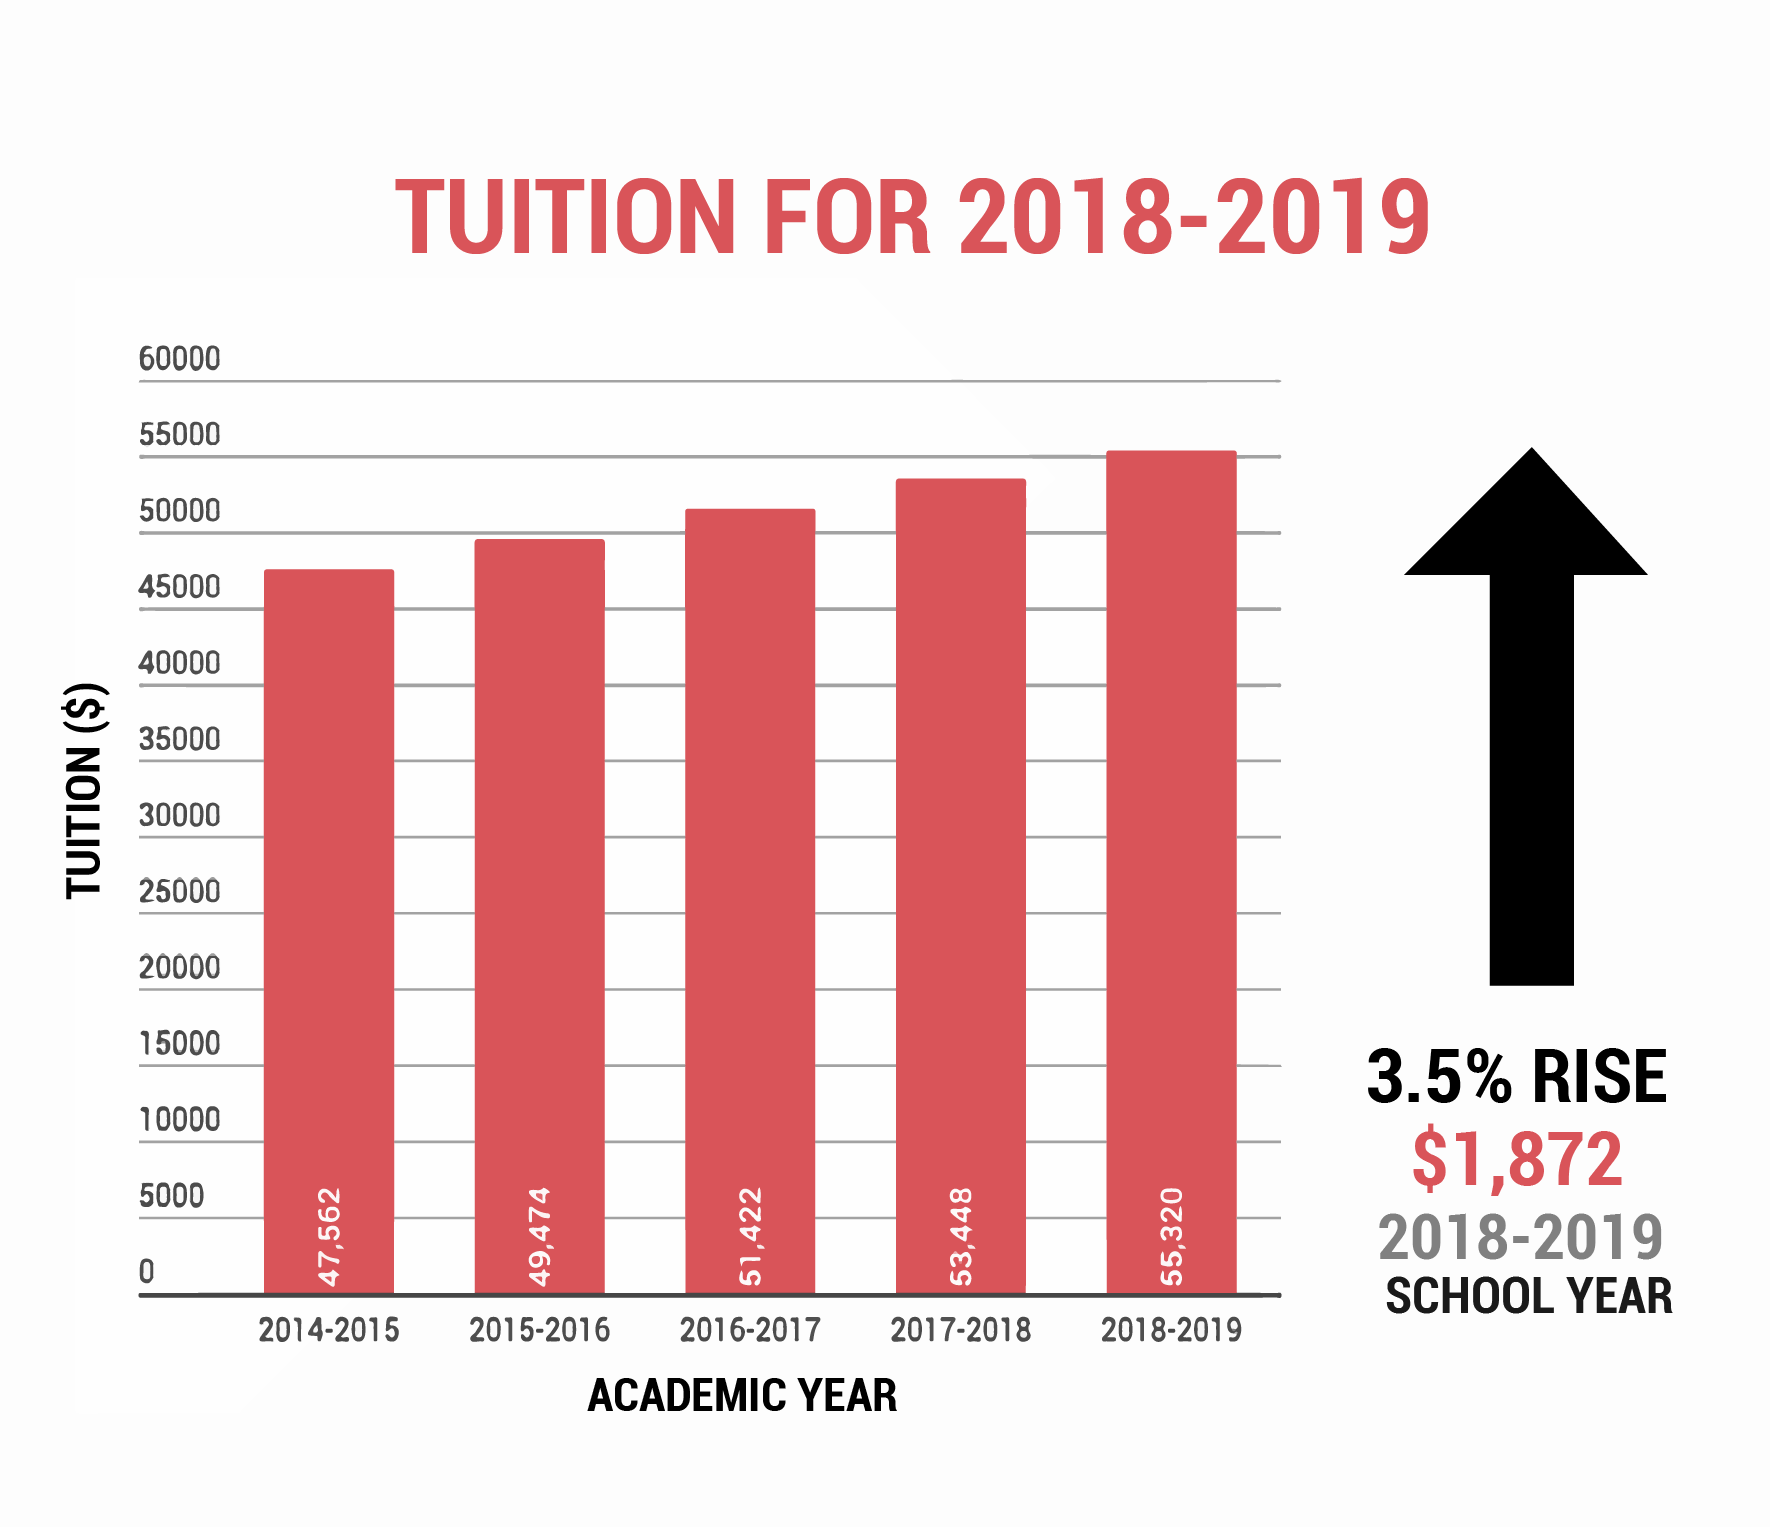
Graphic made by Baylee Nagda from the Daily Trojan Newspaper
The inflation, or the “weaker dollar,” versus deflation, or the “stronger dollar” refers to how much value the same dollar bill holds. Though it is important to note that this is not true in every case—sometimes, the rising prices may simply signal a bustling economy and the dollar will increase along with the stimulated economy.
But why is this important? The strength of the dollar in any nation’s economy can be a strong economic indicator. One way of measuring inflation is through the Consumer Price Index, or CPI for short. It takes a general list of essential things most Americans or the citizens of a certain nation buys and tracks its cost. Seeing where the trend lies in the Consumer Price Index can let us know as Americans, consumers, investors, and global citizens how the foreseeable economic future will be shaped to some degree. This knowledge can influence what we choose to do or not do with our money, influencing decisions.
In more specific breakdowns, these statistics are differentiated by Urban consumers and non-Urban consumers. The Bureau of Labor Statistics from the US Department of Labor reveals a monthly Consumer Price Index summary— this past month in July of 2018, the Bureau reported that the CPI has increased 0.2 percent.
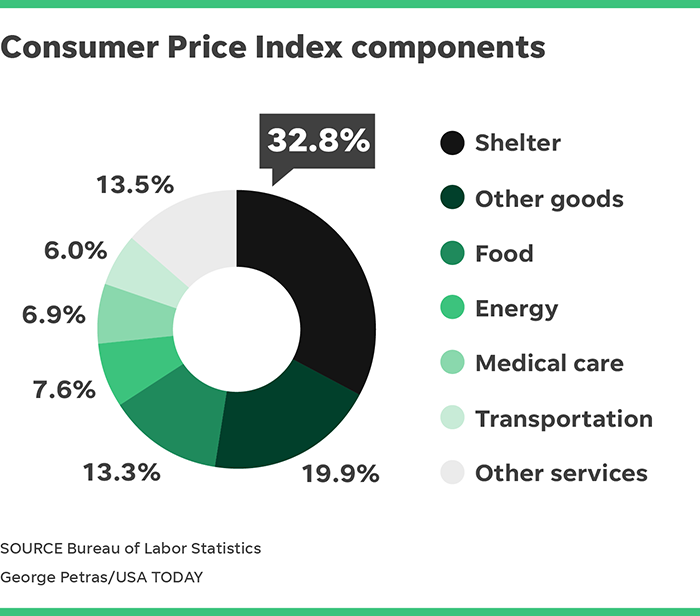
Graphic by George Petras from USA Today.
However, Dan Caplinger of the USA Today speculates that the inflation rate isn’t always accurately reflected in our everyday lives. He explains that the statistics for the Consumer Price Index that is taken are averages of the general population. This includes different categories of the workforce such as employed, unemployed and the growing group of the baby boomer generation that is starting to retire. Thus, different age brackets and income brackets. Age inevitably has a stronghold of influence on our personal spending, but also the allocation of money even within our “necessities.” An example would be that health care is most likely to cost more the older you get. Yet, some may argue that in the bigger picture of economic activity, a specific demographic will only change consumer behavior so much. Ultimately, consumers will spend when the economy is favorable and spending becomes attractive.
Understanding that the primary goal of CPI statistics are for tracking the economy rather than personal accuracy is important to note. This means that the CPI statistics are not going to be accurate in every neighborhood of the United States, but are referenced as the average cost of an item during a certain time period. Considering all of these factors, we can extrapolate from this data to give us guiding clues about how the economy is going to behave.
Leave a Reply
You must be logged in to post a comment.