How Babies Affect the Economy

This year, the United States’ fertility rate hit 59 births per 1,000 women, the lowest number it has been in 32 years, according to the Bureau of Labor Statistics. 

Since the Great Recession, the number of births has decreased due to the financial investment of having a child and how the recession took away resources that were necessary to support families. However, although the economy has since recovered, the fertility rate has not increased dramatically since. Many Americans cite the financial cost of raising a child as their primary reason for delaying child births. 

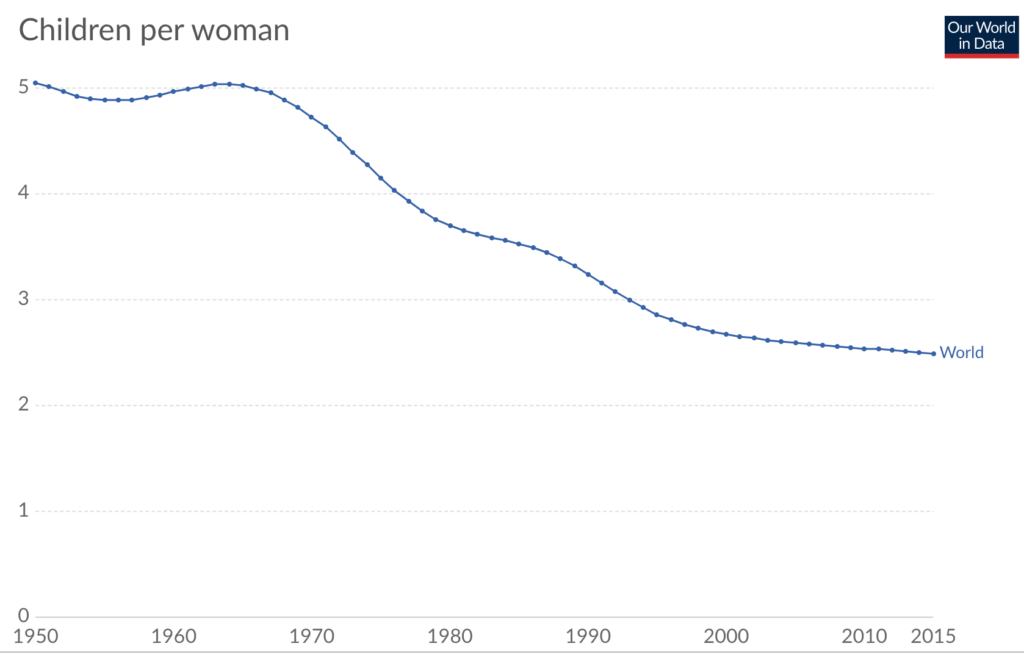
Several factors have contributed to the decline in childbearing. The overall decrease in teenage pregnancies, the availability of birth control, a shift in delaying marriage in favor of furthering personal careers and the higher cost of childcare and education have played roles in this decline. Women also cite that having better access to child care and stronger parental leave policies could spur more childbirths over the next years. 

Seventy percent of women in the U.S. today work outside the home, according to an article by Vox. On the one hand, more women in the workforce means more income tax being spent and the enjoyment of more disposable income. As we studied, consumer spending plays a large factor in GDP. In addition, with the need for specialized labor, a more educated workforce can create more opportunities for higher, advancing sectors that can stimulate the economy. Some also cite that lower fertility rates can be beneficial to ration our limited resources. 

On the other hand, declining birth rates can also have long-term effects. For one, the elderly population will increase creating an eventually-declining labor force and not enough people to work (much like in Japan).

The United Nations predicts that by the year 2100, 30 percent of the population will be made up of people ages 60 and above. With longer life expectancies, this can create an age imbalance that leaves a limited number of able-bodied people to work. Economists have predicted that this will create a rising need for increased healthcare, thereby also increasing its costs. With a smaller workforce, those who pay income taxes to fund these medical programs will also shrink as well. 

To increase the amount of people in the workforce, lawmakers have proposed keeping older people working longer, a solution that may not be feasible or welcomed. Another solution is relying on automation, artificial intelligence and robots to boost production and replace workers but this also has its limits. The last solution is to boost immigration to bring in more people who desire to work and fill jobs. If the U.S. is heading towards a recession by next year, there will be a chance that fertility rates will start to decline as people prepare for an economic slowdown, which can have overall negative effects on our economy.

Sources:

https://www.marketplace.org/2019/01/22/americans-are-having-fewer-babies-and-it-might-have-do-economy/

https://www.vox.com/science-and-health/2018/5/22/17376536/fertility-rate-united-states-births-women

https://www.businessinsider.com/dropping-fertility-rates-will-affect-the-economy-2016-11

https://money.cnn.com/2018/06/27/news/economy/arizona-birth-rates-economy/index.html

And the Wall came tumbling down…

West German citizens gather at a newly created opening in the Berlin Wall at Potsdamer Platz in November 1989. DoD photo.  

November 2019 marks the 30th anniversary of the fall of the Berlin Wall. From 1961 to 1989, the Berlin Wall separated West Berlin from East Berlin. Standing approximately 12 feet high and 27 miles long, one of the reasons the Wall was created was to keep East Germans from fleeing to the west.

The fall of the Berlin Wall on Nov. 9, 1989 meant that East Germans were free to travel and to work outside of their country for the first time in decades. A New York Times article written three days before the Wall fell about the economic impact the fall could have on Europe mentions that “since East Germans can automatically obtain citizenship in West Germany, they also become citizens of the European Community, free to travel and seek jobs, housing, and eventually welfare benefits in any of the other 11 member countries.” 

Within a year of the fall of the wall, East Germany and West Germany reunited into one whole Germany. That new Germany was generally economically stable with a stable currency. The European Community morphed into the European Union, which Germany is heavily associated with. The country’s general economic strength typically means that the European Central Bank’s “one size fits all” interest rates only fit Germany.

A Pew Research Center study found that while Germany is generally viewed positively in Europe, views of Germany are tied to the EU as a whole. Essentially, if you like the EU, you generally like Germany. Since the global financial crisis, that’s less likely to be the case. In Italy, unfavorable views of Germany increased by 27 percentage points between 2007 and 2017. 

But Greece is where the real hate is at, with a little over three-quarters of Greeks having an unfavorable view of their fellow EU member. “The country is several years into an austerity program imposed by the EU and backed by Merkel’s government,” the study reminds. 

There’s another group of people that aren’t too fond of Germany right now: the Germans. More specifically, people from the eastern German states. It’s been 30 years since the Berlin Wall and 29 years since the German Reunification, and they are still living with the consequences. According to Marketplace, many state-owned companies were sold off to the private sector post-unification and many others collapsed because they could not compete in a market economy. 

When the Berlin Wall fell, many things changed for the better – residents of East Germany could see loved ones on the other side of the border again, could participate in democratic elections, and could travel freely. The economics of the matter is different. It has fostered a feeling of discontent amongst the former East Germans, who say they feel like they have been treated like second class citizens.

According to a recent opinion poll, only 38 percent of Easterners regard the unification as a success – perhaps due to the feeling that it was not a reunification of two Germany’s but the absorption of the East into the West. Jörg Roesler, an economist, said that although western taxpayers spent $2 trillion to improve infrastructure and a social safety net in the former East Germany, it was wasted. Roesler believes what Eastern companies needed was protection. He told Marketplace that if they had been protected for up to five years, a generation would not have been unemployed and “made to feel worthless.”

The dissatisfaction of the former East Germans isn’t just resentment over something that happened 30 years ago. Eastern Germans are still being effected. A Pew Research Center study on how the economic conditions of East and West Germany changed over time found that unemployment in the former East Germany is higher than in the former West Germany by around 2 percent. Although the economic gap between the two regions has become narrower recently, former East Germans make less money than former West Germans. 

“People in the former East Germany earned 86% the after-tax income of their West German counterparts in 2017,” said the study. “That percentage has changed little in recent years, but is far higher than in 1991, when per-capita disposable income in the former East was only 61% of that in the former West.”

The physical Berlin Wall may have fallen 30 years ago, but its economic and psychological shadows live on.

SOURCES

PSL: The Fall Staple

The Pumpkin Spice Latte, Starbucks’ most profitable seasonal drink, returns every year pre-Labor Day and is a staple to many peoples’ daily routines until the end of January. The iconic pumpkin spice flavor is sold in supermarkets everywhere, whether in ice cream, cereal, or even dog food but Starbucks has popularized the trend through a simple latte drink. The autumnal flavor has been a Starbucks go-to since 2003. Although considered a fall-flavored drink, Starbucks has begun to release the flavor during the warm summer months. It was predicted that customers would not order the drink in a humid summer but Starbucks was confident in the risk of making it available during more months of the year. Starbucks hoped for three outcomes:

  1. Customers pay one more visit to its retail shops.
  2. Customers spend more by buying a baked good or sandwich with the latte.
  3. The early release will garner so much media attention that it will gain massive amounts of free publicity.

Starbucks achieved what they had hoped and the PSL has now become the flavor of Fall as many products attempt an imitation of the customer-loved flavor.

With many products and brands that implement the pumpkin spice flavor into their products, customers can choose from a massive variety of food and drink options. Despite having an almost ridiculous amount of pumpkin spice flavored products, customers still choose the Starbucks latte over almost everything else. The dollar sales of pumpkin-related flavors is trumped by three main categories: in first place, with $130.6 million in sales, is pie filling, in second place is the PSL with $110 million in sales, and finally, in third place and probably the strangest way to choose this flavor is dog food with $109 million in sales.

The pumpkin spice latte seems to be one of the large contributors to Starbucks’ success, but in reality, PSL sales are barely 1% of annual revenue for the coffee giant. Starbucks has sold more than 350 million pumpkin spice lattes since its inception in 2003, but the success of the flavor is just a small, debatably tiny, contribution to the overall prosperity of the coffee chain. The latte alone may not contribute as monumentally as believed, but the flavor clearly brings customers into stores during the PSL season. Customers who purchase the latte spend an average of $1.14 more per purchase than the non-PSL buyer. A little over $1 per customer may not seem huge, but considering the 350 million pumpkin spice lattes sold over the past 14 years, it is safe to assume the $1 per customer adds up enough to keep the flavor in stores. The PSL is one of those must-try flavors because of its widespread popularity, and I have yet to get my hands on one.

https://www.delish.com/food-news/a22862289/how-much-money-does-starbucks-make-on-psl/

https://www.forbes.com/sites/maggiemcgrath/2018/10/31/inside-the-600-million-pumpkin-spice-industrial-complex/#1535b3ef1b95

https://www.forbes.com/sites/garystern/2018/09/21/starbucks-pumpkin-spice-latte-exceeds-expectations-but-will-it-turn-the-tide-for-sluggish-stock/#6e25ec3b20cb

737 Max economics

Grounded 737 Max jets

            After two fatal crashes in 2018 and 2019, the Boeing 737 Max has been grounded since March 10, 2019. Airline companies purchased this aircraft not knowing it was inherently flawed; so, now, they are stuck with planes that they cannot use. This is costing them in more than one way.

The airline industry relies on land, hangars and gates rented from airports. Every airline company rents a certain number of gates that they use for passengers, a certain amount of land they use to park planes and a certain number of hangars to maintain those planes. The nature of this business is that the planes circulate between the gates (flight), parking lots and hangars so that all of the planes are used to maximize profit. When the 737 Max was grounded in March 2019, this forced airline companies to reschedule flights, issue refunds and allocate other planes accordingly. The 737 Max planes are now parked on land for which the companies are paying. In essence, the companies have useless aircraft that costs them money – dead-weight.

As of October 24, 2019, American Airlines (owns 24 737 Max planes) paid $540 million, and Southwest (owns 21 737 Max planes) paid $435 million – $1 billion in total.[1] American Airlines cancelled 9,500 flights just in the third quarter of 2019 as a result.[2]

This is where Boeing comes into the picture. Because the grounding had such a large impact on the top-line and bottom-line for airliners, airline companies started negotiations with the manufacturer, Boeing, to compensate them. Boeing set aside $5 billion for this reason.[3]

Boeing CEO, Dennis Muilenburg, at a Senate hearing October 29, 2019. Pictures of the crashes victims surround him.

The 737 Max planes that have been delivered so far amount to 387 globally and pending orders for 400 more have been cancelled.[4] The 737 Max costs between $99.7 million to $134.9 million depending on the model.[5] Boeing has suffered a minimum of $39.88 billion and a maximum of $53.96 billion in unrealized revenues on the pending orders.

Boeing is the largest exporter and one of the largest employers in the US.[6] On top of a heavy trade imbalance due to the US-China trade war, Boeing’s cessation of producing 737 Max jets has further hindered GDP and manufacturing exports. This resulted in a drop of 1.3 percent of durable-goods orders in the second quarter and $2 billion loss in aircraft and parts sales. Bloomberg reports that 737 Max order book was worth $600 billion.[7] Bloomberg claims that the impact of the 737 Max crisis affected .2 percent of the second quarter’s GDP. Also, Investopedia reports that the impact would be greater than that of the 2019 government shutdown, which was $4 billion.[8] [9]


[1] https://www.cnn.com/2019/10/24/business/american-airlines-southwest-boeing-737-max-costs/index.html

[2] https://www.cnn.com/2019/10/24/business/american-airlines-southwest-boeing-737-max-costs/index.html

[3] https://www.cnn.com/2019/10/24/business/american-airlines-southwest-boeing-737-max-costs/index.html

[4] https://www.cnn.com/2019/10/24/business/american-airlines-southwest-boeing-737-max-costs/index.html

[5] http://www.boeing.com/company/about-bca/#/prices

[6] https://www.investopedia.com/how-boeing-s-737-max-crisis-is-hurting-u-s-gdp-growth-4694349

[7] https://www.investopedia.com/how-boeing-s-737-max-crisis-is-hurting-u-s-gdp-growth-4694349

[8] https://www.cnn.com/2019/09/17/politics/government-shutdown-cost-study/index.html

[9] https://www.investopedia.com/how-boeing-s-737-max-crisis-is-hurting-u-s-gdp-growth-4694349

Forever 21 and the retail apocalypse’s effects on the economy

Known for its glaringly yellow shopping bags, paper-thin shirts and stores blasting bubblegum pop ballads, Forever 21 has marketed itself as a teenybopper retailer set on the rapid comings-and-goings of the fashion industry. At its peak only three years ago, the privately-owned, American fast-fashion company grossed $4.4 billion in annual sales, opened 800 stores globally and employed up to 43,000 people reported the New York Times.

Just last month, however, the retail giant announced it would be filing for Chapter 11 bankruptcy protection meaning the business will still operate but will restructure its debt repayments to investors. The founders said they’d be stopping production with 40 companies, shuttering 178 stores within the United States and closing up to 350 total brick-and-mortar locations worldwide. 

What became of the retailer which seemed to dominate every other mall and bring in hordes of teenagers and moms who wanted to preserve their inner 21-year-old? 

Two words: retail apocalypse. The term refers to the advent of online shopping and shifting consumer habits that has caused many retail stores to close, forcing many companies to declare bankruptcy.

Starting in 2017, malls through the United States saw closures of prominent stores. Major stores such as Payless ShoeSource, Abercrombie & Fitch, American Apparel, Gap Inc., Charlotte Russe, J.C. Penney, Michael Kors, Bed Bath and Beyond, and Toys ‘R Us have been affected by the retail apocalypse. Alarmingly, this was during a time when the economy was strong and unemployment was low.

Both department stores and middle-tier mall chains either went out of business completely or shifted their focus to online distribution. The average household spent $5,200 online in 2018, a figure that rose almost 50 percent from 2013, as reported by the Washington Post.

Of U.S. retail stores, 75,000 out of approximately 1 million will close by 2026, according to the Washington Post, with online shopping making up nearly a quarter of sales. However, this figure isn’t as high as years prior. During the 2001 recession, 151,000 stores closed and again during the 2008 recession, another 148,000 stores closed.

For Forever 21, the combination of the retail apocalypse plus the owners’ reluctance to allow the privately-held business to be managed by others led to its eventual downfall.

In 2017, the Atlantic published an article describing three of the major contributors to the retail apocalypse: the rise of e-commerce, the number of malls in existence and the shift in consumer spending from retail to restaurant consumption.

Currently, there are about 1,100 shopping malls nationwide. During the late 1950s, many malls in America were built on the idea of a communal ground for middle-class, suburban America. As much as it was a workplace for minimum wage jobs, it was also a meeting ground for anyone and everyone to socialize. At one point, mall developers had dreams of a futuristic destination spot that housed apartment buildings, office space and hospitals. Its popularity fueled the construction of more and more malls. Nowadays, malls are less of a destination and are seen as a place to run errands or bypass shipping fees. Forever 21 occupied many malls with leases that were too long and spaces that were too large for the amount of merchandise they sold, fueling its demise.

On the consumer demand end, behaviors and attitudes toward stores like Forever 21 and its competitors like Zara and H&M have also changed.

For Sarah Okamoto, a USC junior majoring in computer science, a big portion of her money went to buying clothing, mainly from Forever 21. About once a week over the span of six years, Okamoto spent over 35 percent of her income at its brick-and-mortar stores.

“I started to realize it was almost [becoming] like single-use clothing, and I realized I didn’t want to be spending money on those things,” Okamoto said. “More and more people began pointing out that it was a fast-fashion brand, and it was really harmful for the environment. I think as people started to move away from that and there became more sustainable clothing options, I didn’t really feel a need to keep shopping there.” 

In addition to consumers becoming more aware of the harmful environmental impacts of fast fashion, Okamoto cited the rise of minimalism, thrift shopping and cleaning guru Marie Kondo. These new trends may also affect what consumers want to see in-store now. Similarly, stores that sell similar items to Forever 21 such as Charlotte Russe and Claire’s have also filed for bankruptcy in recent years.

With the rise of other fast-fashion competitors who have made their success through social media marketing and online distribution, the question then remains if Forever 21 can pick themselves up enough to once again to meet the changing needs of consumers and thrive again in a world where more and more physical stores are shutting down.  

The Mixed Effects of Rising Gas Prices on Consumers

During the week of October 2nd, gas prices in the Los Angeles area nearly reached the $5 per gallon mark, the highest it has been in five years. Since 2007, the average annual increase in gas is about 30 cents. The cost of gas is determined by a number of factors including supply and demand, geopolitical tension and a person’s location, among other things. So, what are the consequences of increased gas prices for the economy and how do these consequences affect consumer behavior?

         Gas prices are known to generally fluctuate over the course of a year due to regulations that require different gasoline blends for different seasons.  During the summer, beginning in the months of March and April, the Environmental Protection Agency (EPA) requires that a special blend of fuel be created which contains about 1.7 percent more energy than a winter blend, making it more expensive to make as production takes longer and yield per oil barrel is lower, an increase that is ultimately passed down to the consumer. Normally, gas prices come back down during the fall beginning September 15 when retailers are allowed to switch from summer-blend fuel to winter-blend fuel, but that isn’t necessarily the case for the West Coast, particularly in California where state and city regulations require the summer-blend months to extend until the end of October. On top of this, California also has some of the nation’s strictest gas-production policies that require refineries to create a cleaner gas blend with fewer emissions, a requirement that only a limited number of refineries are able to meet. The result is clear: California gas prices are consistently higher throughout the summer and winter months as compared to other states in the US. This is highlighted by the fact that during the week of October 4th this year, the average California price for a gallon of regular reached $4.18, compared to a national average of $2.65, and an average Texas price of $2.305, according to data compiled by AAA.

***The chart above, taken from the California Energy Commision, highlights the differences in gas prices between California and the US from 2005 to 2018. For each year, the price of gas has remained consistently higher in California than in the US in general.***

To better understand the impact of rising gas prices on the average Californian, the California Energy Commission released an analysis on gas prices in California this year at the request of Gov. Gavin Newsom. Their analysis found that California consumers have a gasoline preference for higher-priced brands such as Chevron, Shell, and 76, and are willing to pay higher prices to continue using these brands when gas prices rise. This indicates that consumers in this state prioritize the advertised quality of their preferred brand over the price of gas, despite having a multitude of options when it comes to choosing where to fill up that empty gas tank. Their report also found that Californians aren’t as concerned with gas prices as their non-western counterparts.

Despite this general preference for quality over price, not all Californians can afford to spend the extra money on presumably high-quality gas. The lower class faces a regressive tax when gas prices go up, while for the upper class, this difference barely (if at all) creates a dent in their wallets.  According to researchers at the Brookings Institute, rising gas prices tend to have a pronounced adverse effect on low to moderate income households in particular. For example, in 2010 when the average price of gas was $2.80 per gallon, US households with an annual income under $50,000 drove an average of 10,000 miles and spent roughly $1,500 on gasoline. Such households have had to front an additional $530 per year for every dollar increase in price, assuming the miles driven has remained the same. For higher-earning families, the increase may not have a direct effect on their purchasing power, but for lower-earning families who already spend most of their income, the impact is far more dramatic. Having no alternative, low to moderate income families are then forced to either cut back on other expenditures or fall further into debt just to keep up with the price of gas. 

This is especially true for families that live paycheck to paycheck as is often the case for low-income households, particularly those that fall below the federal poverty level. A family with an annual income under $25,000, which represents roughly 25% of US households, would end up spending an extra 2% of their income on gas. This percentage is even higher for households with more family members, as a household of four with an annual income of $25,000 already directs about 8.6% of their earnings towards gas, according to data compiled by the Urban Institute. For a family with an annual household income of $100,000, however, the extra money spent on gas amounts to about 0.5%. These households are less likely than their less affluent counterparts to spend all of their income and more likely to have savings to dip into if necessary. While the difference might not seem so meaningful, a family that typically spends all of their income cannot afford to redirect an additional 2% of their funds towards gas, while the 0.5% might already represent a surplus for families on the higher-end of the earning scale. With a poverty rate of 15.1% in California, many households could certainly see themselves affected by rising gas prices as families struggle to adjust gas expenditures on their budgets.  

An increase in gas prices isn’t just unfortunate for lower-income consumers, it may have mixed effects on the economy as well. When almost 10% of a person’s income must be directed towards gas, there is little surplus left for spending on other goods. Retail stores along with the rapidly-growing ecommerce businesses may find themselves affected by high gas prices because many consumers simply have less money to spend on goods. As an immediate response to higher gas prices, lower-income households will cut back on discretionary spending such as eating out or purchasing luxury items and try to minimize unnecessary driving because they can’t do anything else to alleviate the situation. That is, they can’t simply move closer to work or switch to a more fuel-efficient vehicle. However, data released by the Commerce Department indicates that buying trends remain similar even when gas prices hit an all-time high, so long as consumer confidence is high. Consumer confidence may remain high even when gas prices rise due to a combination of factors such as low unemployment rates and tax cuts that make discretionary spending still seem favorable and financially safe. 

One important industry that does find itself largely affected by increasing gas prices is the automobile sales industry. When gas prices are high automobile retailers sell fewer SUVs and large vehicles because consumers would rather not purchase vehicles that require premium gas or that will require them to spend more on gas. According to the Automotive Network, there is a correlation between fuel prices and auto sales, such that when gas prices are low, many people are more likely to purchase a larger car or performance vehicle. This is illustrated by the fact that large, gas-guzzling pickup trucks and SUV sales were up almost 10% in 2015 when gas prices were comparatively low, and the sales of the fuel-efficient Toyota Prius’ were down roughly 12% from the previous year. Unfortunately, gas prices don’t stay low forever, and those people who bought gas-guzzling cars realize they cannot afford to keep up with the costly maintenance of paying for premium gas.Businesses such as UPS, FedEx and other package delivery services are also affected when gas prices increase because their cost of operations becomes more expensive, also known as a ground fuel surcharge. This added expense is then passed on to the consumer, who now has to pay more for shipping: “Fuel surcharges allow for UPS and FedEx to keep its base shipping rate while making the necessary changes to cover any increase in fuel price” (Gibbs).

In response to these rising gas prices, business owners and employers have been forced to develop innovative ways to help their businesses and their employees save money. Some businesses have adopted work-from-home or carpool programs to help alleviate the financial burden caused by high gas prices on commuters.  Unfortunately, some businesses find it harder to evade the tax-hike effects. For example, drivers for Uber and Lyft are usually unable to escape the increase because their jobs rely solely on driving. Independent contractors must then funnel more money out of their pockets to bring in the same income, forcing them to work more or make less, especially for those who have no direct control over their rates. This might be enough to take away the appeal of being self-employed as a ride-share driver. To address the potential loss in employees, Uber and Lyft both implemented programs to incentivize drivers to opt for electric cars. A company in New Jersey, MMW group, created incentives to help with the rising gas prices by allowing customers to work from home two days a week and try to cut their employee’s transportation costs in any capacity they can. 

Gas price fluctuations have more of an impact on our daily lives than we think. The poorer working class woman who has to spend over two hours in traffic daily to save money wherever she can, now has to worry about the little money she has left going towards gas. The car dealerships begin to worry about meeting their monthly quota because people don’t want to purchase as many vehicles. Gas prices aren’t just prices; they impact the decisions people make on how they want to spend their money and how much they want to drive, especially for lower-income drivers. 

Sources: 

Gibbs, Brian. “How FedEx and UPS Fuel Surcharges Affect Shipping Rates.” Refund Retriever, 8 Mar. 2019, www.refundretriever.com/Fuel-surcharges.

Isidore, Chris. “Low Gas Prices Boost SUV and Pickup Sales.” CNNMoney, Cable News Network, 4 Dec. 2015, money.cnn.com/2015/12/04/autos/gas-prices-suv-pickup-sales/.

Marketing. “The Effect of Higher Oil Prices on ECommerce & Retail Spending.” The Effect of Higher Oil Prices on ECommerce & Retail Spending, www.rakutensl.com/post/will-higher-oil-prices-impact-ecommerces-bottom-line.

Nedlund, Evelina. “California Gas Prices Soar above $4, Reaching the Highest Price in Five Years.” CNN, Cable News Network, 8 Oct. 2019, www.cnn.com/2019/10/08/business/california-gas-prices/index.html.

Rocco, Matthew. “Why Surging Gas Prices May Not Stop Consumers from Spending.” Fox Business, Fox Business, 10 Oct. 2018, www.foxbusiness.com/economy/why-surging-gas-prices-may-not-stop-consumers-from-spending.

Sawhill, Isabel V. “How Higher Gas Prices Hurt Less Affluent Consumers and the Economy.” Brookings, Brookings, 28 July 2016, www.brookings.edu/opinions/how-higher-gas-prices-hurt-less-affluent-consumers-and-the-economy/.

Shinn, Lora. “4 Ways Employers Can Cut Commuting Costs.” Bankrate, Bankrate.com, 24 Nov. 2008, www.bankrate.com/finance/personal-finance/4-ways-employers-can-cut-commuting-costs.aspx.

Unrau, Jason. “The Correlation Between Fuel Prices and Auto Sales.” CBT Automotive Network, CBT News, 17 May 2018, www.cbtnews.com/the-correlation-between-fuel-prices-and-auto-sales/.

It’s not easy going green: the plight of SoCal drivers, gas, and electric cars

The 1995 Mitsubishi Eclipse used in The Fast and the Furious by Brian (Paul Walker)

In 2001, it cost Brian, Paul Walker’s character in The Fast and the Furious, $24.674 to fill up his lime green 1995 Mitsubishi Eclipse. Gas cost $1.46 per gallon. The Mitsubishi has a fuel capacity of 16.9 gallons. As the Fast and Furious franchise grew, so did gas prices. According to AAA, California’s current gas prices are $4.075. In 2019, it would cost Brian $68.87 to fill up his Mitsubishi Eclipse. 

Let’s pretend that even in a cinematic universe now defined by lucrative physics-defying crime, Walker’s character still owns that 1995 Mitsubishi Eclipse. If his character was still involved in the franchise (RIP Paul Walker), he would rather steal a Tesla than pay almost $70 for a full tank of gas. 

In the real world, Californians may not be stealing Teslas, but interest in electric and hybrid cars has grown. This year, the California New Car Dealers Association found that electric car sales have increased since 2018 by 63.7%. Hybrid car sales are up 22.1%. 

Gas prices are one of the reasons why. When filling up your tank makes a visible dent in your disposable income, being able to drive without worrying about gas becomes really appealing. The opposite is also true – when gas prices are low, alternatively powered car sales decrease. The Bureau of Transportation Statistics found that while electric and hybrid car sales increased rapidly from 2011 to 2014, sales decreased in 2015 “due to low gasoline prices.”

Gasoline Hybrid and Electric Vehicle Sales: 1999 – 2015 (Photo: Courtesy of Bureau of Transportation Statistics)

Despite California’s rising gas prices, the top two cars sold in the Golden State for the first six months of 2019 were the gas-using Honda Civic and Toyota Camry. Tesla Model 3 came in at third place. 

Even though California’s gas prices are at $4.075, getting an electric is not an investment some Southern California drivers are willing to make for a variety of reasons. 

NOT AS GREEN AS YOU THINK 

Hanna Richter, a stable attendant at Disneyland, lives approximately 45 minutes from the Happiest Place on Earth in Riverside, Calif. Richter commutes on what she describes as a “heavily trafficked route.” 

“It’s awful,” she said. 

Richter drives a gas-using vehicle, a 2018 Toyota RAV4, and pays just under $200 per month for gas. She said she is on the fence regarding electric and hybrid cars. “I like the one hand of less gas and saving money by using said less gas,” Richter said. 

What is stopping her is concerns about whether one of the main selling points of electric cars – that it is better for the environment – is actually true. “The batteries used to make electric cars cause a greater carbon footprint than just using a gas-powered car,” Richter said. “So I’d like to save money on gas, and use less gas. But I also want to lessen my carbon footprint.”

Many electric cars are powered by lithium-ion batteries. According to Amnesty International, making them is an energy intensive practice, and is primarily located in China, South Korea and Japan – countries where electricity generation is dependent on fossil fuels. Lithium-ion batteries are also linked to human rights abuses in the Democratic Republic of Congo. 

Richter’s concerns were confirmed in a 2018 study by the International Council of Clean Transportation that found that making an electric vehicle produces more emissions than the manufacturing of a conventional car because of lithium-ion batteries. 

“On the other hand, electric vehicles travel farther with a given amount of energy and account for fewer emissions through the fuel production and vehicle use phases,” the study said. 

According to the ICCT, although the long-term environmental benefits of electric cars is not outweighed by emissions created by lithium-ion batteries, the emissions are still substantial. Without technological improvements, these emissions could become more substantial as electric cars increase in popularity.

For consumers like Richter who want to lessen their carbon footprint and spend less money on gas, striking the balance between an ethical decision and a logical financial decision is complex.

In addition, electric vehicles are generally more expensive to purchase than their gas-fueled counterparts. The manufacturer suggested retail price for a 2019 Toyota RAV4 is $25,650. The hybrid version of the car is retailed at $27,850 – an 8.2% increase from the gas version. 

According to the Office of Energy Efficiency and Renewable Energy, the federal government and several states offer incentives to buy electric cars. California offers a rebate of $1,500 to $7,000 depending on the purchaser’s household income and the kind of electric car bought. 

California’s Vehicle Rebate Program (CRVP) Amounts (Photo: Courtesy of Moving California)

CONVENIENCE


Richter’s boyfriend, Dan Grecu, works for a tile contracting company in Riverside, Calif. He lives in the same city he works in. Unlike his girlfriend’s 45-minute commute, his drive to work is only 10 minutes. His car – a RAM truck – consumes gas. 

Going green did not factor heavily into his car purchase.  “I wanted that car because it has plenty of room for passengers and storage,” he said.

Southern California’s traffic and high gas prices are a recurrent source of frustration for him. That, and the lack of rain, has made him consider moving to Canada or the Pacific Northwest. “Gas prices in California are and always have been too high. I spend about $250 a month on gas,” he said. Spending that much a month on gas for one year would be like buying a new pair of Apple AirPods Pro, which cost $249, per month.

Apple AirPods (Courtesy: Photo by Howard Lawrence B)

One of the reasons why California’s gas prices are so high is because of SB 1, colloquially known as the Gas Tax. Grecu is not a fan of the policy. “I think it’s ridiculous,” he said. “I would like to know where the money actually goes.” 

Passed in 2017, SB 1 taxes gasoline to collect revenue for transportation infrastructure. California’s roads are one of the worst in the country, and were given a D grade by the American Society of Civil Engineers. With over 175,000 miles of public roads, ASCE estimated 44% are in poor condition. “A good transportation system enables efficient movement of goods and people and is critical to California’s economic well-being,” ASCE’s California infrastructure report card said. 

Two years into SB 1, and officials estimate that $130 billion more in revenue is necessary to improve the state’s roads. The policy has found itself caught in a sort of catch-22. 

A 2017 report by Next 10, a California-centric nonprofit organization focusing on the economy and the environment, found one of the reasons California’s roads are in poor condition is because “funding for repairs and improvements – which traditionally comes largely from motor vehicle fuel taxes – is declining as cars become more fuel-efficient and the state’s electric vehicle fleet grows.” 

According to the report, the displacement of gasoline as a revenue source could lead to $572 million in losses in state gasoline taxes by 2025 without new, sustainable transportation funding solutions. SB 1 may not be doing enough – and in fact, with increasing gas prices driving up electric vehicle sales, may be ineffectual at fixing California’s roads and very effective at irritating people who drive gas-powered cars.

California leads the United States in electric vehicle sales / (Photo: Courtesy of CleanTechnica)

SB 1 does not expire for 10 years and is designed to grow over time to fall in line with the cost of living. The most recent increase occurred in July 2019.

Despite rebates, rising gas prices, and lower operating costs of an electric car, Grecu said he is not considering one because the technology is not where it needs to be to make sense for him. 

“I would consider electric if I lived in a house with solar panels as electricity is still expensive,” he said. “I don’t think there are enough charging stations, yet. Once the batteries are built for longer trips, it would be more convenient.”

NOT THE RIGHT TIME

Vicki Ghines, a resident of LA’s Koreatown neighborhood, drives approximately 120 miles five days out of the week to her job as an account manager in the Inland Empire. She drives a 2017 Honda Accord. She said that getting an environmental or hybrid car is not something she is considering right now. “My car is fairly new and I know it would be years before I get another one,” she said. 

Ghines said she got her new Honda under protest. “I had to replace my 2001 Honda Accord. It had 345,000 plus miles on it, and since I had been going home late at night from work, my sister was so afraid that the car may break down, especially at night,” she said. “So she kept ‘nagging’ me, asking when I will get another car.” 

Her average consumption of gasoline per month is around $300. 

A car is a significant purchase – a purchase consumers want to last them years. For consumers like Ghines who bought new cars recently, buying an electric car is not feasible. It’s a decision they can afford to procrastinate on. 


Ultimately, a car is a personal choice – an economic expression of identity. In California, having a car is an almost inescapable purchase. According to Hedges & Company, over 84 percent of California’s driving age population is a licensed driver. Perhaps because it is so ubiquitous, a car choice matters all the more. 

SOURCES

Brands in the Digital Age: How Glossier Revolutionized E-commerce

Breaking Into the Beauty Industry

The beauty industry is valued at $532 billion and is still growing (Business Insider). Traditionally, the industry is driven by companies that tell consumers who they should be and how to achieve beauty. The companies and the products they sell supposedly hold the power to transform our looks to become the best and most presentable version of ourselves. High-end makeup brands set the tone and make beauty exclusive and unattainable–whether it is because of the values they market or the high product price points. Beauty is marketed as something to aspire to, rather than a quality one already possesses. The marketing from these companies was anything but real life as, according to a report on Glossier by Jumper Media,”Beauty brands lacked the context of real women and real experiences, focusing instead on the illusion of perfection” (Jumper Media). To be as profitable as it is, beauty has become a limited and exclusive commodity. Glossier, the skincare and makeup brand, dug into the market and democratized the beauty industry by building an affordable product with the consumer, not just for the consumer. Glossier revolutionized the industry by flipping the traditional beauty narrative and filled in the gaps where the beauty conglomerates were lacking. 

Currently, 182 companies in the beauty industry are owned by 7 major leaders: L’Oreal, Unilever, Johnson & Johnson, Shiseido, Coty, Procter & Gamble, and Estée Lauder Companies (Business Insider).  As a young and independent company, Glossier was provided the freedom and flexibility to reach its audience in a relevant and innovative manner, against the traditional business processes. Glossier used digital tools to create its brand, rather than communicate its brand. According to Megan Quinn, a partner at Glossier’s latest investor, Spark Capital, “Beauty consumers increasingly want to interact with brands and purchase products online. The industry’s conglomerates are ill-equipped to retrofit their businesses to this new reality” (Reuters).  Born in the digital age, Glossier’s advantage was staying connected to its customers at every phase of the business process. 

The rise of digitization increased access to information. People were able to share their opinions online and subsequently form niche communities. Beauty bloggers and vloggers filled in the gap of information between brands and consumers, and the conversation surrounding beauty expanded. The popularity of the “Get Ready With Me” vlog became the new model for advertising.  In this style of vlog, influencers would take their viewers through their daily routine, and advertise the products they swore by in the process. Consumers learned about new products from their favorite vloggers and bloggers that they began to trust. The dispersion of information from other beauty lovers (rather than brands) began to give more power to the consumer rather than the brands. 75% of Americans look at reviews before making a purchase (Cave Social). Glossier created products based on the information from these independent communities and became the first beauty brand that people saw as a trusted friend. 

The New Direct-to-Consumer Model

Glossier was raised alongside other direct to consumer brands like Warby Parker, Dollar Shave Club, and Casper.  All of these companies found gaps in long-standing industries. They understood the pains that had developed within existing industries, and remedied them. These brands are also based on emotion, inclusivity, and accessibility. Warby Parker made trying on glasses at home accessible, and brought down the price of traditionally expensive prescriptions. The Dollar Shave Club changed the narrative of the homogenous razor blade ad, and captured vulnerability while selling a subscription to shaving razors. Casper took the tiresome experience of buying mattresses and turned it into a trendy brand by using marketing methods such as social media influencers and Twitter memes.  

All of these brands capitalized on digitization to create a brand with and truly for the customer. The story and brand values are more important than the product itself. Businesses first turned to social media as a platform for marketing, but social media is as much for listening as it is for sharing. They used digitization to not only market their products, but to also capture the ethos of their products. Brands like Glossier sell consumers on their ideas, and from the start have an empowered relationship because of prioritizing the customer’s values.  These new brands have used their independence to their success as they are able to find innovative ways to reach the customer rather than operating under the traditions of a conglomerate. 

Marketing and Customer Acquisition

In the digital space, the best way to stand out is to fit in. Glossier does a phenomenal job of marketing itself as a best friend or older sister, passing down advice in the form of selling products. It’s approach to Instagram is to mimic the coolest it-girl, simultaneously chic, yet down-to-earth. Glossier changed the narrative on marketing make-up. Glossier contradicts the traditional makeup advertisement that projects a dark and sultry image. Weiss is driven by the value that, “Snobby isn’t cool, happy is cool” (Buzzfeed). The marketing of Glossier was not intended to intimidate people into trying its products, but rather appear as approachable as possible. 

MAC Ad Campaign
Glossier Subway Ad
@glossier

Glossier was so spot on with the branding and creating products for its target audience because it listened to what the customers had to say. Glossier employs 150 of its most active customers on a Slack channel for quick focus group feedback (Quartz). Glossier posted the question, “what’s your ideal face wash?”, to the internet and 382 comments and a year of development later–Milky Jelly was released (Buzzfeed). Glossier’s social-media marketing strategy was not just to share and promote content, but to also listen to and engage with its following. 

Glossier and its cult following established a mutual loyalty to one another. For as long as Glossier vows to give them what they want, its followers will continue to be brand evangelists. Glossier created a brand that people were excited and proud to represent. Engaging with Glossier on Instagram is like getting recognized by your favorite celebrity on the internet. People upload their photos using the products or tag Glossier in their selfies–to be recognized by the brand, but also to let their following know that they are a part of this “It-Girl” cult. 

By fostering this sense of community, Weiss somehow convinced millions to purchase cosmetics without even trying it on–further revolutionizing the traditional makeup shopping experience. From readers to followers, followers to product advisers, advisers to the community, community to a customer, customer to a promoter (Buzzfeed), Glossier’s growth is attributed to their relationship with their audience.

Glossier’s commitment to the consumer is so strong that instead of selling through larger channels like department stores, it sells direct to consumers–only ever online or at one of the few stores. Glossier pop-up stores are not to be experienced without a line that wraps around the block. Once you enter the store, Glossier’s Instagram comes to life in the form of a playroom. Customers are encouraged to try on the product and snap a selfie–for some free marketing of course–before making a purchase. 

The future of e-commerce is emotional commerce. Technology not only allows businesses to access consumers, but their thoughts and minds as well. While all of these companies utilize social media to reach their customers, the brands that will truly reach their customers are the ones built with them. Glossier disrupted the market and is an example for many companies to follow. It put the customer above the product and catered to the beliefs of a generation. It was innovative because it valued emotion and connectivity, and built a community instead of a business hierarchy. 

Glossier’s Story

While the conglomerates are pivoting to catch up to the new e-commerce model, Glossier was born from the internet. Glossier sprung from a blog called Into The Gloss. The founder of the two brands, Emily Weiss, was working as a fashion assistant at Vogue when she founded Into The Gloss in 2010 and focused on sharing beauty tips and tricks online. In her featured column “The Top Shelf” she sat down with celebrities like Kim Kardashian and Karli Kloss and interview them on their routines, favorite products, and would learn more about their insecurities. These moments led her to find gaps in the beauty industry where people felt let down, and also what they couldn’t live without. She read every response that came through Into The Gloss’s blog and Instagram to understand what it was that people loved, and what they felt they were missing. Into The Gloss became her focus group for customer discovery, and from that community, Glossier was born.

In 2014, Glossier launched with four products– a cleaner, priming moisturizer, lip balm, and misting spray. The brand intention was to create products for the everyday girl–not the creative makeup artists as other brands such as MAC cater to. The brand has now developed into a line of 40 products ranging from fragrance, skin and body care, and a thorough makeup line. As the range of products grow, Glossier returns to the idea of producing a brand and product based on the needs and opinions of its customers.

Economic Impact

During the Series D funding round in March 2019, Glossier raised $100 million from investors led by Sequoia Capital (Bloomberg). The company was then valued at 1.2 Billion, earning its status as a Unicorn. From 2014-2019, over 5 rounds of investment Glossier has raised $186.4 million in funding (Crunchbase). In 2019 they raised the most money following a year in which their sales had doubled. At the end of 2018, the company had grown to $100 million a year in sales, which was double the revenue from 2017 (Forbes). With the rapid expansion of its product line, and the additional $100 million in funding from 2019, Glossier expects unprecedented growth in the coming years. 

Silence of the canaries

The news over the past few months has been riddled with updates regarding the possibility of a recession. The yield curve has proven itself to be a reliable signal, as it successfully predicted the past seven recessions. However, viewing one part of a large, complex machine may not tell the whole story. Many other indices and sources of information should be taken into consideration when deciding whether or not a recession is likely.


US Trade Balance

The tensions between the United States and China are an integral part of this puzzle. Greg Ip, chief economics commentator for the Wall Street Journal, explains that from 2000-2017 import tariffs were below 2 percent, but President Trump’s tariffs bring that figure close to 6 percent.

This has direct implications on the international logistics industry, too. Fewer goods being made due to higher prices leads to less demand on the delivery of such goods.

On September 18, 2019, Fedex announced reduced earnings and reduced forecasted profit and revenue. As a result, shares took a 13 percent dive in their prices to $150.91. This fall was the largest decline in share price the company suffered since 2009, as it lost $6 billion in market capitalization. CEO Frederick Smith attributed this loss to decreases in shipping volume to China, while CFO Alan Graf pointed at Europe.

The Trade Balance chart above details that the US is importing more than it’s exporting – hence the negative signs by the digits. Here, the farming industry is a rather large factor to these statistics.

According to the United States Department of Agriculture, the US’s largest agricultural export to China is soybean. Soybean accounts for $12.3 million in export revenue and 63 percent of agricultural exports. 

Since China implemented tariffs on US soybeans, the price and export of soybean has plummeted. In September 2012, soybean prices reached an all-time high of $17.36 per bushel. The price of a bushel of soybean as of October 7, 2019 is $9.15.

Prior to the trade war, the US and Brazil had roughly the same amount of market share in terms of agricultural goods to China: approximately 40 percent. As of May 2019, the US has only 10 percent market share due to the tariffs imposed by China. That explains some of what is happening in the current negative trade balance.

Farmers are suffering as a result. It is predicted that farmers will lose $130 per acre after rent as a result of the tariffs. If they can’t sell their products, then they can’t pay for costs of any kind such as: rent, equipment, maintenance, sustenance, power. If farmers who don’t own their own land can’t pay rent, then they will have to relocate. That on its own is devastating to any farmer. To think that if farmers were evicted from their rented land in droves, one can easily think that agricultural real estate prices would crumble, unemployment would rise, and GDP would drop.


Purchasing Managers’ Index

While US exports decrease, new purchase orders have come to a screeching halt, as shown in the chart above. The editorial board of the Wall Street Journal says “uncertainty about demand, prices and tariffs is causing business to scale back new equipment purchases.”

The PMI has steadily decreased from 2018 and even more so in 2019. Using the data on the chart, 2018 averaged a PMI of approximately 58-59.

This year has, so far, seen the most contraction since the Great Recession.] January rang in the year with 56 percent. September registered a PMI of below 48 percent. This is a relative decrease of 15 percent.

When the months of 2019 are compared to the respective months of 2018, the difference is striking. August 2018’s PMI registered above 60 percent while this year’s August PMI registered below 48 percent – a 20 percent relative decrease.

            Domestic logistics are feeling the pinch. As trucking companies nationwide feel strapped for cash, orders for new heavy-duty trucks fell by 79 percent. Since July 2019, the trucking sector has also slashed 9,600 jobs.

           ACT Research president and senior analyst, Kenny Veith, said, “…there will be layoffs up and down the truck manufacturing supply chain as a result of falling demand.”

Manufacturing Production Index

Above is the latest Manufacturing Production Index. Declining over the past year, September was “the steepest month of contraction for the manufacturing sector since June 2009” due to the effects the US-China trade war had on imports, exports and the prices of raw materials.

            While the US is facing contraction in manufacturing, purchasing and a trade imbalance, automotive manufacturing has been in the news recently. United Auto Workers’ strike has been an on-going disaster for nearly a month.

The strike started on Sept. 16, 2019, as a result of the expiration of its labor contracts with American automotive manufacturers. The union demands higher wages, healthcare, opportunities for temporary workers and profit sharing – General Motors (GM) achieved record profits of $2.4 billion in second-quarter earnings (a 1.6 percent increase from the previous year).

When 46,000 union workers go on strike, the cars won’t make themselves. GM is losing as much as $100 million per day as the strike continues. The effect of the strike is not limited solely to GM. It is destroying its home, Michigan. As the strike goes on, state income-tax revenue drops $400,000 per day.

           The latest data shows the US produced 2.55 million units in August 2019, which was a drop compared to July’s 2.67 million units. The US automotive manufacturing industry reached its bottom point of 1.29 million units in January 2009 – the Great Recession. The disparity between the amounts of units produced in 2009 and 2019 is narrowing, and the US hasn’t officially gone into a recession yet. The Federal Reserve Bank of Atlanta estimates a 1.8 percent growth for the third quarter. The Bureau of Economic Analysis released its estimate on October 30: 1.9 percent.

Oil & Geopolitics

            While the US-China trade war is an intertwined battle of politics and economics, geopolitical matters also have huge sway on markets. Above is a chart from www.oilprice.com that displays Brent Crude oil prices over the past month. The beginning of the chart shows a spike in prices from approximately $60 to $67.50 per barrel during mid-September. This spike was a result of a supply shock after Saudi Aramco’s facilities were attacked by foreign agents. These attacks disrupted 5 percent of global production. Ip claims that “investors and economists see supply shocks as a threat to growth.”

            Brexit is another international matter that has American investors on-edge. Nobody can see the future or reliably predict the outcome of Brexit – whether deal or no-deal. Brexit has serious implications to supply chains and financial markets. Goods won’t transport as easily and people can’t travel as conveniently, and that affects overall production and output.

As Jon Hilsenrath and Josh Zumbrun of the Wall Street Journal, say, “businesses react to uncertainty by pulling back on investment and employment, and a slew of economic data in recent months strongly suggest the theory has become reality.”[

           Hilsenrath and Zumbrun go into detail about this data in their article. August 2019 saw a fall in job openings of 7.5 percent. They also mention truck and heavy machinery orders facing a decrease, which was briefly explained in the PMI section. British demand on American goods has decreased by 2.6 percent in the past year, which was made evident by US export data.

            On top of the US economy’s internal contraction, international disruptions of this magnitude send the US economy into a panic mode. This psychology further affects the economy, as everyone believes that it’s going awry. As mentioned above the Federal Reserve Bank of Atlanta estimates third-quarter results at 1.8 percent. The BEA estimates third-quarter results at 1.9 percent. Seeing as both those number are lower than Q2’s 2.1 percent, it seems as though all indicators officially point to a recession.

Brain Drain: the Spiraling Issue


In our current era, more countries are entering stages of industrialization and development to compete with already developed countries. This process of development has many growing pains, some of which can hinder or discourage continued progress and can cause problems that lower rather than raise the standard of living and life expectancy.

One of the more prominent growing pains is brain drain: a process by which the growing educated elite of a region or country emigrate to typically more-developed countries with better opportunities, thus removing the skilled labor workforce from the country’s population. 

This reduction in the skilled labor population often translates to a vacuum in necessary services required for development, including education, healthcare, and engineering, among others. This can ultimately decelerate or even stagnate growth. If left unaddressed, brain drain can compound and lead to worse problems.

When a portion of the educated elite leave, there is a higher stress on the remaining skilled workforce to fulfill the demands in services those emigrants were meant to fill. This worsens working conditions and increases the disparity between the actual value of the service provided and the compensation service-providers are ultimately given. These problems then push more of the workforce to emigrate elsewhere, accelerating the rate of brain drain. 

This is the case in Nigeria, where improved education has created a swathe of healthcare professionals ready to enter the workforce. In recent years, however, a majority of this workforce has left for developed countries such as Canada, Australia, and the U.S. after completing their education. Of the 72,000 doctors and dentists registered under the Medical and Dental Council of Nigeria, over half of them work outside of the country. This has left the medical industry with one doctor for every 5,000 Nigerians

Why are Nigerian’s health professionals leaving? 

Many health professionals cite a lack of resources—including basic utilities such as water and power— poor working conditions, and poor compensation. They criticize the Nigerian government for allocating only 4 percent of their national budget to healthcare despite the desperate need for such services.

PHCs, or Public Healthcare Centers, are the lifeblood of Nigerian healthcare. They face a litany of issues in basic services, which then affect the quality and capacity of the service provided. Infographic c/o: Premium Times Centre for Investigative Journalism.

This is despite the fact that, according to Onwufor Uche, consultant and director of the Gynae Care Research and Cancer Foundation in Abuja, “eight of 10 Nigerians are presently receiving substandard or no medical care at all”.

Doctors themselves are payed N200,000 monthly ($560)—a paltry sum compared to the compensation in Canada.  With more doctors leaving, the disparity of how much value doctors bring to the economy versus how much they are compensated becomes even greater. 

The government of Nigeria has attempted to remedy this situation by providing education subsidies to generate more health professionals. This naturally creates an incentive for more to enter the healthcare industry, but it doesn’t exactly address why people emigrate in the first place. 

It is not as if Nigeria’s economy is struggling to generate the funds necessary for a proper compensation program either. As an OPEC country, Nigeria’s profits from petroleum have boomed since the 1970s. Yet, governmental corruption has failed to allocate and invest those economic resources into infrastructure, basic utilities, and key service industries such as healthcare. Many also cite that, while education may be sufficient in creating a healthcare workforce, getting residency and certification from the government is such a grueling process that lead many to either give up or move abroad.

How do we tackle the core issues that lead to brain drain?

Taking on the process of developing infrastructure and industry is a big task– one that is often not done on the government’s participation alone.

Several decades ago, China was in a similar situation as Nigeria is currently. Despite its burgeoning population and the leading regime’s incentives and directives to increase industry in the form of factories, China saw its educated elite fleeing for other developed countries. This was in part due to the oppressive measures in censorship by the government that discriminated against the educated in China.

This discrimination hindered the education system and the emergence of entrepreneurial exploits, particularly in the STEM field. Frustrated by the blocks and the lack of support, particularly during the technology boom of the 1990s, many left China for the U.S. and Japan to participate in the research and development opportunities there.

As China began to experience the effects of this exodus in the stagnation of its industries, particularly in competing in the technology landscape, the Chinese government decided to use the opportunities abroad as leverage. They began a subsidy program which would help Chinese nationals study abroad. Over the next ten years, they focused on generating capital through their exploits in industry and exports. In the early 2000s, the government created economic opportunities competitive to those in other developed countries to entice Chinese nationals back. They specifically targeted sectors they wanted to stimulate, such as solar power.

The number of returning nationals shot up from 1 million in 2001 to 4.8 million in 2017. Chinese nationals who went through this program were dubbed “sea turtles”, as they would bring innovation and education from other sources to enrich China’s economy.

Now, however, some ‘sea turtles’ are struggling to compete with China’s own locally educated youth. Research innovation and infrastructure were built up in such a way that have since made them also educationally competitive on the global stage. Perhaps it is in these conditions that China is can be considered a “developed” nation. 

What if developing countries have not acquired enough capital to offer such competitive opportunities?

The development process for a country’s economy may take years, and the effects of brain drain slowing that process only further drains resources (including capital) and time.

The mass emigration of the Filipino workforce, particularly in the nursing and hospitality sector, is a case in which the country of origin simply does not have the resources necessary to remain competitive enough to retain their skilled population. In 2013, the Philippines deployed approximately 1.8 million workers– about 10 percent of its population— to other countries. In that sam year, the country itself was ranked number one for exporting nurses and number two for sending doctors overseas.

Poor working conditions include temporary contracts which lead to unstable career path, high nurse-patient ratio, a lack of resources, and understaffed hospitals and clinics. Infographic c/o: Filipino Nurses United.

Such high statistics are a result of poor working conditions juxtaposed with a remarkably strong nursing and healthcare service education system. Essentially, the Philippines is an example of the extreme implementation of Nigeria’s current plan.

Healthcare in the Philippines continues to suffer the same problems as that in Nigeria– where there is a deficit of healthcare workers for Filipino citizens and infrastructure is still poor. The government attempted to counter such issues by “overproducing” skilled professionals through its highly specialized nursing and healthcare programs.

The large population of abroad workers, however, also has made the remittances those workers significant enough to contribute to the economic growth of the country– up to $25 billion annually. This contribution has led the Filipino government to further encourage migration. This is in part due to the fact that remittances is a steady income that is often unaffected by the regional economic fluctuations. Despite how beneficial remittances have proved for the Filipino economy, there are concerns about the dependency these transactions bring to the country as a whole.

As a means to combat that potential risk, the Filipino government is looking to begin return programs much like China’s “sea turtles,” but face little progress due to the fact that their resources and compensation remain noncompetitive and unstable compared to opportunities abroad. Whilhe the Philippines may still suffer through the growing pains of economic development, they have crafted a way to utilize its brain drain to boost economic development and mitigate the process’ larger problems. This ultimately can encourage its continued development and the aspiration towards a better standard of living.

While these strategies may have worked for China and the Philippines, it is unwise to assume that they will be the save-all for Nigeria. By looking at these examples, however, we can begin to gauge how governmental powers may target one aspect of infrastructure or policy to lower the barrier and reduce push factors.