Movie Theater Popcorn Index

6a00d834518cc969e20120a6b6ef5b970b

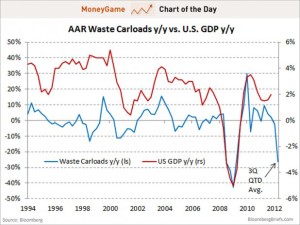
Patterns in consumer spending, which account for more than two-thirds of the economy, are most often the principal influence on both the stock and bonds markets. In times of economic downturn, both consumer confidence and consumer spending become diminished as people tighten their belts.

The 2008 US and world financial crisis that spurred economic recession resulted in a dip in consumer spending between a period of two years [2008-2010], according to the Bureau of Economic Analysis.

In 2009 US consumers spent 2.8 percent less, on average, than they did in the previous year. Expenditures essentially decreased across the board and entertainment decreased by 5.0 percent from the Bureau of Labor Statistics report from 2008. In spite of the overall decreases in spending U.S. box office sales hit an all-time high in 2009 at the height of the recession.

box office

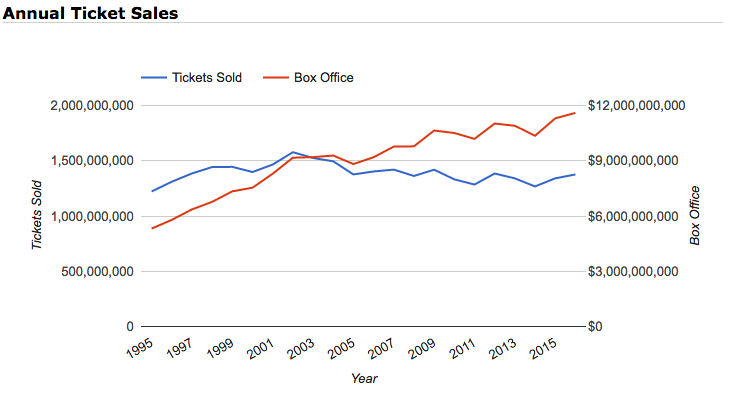
Short-term enjoyment as a means of forgetting economic despair is not uncommon consumer behavior. In fact, after the crash of 1929 that led to the Great Depression consumers flocked to their local theaters. This sort of escapist mentality was mirrored again during the Great Recession, with films like James Cameron’s record-breaking Avatar producing 2.788 billion USD in ticket sales.

imgres

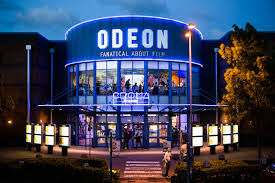
ODEON Cinemas, the largest cinema chain in the United Kingdom by market share took this traditional consumer response a step further by observing trends in the company’s concession sales. Though not a perfect science the chart [below] indicates that while economic downturn may lead to more box office sales, dips in the FTSE – an indicator of consumer confidence – correlate to a decline in the consumption of concessions, more specifically popcorn for U.K. cinemagoers. The cause of these trends is obviously debatable but likely do to the fact that while people may be running to the cinema during periods of economic downturn, they are not necessarily buying up concessions.


odeon popcorn index

The Odeon popcorn index of economic confidence compares average popcorn sales per ODEON cinemagoer with the Financial Times Stock Exchange 100 Index (FTSE 100 Index) of companies on the London Stock Exchange with the highest market value.

Rupert Gavin, chief executive of Odeon, tracked week-by-week popcorn sales and observed that sales of popcorn and the FTSE were not only correlated. At one point sales of popcorn were leading the FTSE.

Between June and July of 2009, popcorn sales continued to rise while the FTSE took a short drop, spiking up again by mid-July. This was significant because it meant that popcorn sales had the potential to predict future economic climates, while also reflecting current climates.

There is no way of knowing for sure whether or not movie theater popcorn sales will remain an economic indicator; however, at least for now they appear to hold a certain level of credibility for gauging the market and consumer confidence and spending.

http://www.thisismoney.co.uk/money/news/article-1679109/Popcorn-index-shows-economy-on-mend.html


Coffee as a leading economic indicator

A recessive economy is no match against the steaming morning luxury that fuels the pulse of the city. Consumers pinch their pockets for the morning Cup O’ Joe, even during economic strife, but the foam-topped coffee can get expensive overtime.

Barista-Jobs-760x450

Folks that are willing to spend as much as $6 a day on a morning beverage is a curious concept in a struggling economy. Spending habits on coffee are inextricably linked to an established morning routine. Coffee drinkers are creatures of habit. The coffee drinker views the cup as an inseparable part of the daily ebb and flow of life. Coffee sales outside of the home skyrocketed in 2004, likely due to the success and popularity of popular corporate coffee houses. Coffee transformed from an in-home treat to a fast food experience.

Over the past decade coffee consumption outside the home has shown some reaction the the nation’s economy. In 2001, coffee consumption outside the home was in the low 30% range as the nation entered the economic recession. Ryan Sweet, a U.S. economist for Moody’s Analytics alludes that a low coffee consumption percent is directly correlated to a high unemployment rate. In 2004, when the U.S. unemployment picture turned around for the better, outside home coffee sales soared from 29% to 40%.


Coffee Consumption Outside of the Home

YEAR 2001 2002 2003 2004 2005
           
Outside Home 32% 34% 29% 40% 39%
Unemployment 4.7% 5.8% 6.0% 5.5% 5.1%
Economic Climate Backdrop Recession “Jobless Recovery” ” “ “Unemployment Improves” ” “
YEAR 2006 2007 2008 2009 2010 2011
             
Outside Home 40% 33% 36% 35% 30% 27%
Unemployment 4.6% 4.6% 5.8% 9.3% 9.6% *9.1%
Economic Climate Backdrop ” “ Recession ” “ ” “ “Jobless Recovery” ” “

*Seasonally adjusted unemployment rate for month of July from Bureau of Labor Statistics

Source: National Coffee Association of USA for coffee consumption in the home and outside of the home; Bureau of Labor Statistics for annual average unemployment rate figures; Economic climate backdrop Moody’s Analytics.

Via aol.news

According to one economist, however, coffee will only suffer in the most serious times, and is considered as necessary as the utility bills and automobile gas. Most coffee houses are doing as well as they ever have, and according to Verner Earls of Chauvin Coffee Company, some coffee houses have reported record sales. “People aren’t going to give up the latte,” claims Verner. “Bigger expenses will go first.” The mindset behind the consumption of coffee allows coffee houses to weather recessions well.

This general trend for coffee consumption does not leave all coffee houses safe. Many local shops struggle with a crunched economy, as well as corporate coffee chains being forced to close down stores. In 2008, during the heat of the recession, Starbucks Coffee announced it will close 600 stores across the United States, according to the New York Times. This move by Starbucks cost over 12,000 employees their jobs, the most in its history (via the New York Times).

The fall of Starbucks in 2008 reveals that java sales are a hot economic indicator of the state of the economy. As the dollar collapses, so does the average American’s spending power.

Coffee has become a fast food luxury treat, all of which its raw materials: sugar, coffee, milk, wheat, and chocolate are all skyrocketing in price due primarily to the fall of the dollar, according the the Huffington Post. This hike in prices causes the cup cost to steadily rise.

Coffee sales, specifically using the example of Starbucks Coffee establishments is a prime example of how a falling dollar will make something like coffee, an item that Americans gorge on, daily for that matter, too expensive to include in the morning ritual.

Speaking from experience, a trip to a coffee shop is an absolute treat that I enjoy frequently with my mom. So much so, that we budget our social coffee hour into our weekly expenses tough economy or not.


Sources:

http://www.riverfronttimes.com/foodblog/2009/04/01/java-enabled-is-coffee-recession-proof

http://archive.boston.com/lifestyle/food/articles/2011/12/14/in_a_weak_economy_buying_morning_coffee_is_a_small_reward/

http://www.aol.com/article/2011/08/11/is-coffee-the-new-leading-economic-indicator/20015519/

http://www.nytimes.com/2008/07/02/business/02sbux.html?_r=0

Economic Indicators: Beer

Economic Indicators: Beer

Image result for beer

The world’s economy is constantly changing and while people commonly use economic indicators such as GDP, unemployment rates, etc. to gauge the economy, other surprising measures can be decently accurate. One interesting economic indicator is beer. When the economy is good beer consumption at restaurants and bars are relatively stable/high. However when the economy is slower, beer consumption also slows down. The reason for this shift is that when people have less spending money they generally go out to eat less and even when they do eat out they are less inclined to purchase drinks at dinner. Similarly people may frequent the bar less and if they do go to the bar they might drink before hand or purchase less drinks at the bar to save money. Instead they might purchase beer at a grocery store and drink it at home or forego drinking entirely. People are less likely to spend money are items that are not considered necessities. The consequences of declined beer consumption affects more than just bars and restaurants. It affects the waiters and waitresses at the bar and the breweries themselves. The waiters make less money and tips, which affects their purchasing power. The breweries may also earn less revenue due to decreased consumption. As a result they may slow down production and produce less beer. This could also have a domino effect on their employees if they no longer need as many workers to sustain the demand on their products. All these consequences also affect tax revenues. The government will not be able to collect as much tax revenues if less product/money is being earned.

26928822890_9a5d12e55e_o


And The Gold Medal Goes To… The Economy

rio-image

Every two years a country from anywhere in the world is strategically chosen to host the Olympics. I say strategically because being given the honor to host the Olympics greatly effects a country’s reputation, residents, and, most importantly, its economy. Therefore, to account for this major event, economists at Bespoke Investment Group came up with the Olympic Indicator to measure the state of the economy during this exciting time.

The Olympic Indicator shows that markets tend to prosper during the Olympic games. Bespoke Investment Group explains this by saying that the excitement of the USAs-Simone-Biles-poses-with-her-gold-medal
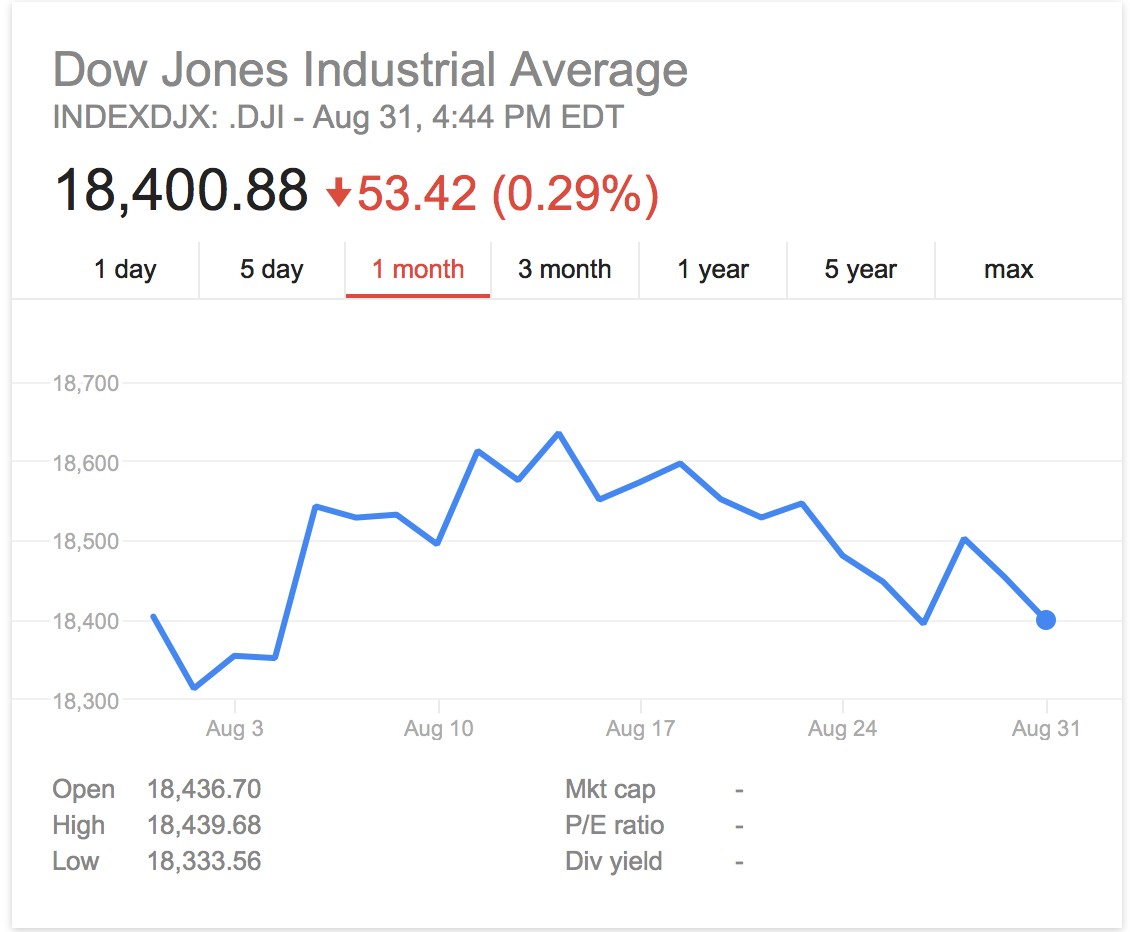
games distracts investors from problematic economic data and headlines. Bespoke confirmed this notion by tracking the Dow Jones performance during the Summer Olympics between the opening and closing ceremonies since 1900. Their results; positive returns in 18 of the last 26 games.

This summer in Rio de Janeiro marked the 31st Summer Olympics. However, ct-zika-virus-olympics-rio-20160128there were a lot of concerns leading up to the games on whether Rio could afford the Olympics, issues with their government and city safety, the presence of the Zika Virus, issues with severe water pollution and if the Olympic buildings were even going to be finished on time.

However, with all these problems, the U.S. economy still seemed to benefit from the games. By looking at the chart below it is evident that the Dow Jones Average spiked from 18.352.05 on August 4 to 18.543.53 on August 5, which was the day of the Opening Ceremonies in Rio. Although the average fluctuated during the Olympics, ever since August 21, the date of the Closing Ceremonies, the average is almost back at where it started on August 4.

Screen Shot 2016-09-01 at 1.30.14 AM

Although the Dow Jones Average shows that the American stock market did improve during the 3 weeks of the Olympics, the Olympic Indicator does not actually prove that the games distract investors. Therefore, the economic growth that occurs during the Olympics can also be explained by looking at the money that is entering markets around the world. For example, NBC Universal paid $1.2 billion for the right to broadcast the Olympics in Rio, which is chump change to Rio’s estimated $12-20 billion they spent on hosting the games. All of this money promotes consumer spending and puts money into the economy that was not there before, which in turn, betters the economy.

Rio-olympics

Sources:

http://www.marketplace.org/2016/08/05/world/let-s-do-numbers-what-has-been-spent-rio-olympics

http://www.usatoday.com/story/sports/olympics/rio-2016/2016/05/12/impeachment-trial-set-rio-olympics/84275984/

http://www.marketplace.org/2016/08/05/world/let-s-do-numbers-what-has-been-spent-rio-olympics


Commiserating Financial Pain: Online Dating as an Economic Indicator

DateTix-01

As people become vulnerable with their pocketbooks, do they become vulnerable to loneliness as well? Statistics from online dating sites demonstrate that tough financial times correlates with higher numbers of people surfing the web for someone to commiserate their pain with.

These findings are supported by various online dating sight’s financial and user data. Match.com’s website traffic and quarterly results reported having the busiest site traffic during 2008’s turbulent financial crisis. They additionally reported their best fourth quarter in seven years during 2008, the same time as the Dow Jones reported a five-year low (HCPLive). This data differs from previous Novembers, which are notorious for being a particularly slow month for online dating sites.

According t0 Perfectmatch CEO Duane Dahl, the turbulent economic period after 9/11 and the end of the dotcom bubble led to a 200 percent membership increase. Dahl credits this hike in numbers to the public’s desire to find comfort in a partner, either to console their financial stresses or solve them. The poll, sponsored by eHarmony, shows that respondents those who said they felt stressed by the current economy were 14 percent more likely to aim to be in a long-term relationship within a year, compared with those who were not stressed by the economy (Time Magazine).

Though there are numerous potential explanations for this phenomena, off site dating experts have contributed them to 1) more time spent online and 2) loneliness heightened by stress. Theoretically, tougher economic times results in people staying home more often. This inevitably results in people spending more time on their computers, clicking away at their potential matches on online dating platforms. At only $35 a month, online dating is cheaper than blind dates as well, making it a more viable option for those on a budget. Whilst the public turns to online dating to find their next relationship, economists can turn to their membership numbers to determine the status of the economy.

Sources:

http://cityroom.blogs.nytimes.com/2009/05/04/how-has-the-recession-affected-your-dating-life/?_r=0

http://www.nytimes.com/2009/02/12/fashion/12dating.html?scp=1&sq=dating%20recession&st=cse

http://www.hcplive.com/physicians-money-digest/investing/bizarre-but-used-economic-indicators#sthash.MvcAoGhx.dpuf

http://content.time.com/time/business/article/0,8599,1868694,00.html


Marine Advertisement Intensity Index

blog 1.2It’s a bad economy. Job searches have not been successful. Young people are running out of options.

What can they do?

Perhaps joining the military is not a bad idea.

This may have been a thinking process for the youth during recession in the U.S.. In 2011, non-profit research organization National Priority Project (NPP) has published a military recruitment research for 2010. According to the NPP research, there was not enough data to prove a correlation between unemployment rate and recruitment rate. However, it does infer how the poor economy may drive youths to think of military as a career option.

According to NPP, the accession rate increased from FY2009 to FY2010, which indicates how more people wanted to join the military. By the FY2011 recruitment period, the US military already fulfilled the whole year’s recruitment demand and the half of FY2012’s recruitment goal. Comparing NPP’s analysis and the U.S. unemployment rate from U.S. Bureau of Labor Statistics, the correlation between the unemployment rate and demand for youth to join the military seems to make more sense. Looking at the unemployment rate trend from the end of 2009 to the beginning of 2011, the unemployment rate fluctuate between 10% and 9%. Considering the recruitment dates starting on September-October period, the unemployed youth may have felt hopelessness on looking for jobs; consecutively, they thought of enlisting.

united-states-unemployment-rate-1948-2016-data-chart-calendar

bizarre-economic-indicators-8-728

As mentioned above, the recruitment goal for FY2011 overfilled the government’s demand. Consecutively, the government would want less recruits on next recruitment period. Of course, there the other factors influencing the military recruitment. For instance, 9/11 incident inspired many young Americans due to the rising patriotism. Yet, the recruitment goals by the year of 2005 supports correlation between unemployment rate and enlisting rate because the goal “had fallen short of its 80,000-person” according to New York Times.

To meet the recruitment goal, the U.S. military needs either inspire or scare to influence the American youth so the recruitment goal is met. There is a myriad ways to influence the public, but Business Insider and New York times theorized how Marine Corps advertisements may be the economic indicator that speaks about the correlation between unemployment rate and enlisting rate.

Business Insider and New York Times suggest that the intensity of Marine recruitment advertisements can be a measure of economy. The general concept goes something like this: when people cannot find suitable jobs due to bad economy, the Marine Corps terrifies the potential recruits with intense imagery in the advertisements because the Marine Corps does not want too many recruits. Though there is no easy to measure the intensity of the advertisements due to its qualitative nature, it is certainly interesting to look at in the light of communication.

Marine Corps The Climb YouTube3

“The Climb”

The proof Business Insider and New York Times provides is the comparison of advertisements after and before the year of 2002. In 2002, the Marine Corps released an advertisement called “The Climb”. The advertisement showcased a man rock-climbing on a cliff. As the man ascends, the imagery of deployment, courageous Marines, American flag, troops helping people in needs, and many patriotic symbols appear on the cliff. At the end of the climbing, the man sees himself in the Marine uniform. The man gets picked up by himself in the uniform and they emerge into a proud Marine with a halo his back. Watching “The Climb”, being a Marine does not seem to be a bad idea. After watching the advertisement, it does not seem to matter how hard the training is because being a Marine looks like the most worthwhile occupation in the world. This advertisement highlights the slogan of Marine Corps “The Few, The Proud” because the advertisement sends powerful imagery to state how every recruit can become a proud Marine after a rigorous training and self-development.

The advertisement on the 2002 definitely seems to attract many recruits. On the year of 2008, however, the advertisement changed the look of military. Preparing the next fiscal year, the Marine Corps released “America’s Few” advertisement. The advertisement starts with young men from different backgrounds. They rally at the same location and the scene shifts to the series of hardcore training the cadets go through. The commercial shows the images of very intense training such as rope climbing, diving into the water with full battle gears , getting exposed to tear gas, training in the mud, getting thrown into the hand to hand combat with no protective gears, war simulations, and rigorous combat practices.

United States Marine Corps America s Few YouTube

“America’s Few”

Towards the end of the commercial, the narrator says that only a few can earn the title of proud Marines. Compare to the 2002 commercial, the advertisement on 2008 highlights how selective the Marine Corps is on picking its candidates. The images of trainees in pain from the training were repeating throughout the commercial. If the 2002 commercial was about the glory of becoming a Marine to attract many candidates, the 2008 commercial was definitely about influencing potential candidates to be hesitant on enlisting. On the year of 2009, the unemployment rate was 9.8% on September. In other words, there may have been a need to reduce the number of candidates to the Marine Corps as the unemployment rate rose; hence, “The Few” was more emphasized in the commercial than “The Proud”.


Of course it is not an accurate measure because the intensity can be subjective; however, the Marine Corps advertisement intensity index certainly has a value of studying. It definitely reflect on how the government communicates with people for the supply and demand. Just as other economic indicators influence how people feel about economy, Marine Corps advertisement intensity index influence how people feel about the government’s demand and supply.


The Happier, The Better

Since the early 2000s, several scientists have found that happiness can be used to predict the likelihood of developing coronary heart disease or even the strength of one’s immune system. Similarly, economists are finding happiness to be an effective indicator of the health of a country’s economy.

Based in its rich Buddhist heritage that stresses the accumulation of happiness over material goods, Bhutan was the first country to measure its economic might and societal wellbeing using the Gross National Happiness (GNH) instead of its more conventional cousin the Gross Domestic Product (GDP) in 1972.

A country’s GNH is a numeric value assigned based on nine categories: time use, living standards, good governance, psychological well-being, community vitality, culture, health, education, and ecology. The general of level of happiness in a population can indicate a high level of confidence in the economy which in turn increases consumer spending, a hallmark of a thriving financial system.

There is debate over what levels of happiness mean for economics and business cycles. Some economists claim that higher GNH indicates a stronger economy while others argue the exact opposite. The graph above indicates a decrease in happiness as growth begins to pick up, a trend that may be explained by greed. Perhaps as people become more successful, they develop an insatiable appetite for more wealth.

However, Gallup polling in over 150 countries from 2007 to 2013 found that as national happiness decreased and national suffering increased, nations become more unstable which decreases investor confidence sending shockwaves through the economy. The graph below demonstrates wealthier countries, generally nations with stronger economies, are more likely to be satisfied than their less wealthy counterparts. Similar to how high levels of dissatisfaction leads to instability, high levels of satisfaction can be seen as a reaction to and help perpetuate stability in markets by encouraging investors to invest and consumers to spend.

The Gross National Happiness is by no means a flawless indicator of economic strength. More than anything, it shifts national focus away from numbers to potentially more worthwhile and feasible gains. As we deplete natural resources at an ever-growing rate, focusing on achieving goals that emphasize positive emotions over material goods – especially when considering near stagnant economic growth in many industrialized nations – might be worth taking seriously.


The Garbage Indicator


CANTERBURY, UNITED KINGDOM - AUGUST 23: A truck empties its load of waste at the Shelford Landfill, Recycling & Composting Centre on August 23, 2007 near Canterbury, England. The Shelford landfill site, run by Viridor Waste Management, receives 200 truck loads of waste weighing 2100 metric tonnes a day. (Photo by Peter Macdiarmid/Getty Images)

Garbage is an unlikely economic indicator that actually has an 82% correlation to US economic growth, according to economists Michael McDonough and Carl Riccadonna. It is very intuitive because in times of economic well being, consumers buy more and as a result throw more away. If you buy a new TV you will throw out an old one, or if you go out to dinner you will throw away food you have at home and leftovers from your meal out. The more excess money people have, the more they buy, and are more careless about what they throw away.

Waste comes in many different forms. Michael McDonough states, “That’s what’s great about this indicator. It’s holistic because it’s not isolated to a single part of the economy. It’s people throwing things out, it’s buildings being demolished — it’s everything.” Almost half of the trash indicator is steel and iron waste, and the next biggest component is demolition and municipal waste.

In good economic times there is also an increase in waste from commercial and residential construction. With a lot of construction, there is also a lot of material added to waste. The data comes from the American Association of Railroads on a weekly basis, which means that it is very up to date. Garbage is therefore not a leading indicator, but can likely be classified as a coincident indicator or a slightly lagging indicator. In order to collect the data people must have already bought things and thrown them away.

The holidays are a time when we can especially see the correlation between garbage and the economy. In times of economic well-being, people will buy a lot- gifts, food, decorations, etc. This all turns into trash after the holidays and the trash bins will be overflowing. In a time of recession, people are much more conservative about what they are purchasing, especially around the holidays. Fewer gifts, less extravagance, and therefore less trash.

Garbage may seem very commonplace, yet it is a very relevant indicator that shouldn’t be overlooked. In the chart below we can see the very close correlation between GDP and AAR Waste Carloads from 1994 to 2012.

chart-of-the-day-us-garbage-indicator-july-2012


Sources:

http://www.recyclereminders.com/blog/trash-economic-prosperity/

http://www.marketplace.org/2012/08/16/economy/tracking-economy-and-gdp-through-trash

http://www.businessinsider.com/chart-of-the-day-the-us-garbage-indicator-economy-2012-7

Jobless Claims: A True Indicator?

For many people in the United States, the unemployment numbers that are used to measure the strength of the economy are imperative to their confidence in the economy.

But really, how strong is the US economy right now?

While most people in the United States today believe that the economy is growing just from popular knowledge and news in the media, there are many people, including market analysts and economists, who use certain economic indicators, like the jobless claims indicator to measure the true strength and current climate of the current economy.

This economic indicator, known as Jobless Claims, reports the number of individuals in the United States that newly filed for unemployment insurance that month.  This can help investors, and every day citizens shape a perspective and determine how they perceive the current state of the United States economy.

This data is also seasonally adjusted, in order to account for seasonal hirings and firings during certain times of the year, like before the holiday season in November.Screen Shot 2016-08-31 at 8.35.43 PM

Most economists believe that the four-week moving average is a more accurate number to gauge the economy, as the week-to-week number is volatile due to immediate changes in the economy or country.

According to the report published on August 25 by the United States Department of Labor, the level of jobless claims is at a historically low level, as there are currently low levels of layoffs and many people are not filing for unemployment insurance.

As released in the last report, 261,000 people filed in the past week lowering the level by about 1,000 claims overall.

Economic anScreen Shot 2016-08-31 at 8.31.04 PM
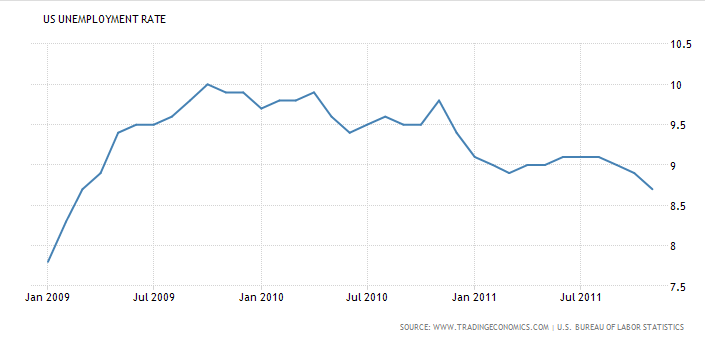
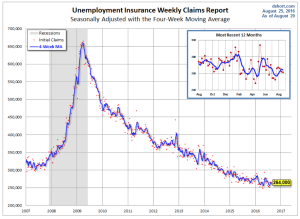
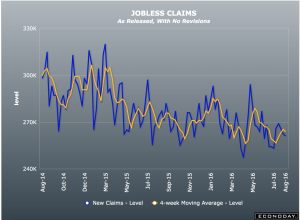
alysts believe that the jobless claims numbers will continue to remain similar throughout the next few months, as the economy continues to grow and the labor market improves.

While many citizens believe that the current economy has improved since the economic downturn a few years ago, the jobless claims indicator proves that the economy has drastically improved.

The number of people who have newly filed for unemployment insurance, known as the jobless claims, has remained under 300,000 per week for over 77 weeks.  This record is the longest streak in the Uweekly-jobless-claims-620ds122012S labor market since 1970.

While things seem to be looking up for the economy, it is important to understand that people are still filing for unemployment insurance.  As the unemployment rate is not currently at zero percent, there are still people who are looking for jobs and unable to find them, and therefore there are people who need the assistance from the unemployment insurance.

The number of jobless claims is at a historical low, yet there are still many people who have distrust and lack confidence in the state of our economy.  While the jobless claims indicator paints a pretty and strong picture of the economy, it is very important to look and identify other indicators that allow a much more inclusive and authentic picture of the current state of our economy.

Ladies Turn to Lip Service in Times of Turmoil

636031229994457049-1287133605_national-lipstick-day-ftr1

Want to predict if we are entering a recession without consulting the usual economic indicators like gross national product (GDP) or the unemployment rate? Enter the lipstick index. It basically shows that in times of turmoil, American women turn to purchasing makeup and lipstick. Leonard Lauder, the chairman of Estée Lauder, coined this term in 2001 because he found that in times of hardship, women consistently turned to his makeup company and their sales soared.

So why does this link to a recession in the economy? While the desire to own products such as electronics declines, primal cues increase women’s desire to attract mates through the use of beauty products. Psychologists analyzed this phenomenon further only to realize that when the going gets tough, women buy makeup, perfume and stilettos to increase their sexual appeal. The end game? To find a mate that can provide financial security in the future. Although some may believe that women should think adversely about finding a suitable mate during a time of economic strife, we are primed to believe this—especially during a financial crisis. When you think about it, a financial crisis separates the fiscally strong men from the pack and women see this. Charles Darwin and evolutionary biology suggested that only the fittest of a species will survive. So therefore in a recession, a woman needs to find a mate that can provide resources and can help achieve reproductive success like biology tells her. I know what you are thinking, that’s crazy but it’s true. Even during the Depression, cosmetic sales increased by 25 percent.

As a woman, I find this hard to believe, but are we kidding ourselves? It doesn’t seem like it. However, I would rather buy two lipsticks, eyeshadow, a tube of mascara and a bottle of perfume for $180 from Sephora over a blouse for the same price of Nordstroms and that has nothing to do with biology. We can all get more bang for our buck when it comes to makeup during a recession. If you really think about it, a blouse or expensive purse is more of an investment than a couple of beauty items that can boost your confidence to the same level.

The lipstick index may be something that is cognitively hardwired in women but it also happens to be an excellent economic indicator. In fact in 2008, L’Oreal saw their sales increase by 5.3 percent while other companies like Ford saw a decrease of 18 percent that same year. Although beauty brands may not suffer during a recession, clearly almost everyone else did. This shows that power of the consumer during economic decline and how their behavior can make or break an industry, whether they realize it or not. Primal needs take over in times of crisis from finding a suitable mate to making hard fiscal decisions in order to survive the next month. If anything, this shows that economics can be regarded as a study of behavior and women rather you’re your usual dollars and cents.