Invisible influence—why traditional supply and demand aren’t the only forces driving commodity prices

If you’re like me, and every other average American, you’re happy to reach for your 1.96 cups of coffee each morning. You’re probably even happier that market prices for commodity coffee have been in sharp decline since 2015 and that, if you’re reading this, you’re living in the US where the average price of a cup of coffee is $2.70. Life is good for the caffeine addict and the general consumer alike—commodity prices are down. Theoretically, this means that abundant supply and stable demand have reconciled to make low prices and happy consumers.

As a zealous consumer of coffee, it is simple to examine the economy from my perspective as a consumer, my perspective where lower prices equate to a “better” economy. That perspective, however, is not only narrow-minded, but also ignorant. A full economic picture must examine each step of the supply chain, green coffee grower to distributor. Why? Because each player takes a cut of that $2.70 you pay at Starbucks each morning before your 8am lecture, morning meeting, or daily workout.

The free-market economy suggests that prices are determined by two factors—supply and demand.

Coffee

These economic rules may seem fairly pedestrian, but may be visually represented by the above graph showing the steady decline in coffee prices in the late 90s and early 2000s. General consensus credits this decline in the commodity price of coffee to a new entrant in the coffee producer scene—Vietnam (“The Global Coffee Trade,” Stanford Graduate School of Business). In contrast, 2014 yielded abnormally high coffee prices due to a prolonged drought in Brazil which rendered inadequate supply to satiate the appetites of worldwide caffeine consumers. With coffee demand growing relatively uniformly worldwide, market price fluxes appear to be most strongly correlated with supply disruptions.

Supply volatility, however, is not the singular issue.

Here’s the reality—coffee farmers cannot live on their negotiated wages, are subject to the whims of climate (even more so in the past decade), and lack the infrastructure needed to process and roast their coffee beans, leaving them with little bargaining power. While processors like Nestle and P&G certainly take advantage of their roasting infrastructure and supply chain, there is a deeper truth about commodity pricing—consumers demand superior products at low prices. How can free markets support and satisfy all members of the economy, producer to consumer, while operating under these parameters?

An attempt at a short answer to a long question about coffee economics, supply, and demand is this: because consumers, coffee enthusiasts like you and me, want lower prices, companies will fight on our behalf to get those lower prices. That is their role as competitive businesses. When we think about supply and demand, we cannot merely consider how much we demand, but what exactly we are demanding. We—I—demand high quality, superior tasting, convenient, caffeine-rich coffee at a good price every time I step into the coffee shop.  Those are intangible properties I associate with my tangible good. If I’m not willing to pay for those intangibles at the coffee shop, a coffee grower in Brazil will be paying for them instead.



China’s Population Anxiety

Recently, two academics from China’s universities proposed to tax all working adults under 40 to build a “reproduction fund”. The proposal aims at alleviating the costs of childbirth and raising fertility. When families give birth to the second child, they could withdraw money from the fund. However, those couples who don’t have the second child cannot withdraw any money until they are retired.

For decades, China has restrictively controlled the number of babies women could have. The one-child policy has been requiring families to have only a child. Those women who violate the policy will be forced to stop pregnancy and undergo sterilization operations by the country’s “family planning” offices. But decades later, the one-child policy has caused a looming demographic crisis that officials begin to realize that it could imperil economic growth and to be anxious for a baby boom.

The one-child policy was eased three years ago. But the damage to China’s population growth had been done and the fertility willingness could not be rebounded anymore. Now the country is dealing with a demographic time bomb, which features an increase in the number of elderly people and a falling birth rate.

As of 2017, people aged 60 and above accounted for about 16.2 percent of China’s population, compared to 7.4 percent in 1950, according to the UN Population Division. The global percentage of people over 60 sits at 12.7 percent. Also, according to the State Council, the population is graying quickly. about a quarter of China’s population will be 60 or older by 2030, up from 13.3 percent in the 2010 census.

The increasing number of aging population means more retirement pension should be provided for the increasing number of retirees. However, China faces a widening shortfall of the financial support. In 2017, China’s pension funds collected 3.3 trillion yuan ($515 billion) and handed out 2.9 trillion yuan in payments. According to Reuters, thirteen pension funds in regions and administrative units around China can only cover less than one year’s worth of pensions.

Moreover, ending China’s decades-old one-child policy has not raised birth rates as high living costs deter larger families. As Bloomberg notes, “High living costs, long work hours and surging child-care expenses mean that many couples feel that they can only afford to have one child — or none.” Although the number of births in China did welcome a rise of nearly 8 percent in 2016 after the government eased one-child policy and allowed a two-child policy in 2015, the rise did not last long and the number of births then fell 3.5 percent in 2017, from 18.5 million in 2016 to 17.2 million.

This does not bode well for China’s economic growth. During the past four decades, China has enjoyed its demographic dividend to boost the economy. With one-child policy, China artificially adjusted its demographic structure to a good one with the ratio of those too old or too young to work to the working-age population dropping below 50 percent. But these days are over. Now, China is still finding a way to regain demographic dividend with its population anxiety.

Consumer Sentiment as an Economic Indicator

Getting people to purchase a good or service is the primary goal of any functioning company in the world. Corporations spend millions of dollars to understand what makes people tick, on research analysis, focus groups, in-depth marketing, and surveys, and what might influence them to purchase products. The level of confidence that households on a wide scale have in the economy and vis-a-vis their personal finances is extremely vital to any organization. Consumer sentiment helps companies better understand how much of a good to produce, as well as where best to sell. Whether it is an apparel company like Nike attempting to figure out how many shoes to produce this year while projecting its American sales figures, or a technology company such as Apple setting its targets for a new iPhone, companies highly desire the latest consumer attitudes on the economy.

For decades, consumer confidence has been tracked by the The Conference Board by Nielsen, a global provider of information and analytics on the buying and watching habits of people around the world. The consumer confidence index helps measure the health of the U.S. economy and is “based on consumers’ perceptions of current business and employment condition, and their expectations for business, employment, and income for the next six months.” The company surveys thousands of households every month, with five questions total — two related to present economic conditions and three regarding expectations. Each question can be answered positively, negatively, or neutrally. Since 1985, the index has been set to 100. Today, the index is at 95.3 for the month of August 2018, the lowest in a year.

To explain the low confidence, “consumers voiced the least favorable views on pricing for household durables in nearly ten years, since October 2008. Vehicle buying conditions were viewed less favorably in August than anytime in the last four years, with vehicle prices being judged less favorably than anytime since the close of 1984. Home buying conditions were viewed less favorably in early August than anytime in the past ten years, with home prices judged less favorably than anytime since 2006.” In other words, some of the most important things that people purchase, that they spend the largest amount of money on and use nearly every day for a long period of time – cars and homes – have highly unfavorable prices and supply. With cars, the decline in consumer favorability could be explained by a sudden shift in preference from sedans (long a staple of the American economy and road) to more costly, larger cars like SUVs and crossovers, without the adequate supply to satisfy rising demand; additionally, this year marks the highest average cost of a used car in 13 years.

All types of organizations – including investment firms, manufacturers, retailers, global financial management firms, as well as governments – see the sentiments of consumers as key to planning strategy and actions for the foreseeable future. According to Yahoo, because weak consumer confidence may indicate declining consumer spending, manufacturers will likely decrease their inventories in advance. Asset management firms or institutional investors might not invest in new projects and companies involved in the large-scale selling of goods, such as retailers like Walmart. Construction of homes will decline due to lower demand. Governments would need to ready for future tax revenues reduction and quickly figure out where its spending cuts will likely have the least significant impact.

The consumer confidence index is considered to be a leading economic indicator for the United States economy. Additionally, the Organization for Economic Cooperation and Development (OECD) considers consumer confidence a global leading economic indicator. Thus, by analyzing consumer confidence, investors, companies and governments alike will get a better sense of what they should do to reflect the latest attitudes about the economy.

Sources:

https://www.wsj.com/articles/america-has-fallen-out-of-love-with-the-sedan-1535169698

https://www.usatoday.com/story/money/cars/2018/06/15/used-cars-price-hit-record-high/700362002/

https://tradingeconomics.com/united-states/consumer-confidence

https://finance.yahoo.com/news/why-consumer-confidence-important-economic-170019558.html

Consumer Confidence… or Lack Thereof

For many, August symbolizes beginnings. The hottest month brings a new school year and the long-awaited season of fall. One might think that these changes would encourage people to go shopping and buy new things, but this year, that is not the case. Consumer confidence hit an 11-month low in the United States. But what does that mean, exactly?


Consumer confidence is based on several factors. Each month, the American Conference Board surveys 5000 households to measure how optimistic or pessimistic consumers feel about the economy’s current and future performance. This is a leading economic indicator because if citizens believe that the economy is going to do well, they will want to purchase more, regardless of whether it’s smart to do so or not.


Earlier this month, the University of Michigan released that total sentiment fell to an 11-month low. The study revealed that the consumer confidence index (CCI) score fell from 97.9 in July to 95.3 in August, Reuters reports. This is how they got this number:


The CCI survey features a series of questions asking if the individual feels positive, negative, or neutral about the current and future economy. 40% of the questions concern the current economy, while 60% concern the future. Then, the Conference Board puts the responses into numbers by taking the amount of positive responses divided by the positive and negative responses combined. The scores are then averaged, and then compared to a benchmark value of 100.


This sounds complicated, but essentially it’s just an algorithm that quantifies consumer confidence.


The CCI is key because manufacturers use it to determine how much of their products they should produce. For example, if Apple sees that consumers are extremely confident this month, they might hire more factory workers to anticipate a boom in MacBook sales. This is a smart way for business to stay ahead of the supply and demand curve.


Economists, however, consider the CCI a lagging indicator, meaning it fluctuates after the economy changes, not before. In reality, though, if people think the economy is doing great and spend a lot of money, then in turn it will do great. Americans have the power to boost their economic futures by simply staying positive, but they tend to be pessimists. Current events seriously affect their outlook.


For example, the decline in CCI this month stemmed from the bottom third of the economy believing that this is a terrible time to buy large goods. This roots from an increased inflation rate over the past few months. Politics also play into sentiments, as the Trump administration’s protectionist trade policy has led Americans to believe that import duties will continue to rise.


Though consumer confidence is falling, one thing is for certain– it will rise again. The economy rises and falls every single day. Congress is constantly pushing new economic legislation. Changing weather conditions determine the price of goods. Trends lead people to buy certain things and not others. While it is scary to not know what the future holds, it can also be comforting.


SOURCES:

https://www.youtube.com/watch?v=YtT0cO9038E


https://tradingeconomics.com/united-states/consumer-confidence


Weather as an Economic Indicator

It’s a rainy day outside. Your plans to go to the smoothie shop, restart your gym membership, and drive to the beach after you go shopping at the Grove in Beverly Hills have been canceled. You know that California weather tends to be dry and hot for the most part, so you push off your plans to have a rainy-day in. This day consists of watching movies on your Netflix account and cooking with leftovers around the house. This day is a good day to finally pick up that book you bought two years ago about success. One might not think these very actions serve any impact to the surrounding companies and people. In fact, it does. You, in addition to all the other people that decided to stay in because of this spontaneous rain in sunny California, would be reducing your contribution to the GDP and the economic growth in general. Different climates make consumer behavior change.

Weather plays a substantial role in the health of certain markets and therefore influencing the economy. Weather relates to the condition of the atmosphere with respect to temperature, humidity, etc. Different temperatures call for different demands, like the need for winter clothes and the popularity of comfort foods increases when winter is around the corner. Different humidity conditions affect the growth of certain crops, the sales of personal care products, and tourism revenue. In regions where the weather changes drastically, the revenue in many businesses may thrive or cripple. Seasonal businesses can include fresh produce, clothing, tourism, etc.

Blueberries grow in the summer season, “typically grown in humid and northern climates that have winter chills, mild summers, and low-pH or acidic soils.” These conditions limit the places where blueberries can grow. In cases of natural disasters and global warming, the value of the crop can be changed.  

For example, in September 2017, Hurricane Irma destroyed more than 50% of orange crop in Florida. With less supply and now more demand, fresh squeezed orange juice spiked in price. With a reduced harvest, alternatives, such as frozen concentrated orange juice, became more expensive, as well. Based on USA Today, “orange juice drinkers pay as much as $2.30 more for a gallon of orange juice as a result of the broad swatch that Irma cut through Florida’s citrus crop.”

Based on Everyday Health, individuals eat more in the winter, which would yield to an increased demand for food. During the winter time, there is an apparent rise in sales for comfort foods, such as meatballs, lasagna, cookies, and pork chops. 

https://www.washingtonpost.com/news/wonk/wp/2015/11/25/the-hidden-ways-weather-determines-what-you-buy/?noredirect=on&utm_term=.cbabc329b7cc

Due to the influence weather has on economic activity, technology has found a way to monitor weather in efforts to capitalize on marketing and advertising. McDonald’s, a fast food chain, promotes coffee sales in cold areas and McFlurry sales in sunny areas. With access to current weather, companies can adjust campaigns to gain more impressions and attention. 


Why Sentiment Is Greater Than Spending

Economic indicators such as unemployment rates, the U6 number and the consumer price index are key insights into analyzing the economy. Experts are constantly studying what is going on in both the global economy and economies of specific countries in order to understand current economic states. This allows individuals to make educated predictions about the future of these economies. Often the most important indicators to look at are not those providing data of what is happening now or the spending that is taking place currently, but rather indicators that forecast future trends. These indicators are called leading indicators – one being consumer confidence.

Consumer confidence measures how optimistic consumers are feeling about the current state of the economy, as well as their own personal financial situation. The index is based on a monthly survey of thousands of United States households. The survey is put on by The Conference Board and consists of five questions surrounding topics like current business conditions, business conditions for the next six months, current employment conditions, employment conditions for the next six months and total family income for the next six months. Opinion on current conditions makes up around 40 percent of the index and expectation about the future makes up around 60 percent. The primary focus on the future is what categorizes consumer confidence as a leading indicator, as opposed to a trailing indicator like retail sales.

While this economic indicator specifies consumer sentiment, it has the powerful ability predict consumer spending. Consumer confidence will directly point to whether individuals are likely to go to the mall on the weekend to do some leisurely shopping, or if they will only be focusing on fulfilling only their basic needs. In turn, it aids experts and other consumers in understanding where the general population feels the economy is going – arguably the most important insight into a nation.

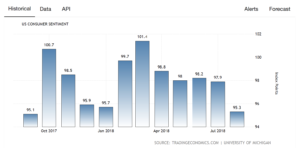
Normality of consumer confidence is measured at 100. In August 2018, consumer confidence in the United States was the lowest in almost a year, falling from 97.9 in July to 95.3. A graph tracking consumer confidence in the U.S. over the last year is shown below:

Experts are estimating the low reading is mainly due to less favorable perceptions of market prices. Additionally, consumers reported viewing vehicle and home-buying conditions as less favorable. There is evidence that consumers have become very sensitive to even low inflation rates, as they were anticipating a 2.9 % inflation rate ahead of August.

This fall in consumer confidence will likely reflect in next month’s retail sales and personal spending numbers. Aware of the effect of this economic indicator, corporations as well as politicians utilize consumer confidence to anticipate whether people will be likely spending more or saving more in upcoming months. Businesses are able to adjust operational plans as a result of the indicator, either increasing or decreasing volume production of their product. Additionally, the government can adjust their expected tax revenue based on consumer spending.

It is essential to pay attention to consumer confidence. It allows consumers and experts in economics to make proactive decisions regarding the economy. The economic indicator also provides valuable insight into the certainty citizen’s feel about their nation.

Trump Helps Mexican Economy?

Despite a previously rocky relationship between the Mexican government and the Trump administration, new trading deals have been discussed that seem to satisfy both countries. Trump has had a difficult relationship with Mexican President Enrique Peña Nieto due to Trump’s demands that Mexico pay for a border wall, yet it appears that negotiations have been made to continue a cordial trade relationship with Mexico. 

President Trump has been openly opposed to the North American Free Trade Agreement (NAFTA) and so he is determined to create new trade deals during his presidency. In an effort to achieve this goal, he has negotiated a new trade agreement with Mexico and is in the process of negotiating with Canada. Due to the complicated and difficult relationship between the United States and Mexico, Canada has been waiting for the issues between the two countries to be sorted out before getting involved in the new trade agreement.

In this new trade agreement, Trump has addressed his fear for loss of American manufacturing jobs. According to Charles Wallace, in Forbes, “the agreement provides that 85 percent of parts in the car must be made in North America to be considered for tariff-free imports. The Trump Administration has been concerned that car parts from Europe and Asia, especially china, were being assembled in car in Mexico and then imported for sale in the United States.” This new trade agreement gives Mexico an incentive to use America car parts because it saves them money on tariffs. 

President Trump is always very confident about his decisions, yet some of his plans for this new trade agreement may not be possible. Trump wants to get rid of NAFTA completely and create his new trade agreement as the sole agreement between the US, Canada, and Mexico. However, it is unclear whether this form of action can be implemented or will be allowed by Congress. He also feels so strongly about the trade agreement with Mexico that he has contemplated the idea of following through with the agreement even if Canada does not get involved. This is not a mind set that is agreed on by all members involved, though. Mexico has made it clear that the trade agreement must involve Canada and the US Congress has backed this opinion. Because of this, the trade agreement will not be complete until negotiations have successfully been made with Canada. There is, additionally, a time limit for the final negotiations to be made because López Obrador will likely attempt to make changes if the treaty is not completed before he assumes the presidency.

Currently, both the United States and Mexico stand to benefit from this trade agreement and the ability to negotiate between the two countries is a success in itself. However, there are still uncertainties about the future of the agreement and its success.  

How Turkey’s economy collapsed and what it teaches others

Last week, the Turkish lira tumbled to an all time low post-2008, losing a third of its value and is, at present, around six lira to the US dollar. The ripples were felt in several emerging markets. In Argentina, for instance, as the peso slumped to a record low, the nation’s central bank raised its interest rate to a staggering 45%. The currencies of South Africa, Brazil and Mexico were also affected.

In an article in Forbes, Jesse Colombo wrote that since 2002,“Turkey’s economy nearly quadrupled in size on the back of an epic boom in consumption and construction that led to the building of countless malls, skyscrapers, and ambitious infrastructure projects. Like many emerging economies in the past decade, Turkey’s economy continued to grow virtually unabated through the Global Financial Crisis, while most Western economies stagnated.”

Taking advantage of the low interest rates after the global recession of 2008, Turkish banks and firms drew on massive foreign loans to fund a relentless drive towards economic growth. Turkey’s real GDP grew by more than 34% in the last five years – only slightly less than China and India.

Things were looking up for quite some time: the labor force participation rate steadily increased, youth unemployment rate dropped, and the inflation rate was mostly steady. But there had always been indicators of the impending collapse that would burst the bubble.


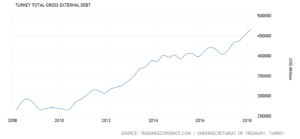
Turkey’s growth has been so dependent on financing from foreign investors that the nation’s total gross external debt reached around $466657 million in the first quarter of this year. Turkish banks had borrowed money at low rates from European and American banks right after the recession so that they could, in turn, loan the money out to Turkish companies. But as the value of the lira plummets, it seems more likely that the companies would be unable to pay back the loans, therefore also affecting Europe and the United States.

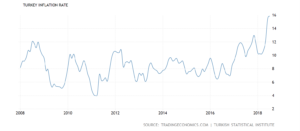
While the country’s inflation rate had more-or-less steadied itself between 2010 to 2016, it started spiraling upwards from the middle of 2016 and sky-rocketed in the past two months. The Central Bank of the Republic of Turkey was prevented from making the necessary interest rate adjustments to fix the crisis.

President Erdoğan is a believer of the idea that interest-based banking is “prohibited by Islam” and has also claimed that increasing the rate of interest is “treason”. Throughout his tenure as president, he has gradually stripped power and independence of financial institutions. After acquiring sweeping executive powers after his re-election in June, he resisted the bank’s calls to increase the interest rate. Perhaps in an effort to assert greater control of his country’s economy, Erdoğan appointed Berat Albayrak, his son-in-law to the office of Treasure and Finance Minister last month.


What can Turkey’s implosion teach other countries?

While the collapse of the Turkish economy would obviously affect the countries that invested the most in it, the indicators that should have ideally served as warnings of an impending collapse, can also teach something to other emerging markets. Several developing countries weathered the global recession and, like Turkey, used foreign investments to fund staggering levels of growth. Two examples are India and South Africa.

While the India’s external debt has steadily increased in the last ten years, it has so far managed tokeep inflation under controlwhile at the same time reporting high GDP growth rates. While India dealt with the global recession much better than most other states, in recent months, the Indian currency has taken a hit, perhaps indicating that the world’s second most populous country is walking an economic tight-rope.

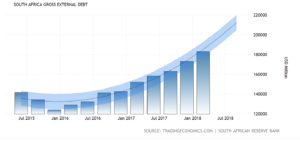
South Africa on the other hand is on the exact same trajectory as Turkey. Its external debt has rapidly risen and while the inflation rate was under control for some time, it has shown a steady increase and is set to increase again. The labor force participation rate of the country has also been steadily falling over the last few months.


How politics burst the Turkish bubble

Besides purely financial factors, the rule of law too has an effect on a nation’s economy. Among other things, politics was also responsible in causing a decline in Turkish fortunes. Local businesses got caught up in the government crackdown of dissenters post the failed coup d’étata couple of years back. It has often reached ludicrous levels. According to a report by NPR, for instance, a certain brand of carpet stopped selling because the factory that manufactures it had been raided by the police for alleged links toFethullah Gülen, the United States-based cleric whom President Erdoğan accuses of orchestrating the coup.

Internationally, the relationship between the United States, a major investor, and Turkey have recently worsened over a variety of issues ranging from Turkey’s continued detention of Andrew Brunson, an American pastor allegedly linked with the coup, the nation’s handling of the Syrian crisis, and its cozying up to Russia. The financial crisis was in-part accelerated by President Trump’s decision to double steel and aluminum tariffs on Turkey.

While the crisis in Turkey could affect the United States, Europe, and some emerging markets of developing countries, it could further destabilize the economies of neighboring Iraq and Syria, further destabilizing a region already torn apart by war.

Are “They” Taking Our Jobs?

A significant part of the justification behind Donald Trump’s recent trade war with China lies in his supposed rapport with the American White working class, specifically those who come from the manufacturing, farming, and mining sector. He repeatedly makes the claim that the outsourcing of jobs and the stealing of U.S intellectual property by countries like China has taken away “millions and millions” of jobs, costing us “billions”. Hence, taxing foreign imports would encourage American industries to “buy and invest local.” The U.S trade deficit plays a huge role in this. China is screwing us, Trump claims, and stealing “500 billion dollars” from our economy.

But if it were really the case that massive trade imbalance harms the economy, then it would follow that at the very least an increase or decrease in the trade deficit would correlate with an increase or decrease in unemployment rates.

The unemployment rate measures individuals who are willing and available to work or are actively seeking work. Those working part-time are considered employed. The trade deficit measures the difference between a country’s net exports (goods leaving the country) and net imports (goods coming into the country).

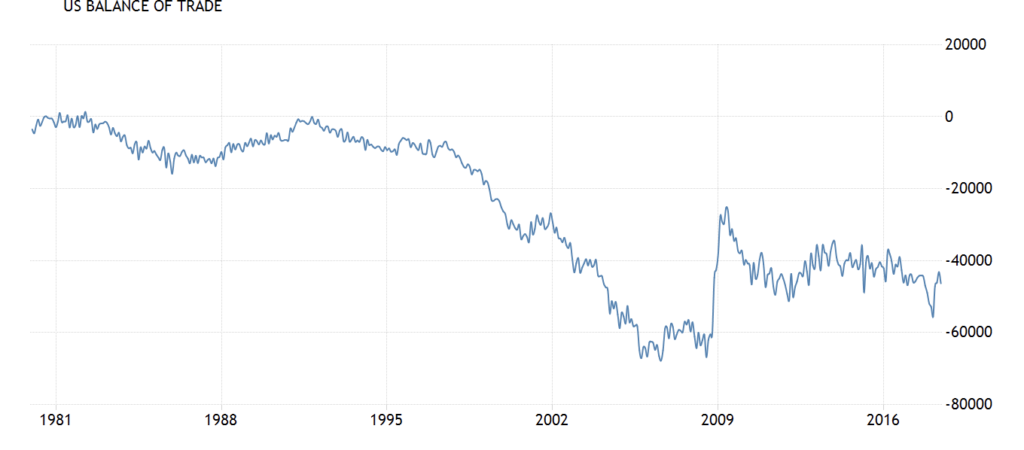
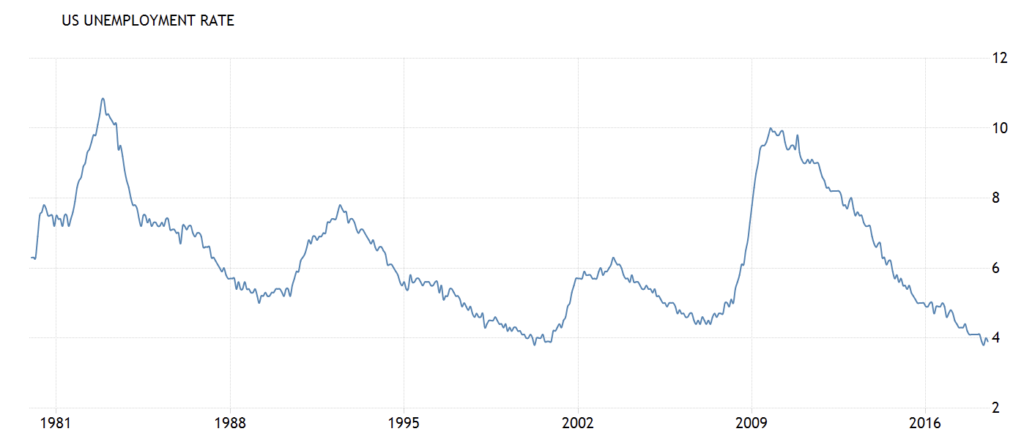
Compare and contrast, then, U.S trade balance and the unemployment rate since 1980, according to the U.S Bureau of Labor Statistics:


The above graphs of course paint a very complicated picture of the effects of trade balances on employment rate. While the periods between 1981 and 1986-86, and 1988 and 1992-3, saw a slight correlation between rising unemployment and an increasing trade deficit, the period between 1995 and 2000 saw the opposite: there was a huge decrease in unemployment despite a massive widening of the trade deficit. In fact, sometimes it is even the case that decreasing trade deficits correlate with rising unemployment, as is demonstrated by the 2008-2010 period.

So if Trump wants to cause a trade war, he’d best provide another justification, as job losses don’t seem to have much to do with trade imbalances. It also weakens his NAFTA argument—that NAFTA is one of the main culprits in the massive outsourcing of jobs to Mexico. Since the act’s passing in 1993 until the Dot-Com Bubble, employment had actually decreased from about 7% to 4%. So there you have it: “they”—those malevolent, rapacious, cheating foreigners—are not taking away our jobs. The question then remains as to why Trump continues to wage this ridiculous trade war with China, even when it actually hurts American workers.