Crowdfunding – investment method of the future?

The advent of the internet allowed, for the first time, a more participatory, two-way form of communication. In the past, corporations and media companies broadcasted messages for the public to digest without offering a truly significant out for feedback save for letters to the editor. The internet however, created a collaborative platform in which not one single entity controlled the message. Users from around the world for the first time could engage in discussion and share ideas.

It is unsurprising, then, that the disruption of the model of communication would be echoed in the disruption of the traditional ways an entrepreneur would seek funding. While in the past entrepreneurs and hopeful business owners would have to rely on investors, loans or their own money, the emergence of the internet has allowed for a fairly new form of funding: crowdfunding.

According to Investopedia, crowdfunding is defined as “the use of small amounts to capital from a large number of individuals in finance a new business venture.” Social media platforms such as Twitter, Facebook, and LinkedIn and crowdfunding work in perfect tandem to attract as many investors as possible for the business venture.

There are two main models of crowdfunding: donation-based and investment crowdfunding. As the name suggests, with donation-based crowdfunding, funders willingly donate money towards some collaborative goal. More often than not, these funders will receive some sort of reward based on how much money they donate. For example, in the case of funding a new album for a band, a funder may receive a CD for donating $10, or a private concert for donating $10,000.

Investment crowdfunding is different in the sense that funders will gain a portion of the business in form of stocks, equity or debt in return for their investment. In this model, funders have the opportunity to make money off their investment as opposed to the donation-based model, where funders will only receive a product or service (similar to pre-ordering an item.)

Research conducted by Massolution, an association dedicated to researching crowdsourcing and crowdfunding, showed that “crowdfunding platforms raised $2.7 billion and successfully funded more than 1 million campaigns in 2012.” Forecasts see these numbers increasing dramatically over the next few years as the successes of crowd-sourced projects continue to catch the public’s and potential business owners’ interests.

Crowdfunding offers many advantages over traditional forms of investment. First of all, it greatly benefits small businesses which lack the cash or resources in order to grow. When seeking funding for a project, the business sets a time limit (varying from a few weeks to a few months) and a target goal. Furthermore, details of the product are made available to the public, and the business’ financial records are made more transparent. Funders are also able to see the progress a business is making towards achieving that goal. Funders can be as involved as they like in the process by tracking progress, asking questions and offering suggestions. This creates a closer bond between the funder and the project owner, which creates a greater sense of loyalty and a better chance of retaining the funder as a potential customer.

There are various different crowdsourcing platforms available, but the most popular and most successful websites are Kickstarter, Indiegogo, and Crowdfunder. There are also more industry-specific crowdfunding websites such as Pledgemusic, which allows fans to contribute money towards their favourite artist to help them fund their next album or music endeavours.


Kickstarter, the biggest crowdfunding platform, was founded in 2009. In 2013 alone, 3 million people pledged $480 million to Kickstarter projects. 19,911 projects were successfully funded, resulting in the development of those products or services that were offered.

There are many projects which have become famous and popular in their own right after being funded on Kickstarter. Pebble – a customizable smartwatch which can connect to one’s iPhone or Android phone – is one of the most successful projects successfully funded by Kickstarter. The project attracted 68,929 backers and raised $10,266,845 out of the $100,000 goal it set. While the project is no longer open on Kickstarter, its enormous success allowed it to grow as a business and offer new and updated models from their website.

What made Kickstarter such an effective and popular platform was its unique business model. Kickstarter adopted an “all or nothing” approach. A project must achieve 100% of its funding goal in order to receive the funds. If a project is unable to reach the goal, the funds are returned to the backers. For every successful project, Kickstarter receives 5% commission. This means that with just the Pebble project alone, Kickstarter received $513,342.25 by simply hosting the project on their website. If the product is distributed on Amazon, Amazon will also take a commission of 2%.

However, Kickstarter – and crowdfunding – has its downsides as well. One of the general misconceptions of crowdfunding is that it is an easier way of obtaining funds. However, backers need to have faith in the product or service that is being offered – their ‘donation’ is essentially a vote of confidence. This means that one can’t just have an idea and post it on Kickstarter – they need to have already invested some of their own money in creating a prototype, videos and pictures to show the public. There is a risk on the backer’s side too: by pledging an amount of money, the backer is risking receiving a delayed, faulty, and/or low quality product that may not reach their expectations.

A committed community is also essential in order to reach the required number of backers. Due to Kickstarter’s “all or nothing” business model, it is imperative that a project receives at least 100% of their goal – else their efforts will have gone to waste. Kickstarter is also purely online. It is difficult to translate the efforts to raise money offline, and offline donations do not count towards the Kickstarter goal.

Overall, crowdfunding opens up many opportunities to small businesses that may not have otherwise been able to raise fund, and generates interest in creative and unique ideas. Crowdfunding, when done correctly, can clearly encourage entrepreneurship and innovation. With any investment, however, there is a risk in something not living up to one’s expectations. One also needs to keep in mind that the more investors, the more people one needs to please.

Additional sources:

Homepage

http://www.investopedia.com/terms/c/crowdfunding.asp

http://www.forbes.com/sites/chancebarnett/2013/05/08/top-10-crowdfunding-sites-for-fundraising/

http://www.forbes.com/sites/geristengel/2014/05/07/crowdfunding-is-more-than-just-the-money-it-helps-you-raise/

https://www.kickstarter.com/year/2013/?ref=footer#6-pebble

http://www.forbes.com/sites/suwcharmananderson/2012/11/30/kickstarter-dream-maker-or-promise-breaker/


Entertainment, South Korea’s Darling Export


Psy

Winter-sonata2imlrm

These images above are some of the most recognizable icons in the South Korean entertainment industry.  The Korean Wave, or hallyu, is still going strong, continuing to shape East Asian culture and trickling to parts of Europe as well. As an outsider, it is easy to ask, “What makes Korean entertainment so great?” What has made this tiny peninsula–divided in half–an Asian entertainment powerhouse?

The success of South Korea’s entertainment industry can be traced back to the Kim Dae Sung Administration in the late 1990s. During this time, the government’s investment in cultural products increased dramatically. One motivation was to strengthen its domestic market against the Japanese cultural products lingering from the colonial days. Another reason was to recover from the crippling Asian Financial Crisis of 1997, when the country’s GDP dropped 7%. In order to reinvigorate the economy and to raise South Korea’s global profile, President Kim put his faith into the entertainment industry, planting the seed of the hallyu phenomenon. In 1998, the Culture Ministry executed its first five-year campaign, including an increase of culture and fine arts departments in colleges. In 2002, the ministry opened the Korea Culture an Content Agency to encourage exports, sparking the beginnings of the Korean Wave, and injected funding into the Korean Film Council. The results were astronomical. The size of South Korea’s entertainment industry, jumped from $8.5 billion in 1999 to $43.5 billion in 2003. Cultural product exports were so insignificant before 1998 that the government could not even provide figures. Five years later, the number would grow to $650 million.

According to a Oxford Economics report titled, “The economic contribution of the film and television industries in South Korea,” the film and television sector have directly contributed 7,749 billion Won to the South Korean GDP in 2011. It has also supported 67,600 jobs and 3,752 billion Won in tax revenues. Average growth of this industry from 2005-2011 has been 10.7%. From this figures, it is clear this industry provides direct support to the country’s economy.

Cultural exports have promoted tourism and business into Korea, particularly from South East Asia. Past work by the Korean International Trade Association (KITA) suggested that Hallyu related tourism amounted to $825 million in 2004. I definitely experienced the impact of hallyu when I visited Seoul for a cultural immersion program. The hot tourist spots were cafes that were themed with a certain popular drama (for instance, the “Coffee Prince Cafe”). There was a statue of the famous lovers from the classic soap opera, Winter Sonata, one of the most successful Korean dramas to date. Many tourists sign up for hallyu-themed tours that take visitors to production sites of famous dramas and films.

hellostranger041

What South Korea ultimately gained from their investment in entertainment was soft power. There have been instances where the government leveraged its cultural exports as means of diplomacy. For instance, the official Korean Overseas Information Service gave airing rights to “Winter Sonata” to Egyptian television. They even paid for Arabic subtitles in hopes of generating positive feelings toward South Korean soldiers stationed in northern Iraq.

Another crucial factor of the Hallyu wave has been the web. There is greater access to content than ever before. Anyone can consume foreign content with the swipe of their phone. Online fan communities were formed to share and distribute Korean content. Youtube channels or content websites like mysoju.tv effectively crowd-source translators, graphics personnel, and coders to recreate original Korean content with subtitles and high quality streams. In 2010, an website turned app called “Viki” was launched by a group of Harvard and Stanford students who aggregated the fan-created content to one platform. According to their website, “Viki, a play on the words video and wiki, is a global TV site powered by a volunteer community of avid fans.”

It seems South Korea’s  investment in entertainment exports was money well spent. I am scheduling a 20-hour binge session of “Alien from Another Planet” after finals as we speak.

mother


Why Aluminum needs to replace Plastic beverage containers and why bottled water is the biggest sin of them all

There’s a lot of debate over how to say the word “aluminum” or is it “aluminium.” I personally believe in the former pronunciation but the latter spelling. But this debate has little consequence. The question that should be asked is: Aluminium is the third most abundant element, why are we wasting petroleum, a non-renewable resource on plastic bottles? There a many much more important industrial and medical uses for plastics that cannot be substituted.

Here’s a brief introduction on the benefits of Aluminum:

–       It has remarkably low density that makes it very light relative to its strength. Ever wonder why Airplanes are made out of aluminum?

–       Living organisms do not metabolize aluminum. It’s everywhere and exposure to it doesn’t affect your health at all – meanwhile if you leave a plastic water bottle in the sun you’re giving yourself a little dose of carcinogens!

–       Re-iterating how healthy it is – Aluminum has an LD50 of 6207 mg/kg which means that to run a 50% risk of dying an adult human would have to eat slightly over one pound of the stuff.

–       Aluminum is way more recyclable than plastic. Actually it’s nearly infinitely recyclable because it’s so easy to separate chemically from other compounds.

–       Aluminum prices have declined over the last 25 years… clearly it’s not being used enough

Aluminum isn’t perfect, nothing ever is. It also would stand to reason that there’s no one-stop solution to sustainability. The problem is over-reliance on one resource. The US Economy is addicted to Oil and Corn, for example.

The thing is consumption of plastic, especially plastic bottles is a really understated problem. Plastic, which is a petroleum product – is causing serious environmental harm, raising toxicity levels in the environment and killing or disfiguring animals, especially birds and marine life. Let’s not even discuss the Pacific Garabage Patch sitting in the Pacific gyre. Even the recent Malaysian Airlines flight disappearance has brought to light how much plastic debris is just floating everywhere in the ocean.

A serious downside of Aluminum is that making it is a fairly high-energy process from Bauxite ore. Critics of Aluminum point to this as being a key reason why plastic is better, especially plastic wrap versus aluminum foil. Except as Slate’s Nina Rastogi points out:

“if you use one piece of foil three times, it will contribute less aquatic toxicity than using three pieces of LDPE [plastic cling wrap], and it just about matches the plastic on fossil-fuel usage and eutrophication. You’d have to use that foil six times, however, before the greenhouse gas emissions and human health impacts were comparable as well.”

Eutrophication is the response aquatic ecosystems have to aritifical materials, especially plastics, being introduced, which is characterized by prolific toxic algae blooms.

Even when it comes to re-usable bottles, steel or aluminum are better options than plastic. Toxins from plastic will always leech into water while the worst that happens with metal is a slight metallic taste but no physiological harm.

When it comes to the disposable bottle versus the can the can is also clearly the better option. According to the EPA the US overall plastics recycling rate is 9 percent, or 2.8 million tons in 2012.[1] This means that some 28.3 million tons of recyclable plastics is put into landfills each year. By comparison to all waste this is a disaster considering that in 2009 Americans recovered 34% of waste generated.[2] By comparison when looking at Aluminum cans: “The U.S. recycling rate for aluminum beverage cans reached 58.1% in 2010- a rate that is more than double that of any other beverage container.”[3]

Because Aluminum is so recyclable it quickly offsets the initial energy cost of making it from virgin ore. Aluminum cans in circulation typically contain 68% recycled aluminum and “twenty recycled cans can be made with the energy needed to produce one can using virgin ore.”[4]

The “Story of Bottled Water” really reveals the problem with plastic water bottles:

Several points are made in the video:

–       We shouldn’t be buying bottled water anyway because tap water is prefectly safe in most places.

–       Tap water typically tastes better than bottled water.

–       Bottled water costs thousands of times more than tap water.

–       The consumption of bottled water relies on an economic principle called manufactured demand. Manufactured demand play on people’s emotions, specifically fear, to create an artificial need for something. A deceptive yet clearly commonplace and accepted practice.

–       The plastic water bottle industry has resulted in the US Government under-investing in tap water infrastructure by $24 billion dollars.

–       The billions of dollars spent on bottled drinking water and cleaning up the mess it causes could be used to address the actual challenge of communities with poor access to water. It could also be spent on making tap water the best water to drink!

So this seems fairly daunting. The evil capitalist machine is going to destroy humanity? No, because we are all individuals living in a society and with free will you can easily do things to change the current predicament:

1)   Boycott bottled drinking water

2)   Reuse the plastic bottles you do buy

3)   Support your local politicians who want to invest in public water infrastructure including treatment, purification and public drinking fountains.

4)   Ask for tap at a restaurant!

5)   Spread the word that Bottled Water is a colossal waste. With social media it’s very easy because you can share an article or a funny comedy sketch.

Students at universities often demonstrate how institutional change can be affected. As a member of USC’s collegiate sailing team I served on the Pacific Coast Collegiate Sailing Conference’s (PCCSC) Executive Board. During my tenure I witnessed the then 24 teams of the PCCSC ban plastic water bottles at regattas. I have done a little bit of math to demonstrate how much a big deal this is.

Let us assume that a team buys two racks of 30 water bottles for a two-day regatta. I would also hazard that the typical PCCSC regatta conservatively has 20 teams attending and the average team sails 10 regattas over the course of an academic year:

2*30*20*10=24’000 plastic water battles

That’s the amount of plastic water bottles reduced just by banning them for college sailing in California, Arizona, and Hawai’i. Make a difference, don’t use plastic water bottles at events your club or organization participates in or hosts.

Imagine now that plastic bottles were banned or made obsolete at a university of tens of thousands of students. Seems unlikely? Think again. Many students have pushed to remove plastic water bottles from their campuses. Most recently students at University of Wisconsin – Fond du Lac began a fundraising effort, not to ban plastic bottles but to encourage re-using plastic water bottles.

They hope to purchase water fountains for the university that are designed to fill water bottles. In other words with a tap style spout rather than your typical up-facing waterspout. By making sustainability easier they are reducing the effort required and making a behavioral appeal for good.


[1] http://www.epa.gov/osw/conserve/materials/plastics.htm

[2] http://www.kab.org/site/PageServer?pagename=recycling_facts_and_stats

[3] http://www.kab.org/site/PageServer?pagename=recycling_facts_and_stats

[4] Idem

What Asian Females Are Looking For When They Watch A TV Show

Just a few days ago, the Wall Street Journal ran a story about how a pair of Jimmy Choo shoes has gone on to become a global best seller after it appeared in a Korean TV show.

jimmy
[ The Jimmy Choo high-heel shoes made headlines after being worn by a leading character in a popular Korean TV show. ]

Korean TV series My Love From the Stars became a hit among Asian female viewers this spring. The story, which talks about a reputed actress’s encountering with a handsome alien guy with supernatural power, diverts little from what a typical Korean soap opera is: faithful love of good-looking couples.

But in the digital era, its commercial value has gone far beyond media coverage and fan meetings. Successful Korean soap operas have prompted the birth of a variety of revenue streams, ranging from sales hike of sponsoring brands to quick turnover of even the knockoffs.

When you have a female leading character whose profession is a star, it makes sense to package her with top-of-the-line fashion garments and accessories — the likes of Burberry, Celine and Lanvin. But when Korean film star Jun Ji-hyun, the actress who plays the role of the female protagonist, changes her outfit more than ten times in just one episode, you’d know how much business potential there is when you have a fad running on screen. The Hermès poncho she wears in episode 15 went out of stock just a few hours after it was broadcasted, and the news went viral on China’s social media. The makeups she uses in the show have gone to the top of Chinese girls’ shopping list.

hermes
[ Hermès poncho: one of the heavily sought after luxury items presented in Korean TV series My Love From the Stars ]

On Taobao.com, China’s biggest e-commerce platform owned by Alibaba, a new industry has emerged, and is now rife with churning out knockoff outfits advertised in TV shows. The moment a Chinese female viewer sees the Hermès poncho and falls for it, private production houses are already on their way to duplicate it at a lower cost. The client would find not just one, but many affordable alternatives within the next few days.

A search on Taobao for outfits from My Love From the Stars would come back with more than tens of thousands of options. The price of a red blazer that comes off its high-end original varies from 100 yuan ($16 dollars) to 700 yuan ($112 dollars), depending on the level of resemblance and the quality of textile. Chinese media reported in February that one of the online stores selling the blazer took in 280,000 yuan ($44,935 dollars) in revenue in just one month from selling 1,450 pieces at about 200 yuan ($32 dollars) each.

Then came the staggering jump in China’s import of Korean beer in March. The figure grew two fold from a year earlier after the combination of fried chicken and beer, a Korean snacking tradition in the show, caught on among Chinese youth. Perhaps Samsung will get some inspiration from this as it wrestles with Apple for the China market.

The Miracle of Corn

Ask the average, everyday American what they think the most important agricultural product the US produces and you might get several answers. Beef, perhaps, given due to the dominance of McDonalds in this country. Soybeans or cotton are also two fair guesses. (Ask the question in California, and you might even get the avocado as your answer.)

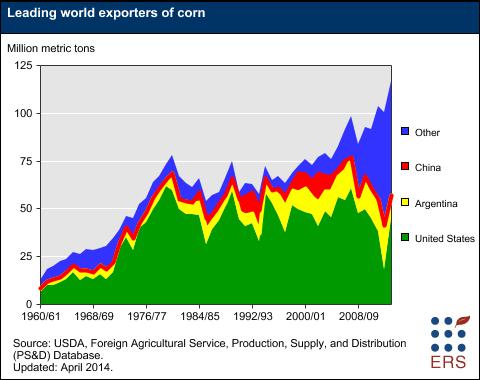
What many people don’t realise is that while the aforementioned products are important, their significance in the economy, in politics and indeed this very society pales in comparison to corn. Corn is the most produced crop in the US, with 84 million acres being dedicated to the harvesting of corn. The cash receipts from sales of corn alone amount to $63.9 billion per year. Indeed, the US produces about 34% of the world’s total corn, by far the largest corn producer and consumer of the world.

corn1

Corn almost literally makes the world go round – at least, in the case of the US. There are about 4,200 uses for corn. For the large part, corn is found in many food products, some medicine, starch, and alcohol. However, corn is also used in the production of plastic, glue, oil, and ethanol – a source of energy. Most of the nation’s livestock is also fed with corn which, in theory, drives down the prices of meat for the American consumer.

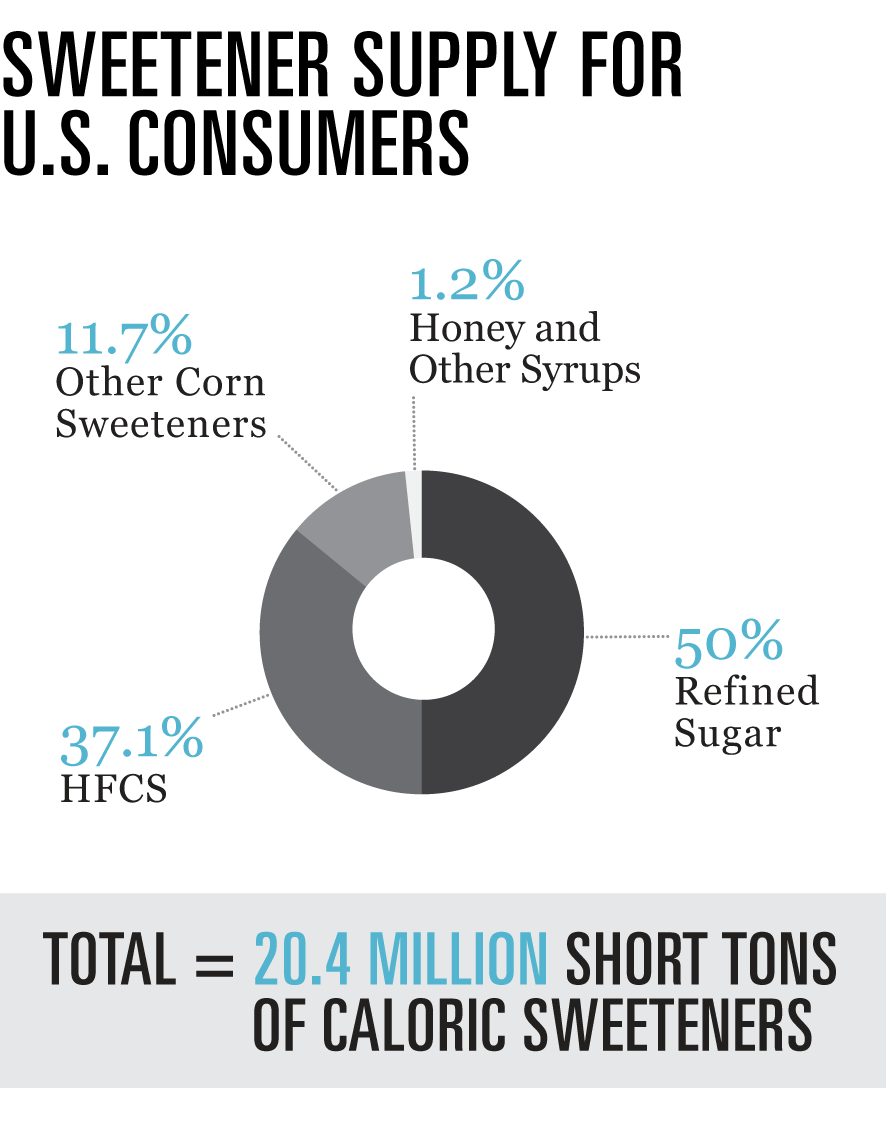
It is hardly a coincidence that the US is also the world’s “largest consumer of sweeteners, including high-fructose corn syrup.” High fructose corn syrup (HFCS) is just one of many uses of corn, and is found in an astoundingly wide array of foods in the US. Here is a list of 10 items that contains HFCS that you may or may not have expected:

  1. Yogurts
  2. Breads
  3. Frozen pizzas
  4. Cereal bars
  5. Cocktail peanuts
  6. Boxed macaroni and cheese
  7. Salad Dressing
  8. Tonic
  9. Applesauce
  10. Canned Fruit

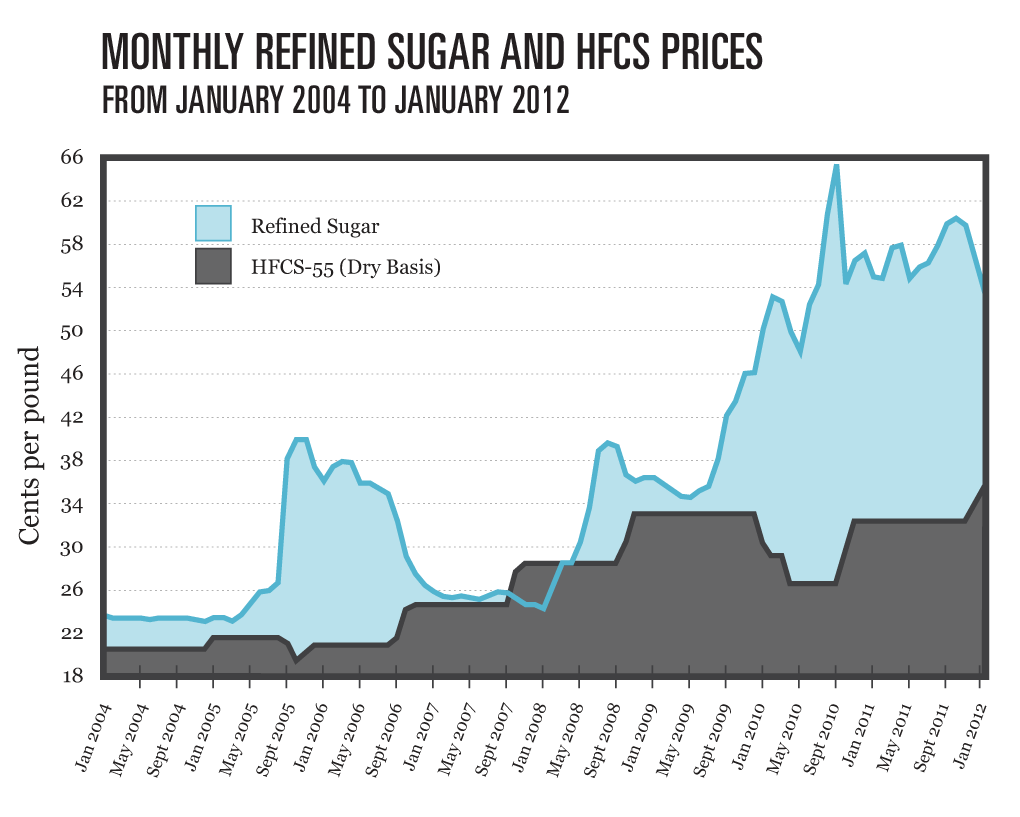
The average American eats 35 pounds of high-fructose corn syrup per year. What is even more alarming is that medical studies have shown that HFCS – especially when consumed in such large quantities – is extremely hazardous to one’s health. First of all, excess consumption of sugar in any form is a leading cause for diabetes and obesity. Due to government farm bill corn subsidies, HFCS can be used as a cheaper, sweater substitute to cane sugar, increasing its presence in food products and therefore our daily intake of sugar.

corn2 corn3


(http://www.cornnaturally.com/economics-of-hfcs/)

Furthermore, despite what corn lobbyists may say, cane sugar and HFCS are not treated in the same way by our bodies. According to the Children’s Hospital Oakland Research Institute, “free fructose from HFCS requires more energy to be absorbed, and soaks up two phosphorous molecules from ATP. This depletes the energy fuel source in our gut required to maintain the integrity of our intestinal lining.” Despite the medical evidence, HFCS continues to be an integral part of our diet – whether we like it or not – due to the high tariffs the US places on imported sugar and the generous subsidies they grant the corn industry.

Corn clearly is an important part of the American economy – but at what price? There are some who argue that relying so heavily on one crop is dangerous; that America should expand and diversify its economy for security and practical reasons. However, the corn’s industry’s hold on US politics, governments, and decision making is strong.

An article by the Washington Post illustrated some examples that the corn industry influences society around us. Researcher and a Harvard-trained cardiologist who runs the Rippe Lifestyle Institute presented “30 peer-reviewed studies showing that there is no nutritional difference between sugar and corn syrup.” His research is not only funded by corn refiners, but he also personally receives a “consulting fee of $500,000 a year from the corn refiners.”

Furthermore, a non-profit group, the Center for Consumer Freedom, launched a television, newspaper and online campaign to defend corn syrup safety. The $3.2 million that funded the non-profit organization came from the corn refiners.

The influence the corn industry has on American politics most clearly manifests itself in the Presidential elections. The Iowa caucuses have historically been extremely important in the nominating process for the President of the United States. Since 1972, Iowa has been the first major electoral event, and serves as an early indication of which candidates will be successful in receiving the nomination of their political party in order to run for presidency.  Ethanol production consumes about 1/3 of Iowa’s corn production. Historically, presidential nominees have to support the ethanol production industry in order to win Iowa – and therefore even stand a chance of winning the election.

Whether we realise it or not, corn is around us. Who knew such a simple crop would have such a significant impact on our meals but the very economy, society and political environment we live in?


Additional Sources:

http://www.mercola.com/Downloads/bonus/danger-of-corn-syrup/report.aspx

http://www.huffingtonpost.com/2012/09/04/corn-syrup-foods-high-fructose-_n_1854790.html

http://www.economist.com/node/21562912

http://www.washingtonpost.com/wp-dyn/content/article/2007/03/23/AR2007032301625_2.html

http://www.ers.usda.gov/topics/crops/corn/trade.aspx#.U2tEyvmICSo

http://www.economist.com/node/16220592


The struggle against textbook prices

It is no surprise that the price of college tuition has increased dramatically over the last few years. With the Great Recession, many public colleges suffered from a severe cut in funding from their respective states. Prices were hiked, followed quickly by a rise in tuition in private colleges. Unfortunately, however, tuition prices are just the first thing that students have to worry about. Other college related expenses – housing, food, and transportation for example – have also seen drastic increases in prices. What is most alarming, however, is the dramatic increase in textbook prices.

Technological advancements in the last decade have allowed for new ways for students to obtain textbooks such as the advent of e-books, online retailers, textbook rental services, and free textbook databases. Furthermore, there have been initiatives taken by the government on both the state and federal level to combat textbook prices such as the American Recovery and Reinvestment Act. Despite all of this, however, textbook prices continue to rise. What is the main cause for increasing textbook prices? What sort of disruptions – if any – is the textbook industry seeing, and how is that affecting them?

BRIEF OVERVIEW OF THE TEXTBOOK INDUSTRY

 1

Historically, textbooks in the US have been high – and prices of textbooks have only risen over the last 30 years. According to a study conducted by The American Enterprise Institute’s Mark Perry, the prices of college textbooks in 2013 have increased 812% since 1977. (In comparison, the Consumer Price Index – a standard measure for inflation – has increased by 250%). In fact, the rate at which textbook prices have increased is higher than all other expenses related to college – including college tuition. The Bureau of Labour Statistics reported that from 2006 to 2011, the cost of textbooks increased by 38.6% while the cost of tuition had increased by 32.2%.

2


Rising textbook prices – along with rising tuition costs – have long been a concern. According to the National Association of College Stores (NACS), students spent an average of $370 on course materials during the fall 2013 term. Furthermore, “40.6% of students said they usually pay for course materials with grants, scholarships and student loans during the fall 2013 term. Financial assistance covered, on average, 57% of the costs of the course materials for those students.”

However, in a survey conducted by the U.S. Public Interest Research Group, “7/10 students stated that they had not purchased a textbook at least once because the price was too high.” A significant percentage of students receive financial aid or student loans – however it is evident that this aid is not nearly adequate enough to cover the full cost of college – both tuition and textbooks. The gap between the cost of textbooks and the amount of aid a student receives and subsequently, their ability to afford the textbooks is steadily increasing.

BREAKDOWN OF A COLLEGE TEXTBOOK: WHERE IS YOUR MONEY GOING?

3

There are several reasons that help explain the expensive nature of textbooks. First of all, printing and publishing any book is a hugely expensive process. Textbooks require many additional costs compared to a novel, for example. Textbooks deal with highly specialized material. The content of any textbook is often the result of extensive academic research that also needs to be constantly updated in subsequent editions. Furthermore, many textbooks have multiple authors – all of whom the publisher needs to pay a copyright fee to. This fee is increased exponentially in textbooks like literature anthologies which contain the works of dozens of different authors.

Textbooks also often come with supplementary materials – online-access codes, DVDs, or subscriptions – the costs of which are bundled in the cost of the book itself. Furthermore, traditional brick-and-mortar bookstores (such as the ever-present college bookstore) can be expensive to run. Rent, utilities, shipping in the supplies and salaries are just a few of the costs that bookstore owners have to worry about. It is no surprise that these costs often trickle down for the consumer to pay in the form of a more expensive textbook.

NACS reported that, on average, new textbooks in college bookstores are sold with a margin of 21.1% (the average difference between the cost price and the retail price of a textbook) After all expenses have been paid, “a college store makes less than 4 cents on every dollar’s worth of new textbooks sold.” For the majority of cases, this money goes back to the school in order to pay for financial aid, scholarships, and student programs.

If the profit margins for college bookstores are so small, then it clearly must be the publishers or the authors who are reaping the benefits of soaring textbook prices. The textbook industry is highly oligopolistic in nature. As mentioned previously, the subject material in textbooks are highly specialized and require extensive research; as a result, there are substantially fewer options when choosing a textbook in a specific field of study as opposed to a novel of a particular genre. Furthermore, there are often no alternatives offered to a textbook which is assigned for a class – the student may opt out of buying a book but at the cost of their grades: Nicole Allen, program director for the Scholarly Publishing Academic Resources Coalition, an alliance of academic libraries noted that “Publishers have been able to drive up textbook prices because students “have to buy whatever textbook they’ve been assigned.” As is the case with any other scarce good, when demand exceeds supply, the prices of the good increases.

5 4


The actual textbook industry is dominated heavily by just a few players. According to a report conducted by the Council of Economic Advisers at the Whitehouse, there are just three companies which almost completely control the textbook publishing industry: Pearson, McGraw Hill, and Houghton-Mifflin. Between the three companies (including smaller companies that they own), they control over 85% of the textbook market. In 2013, for example, Pearson reported £5,690 million in sales and £736 million in adjusted operating profits. The North American Education division was responsible for the vast majority of these figures. In sales, the North American Education division reported £2,779 million, and in profits £406 million – accounting for 55% of Pearson’s overall profits. In addition, McGraw-Hill’s profit margin was 25% in 2012.

6

Despite these impressive figures, these companies are actually showing some struggles in maintaining – let alone improving – profits in the educational sector. In February 2014, The Wall Street Journal reported that Pearson “issued a profit warning amid continuing weakness in its core U.S. education business.” The metric for North American education “fell 24%.”

According to Chief Executive John Fallon, “Our biggest business, North America, is facing the most difficult trading conditions in a decade.” The company blamed the tumultuous education sector in the U.S. as well as the “short but difficult transition” its business faced as it transitioned from print to digital.

Clearly, traditional textbook publishing companies are feeling pressure from the new technological age and various alternative methods of textbooks. But what are these alternate methods, and how popular are they among students and professors?

ALTERNATIVE METHODS

Surprisingly, the most disruptive force in the textbook industry is not the e-book, but the market for used textbooks and textbook rentals. This doesn’t mean that the digital market is not significant, however. According to Forbes, e-book sales make almost a quarter of all consumer book sales. Digital textbooks – especially in K-12 – have slowly become more accepted and more widely adopted by schools, with more than “20% of all schools saying they now use digital textbooks and another 37% saying they will within the next five years.”

Recognizing the gradual and inevitable shift to digital textbooks, in 2012, Pearson, McGraw-Hill and Houghton Mifflin Harcourt announced that they would be partnering with Apple to include textbooks in Apple’s ‘iBookstore.’ These e-books would not be merely digital versions of the analogue version; instead, the textbooks will be designed to be interactive and multimedia to utilise features that the iPad offers and create a different learning experience.

However, these statistics do not directly translate to college. According to a study conducted by the research firm Student Monitor, only “2% of college students surveyed said they bought all of their textbooks in digital form, and only 14% said that they had classes that required online texts.” The NACS reported that “e-textbooks made up only 2.8 percent of total U.S. textbook sales in 2010.” Furthermore, a study conducted by the non-profit arm of the Pearson Foundation showed that “55% of students still prefer print over digital textbooks.”

There are several factors which account for college students’ ambivalent feelings towards e-books. Many students who were surveyed stated that they preferred the hard-copy so that they could highlight passages and take notes in the margins (features which are available in many e-books.) Most importantly, however, was that e-books are not significantly cheaper than the print copy. Forbes investigated the differences in the prices of textbooks using the example of “Chemistry” published by Brooks/Cole. According to Forbes, “the new book costs $205. For a used copy you’ll pay somewhat less than $155, and be prepared to fork over $167 for the digital version.” Renting the book however, costs a mere $65.

The internet has been instrumental in facilitating the growth of the textbook rental industry. For one, the internet allows students to easily search and compare prices for textbooks. Several key players such as Amazon, Chegg, and TextbookRentals offer textbooks for rent at a substantially lower cost than buying digital or used versions of the books. NACS reported that students can expect to save between 35% – 55% when renting a textbook, and that about 3,000 campus bookstores now also offer this service (albeit at a higher cost) The vast amount of online retailers also enable students to easily sell and buy used textbooks from each other, further undermining the profits of the publishing companies.

The textbook rental industry is clearly growing. While they charge students a significantly lower price compared to buying a textbook outright, the cost still adds up. There are several initiatives that aim to absolutely minimize the cost to students and relieve some of their financial burden.

NON-PROFIT AND GOVERNMENT INITIATIVES

 7

Boundless, based in Boston, Massachusetts, is a company which creates both free and inexpensive textbooks and distributes them solely online. Boundless has online textbooks in over 20 college level subjects, and offers these books for free. Paying $19.99 will get you the premium service, which includes “interactive study materials for each subject, including flashcards, quizzes, and summarization to help students retain information. It will also give students access to enhanced content and the native mobile apps.”

They also recently released 18 textbooks under the Creative Commons Attribution-ShareAlike (the same license used by Wikipedia.) This will allow students and professors to use, change, and share the textbooks for free. Other similar initiatives include Flat World Knowledge, OpenStax College, and Bookboon.

The Michelson Twenty Million Minds Foundation supports “non-profit initiatives, for-profit start-ups, and policy thought leaders that utilize disruptive digital technologies to create a “higher education 3.0” system that can sustainably increase access, affordability, and student success.”” They provide free textbooks on a limited range of subjects, as well as a search engine to find the cheapest new, used, digital and rental textbooks online. Other non-profit organizations which fund similar initiatives include The Bill and Melinda Gates Foundation, The William and Flora Hewlett Foundation, and the Laura and John Arnold Foundation.

The idea of creating a database of free, open and high quality textbooks have also been supported by the government. In 2012, Gov. Jerry Brown signed legislation which would “fund the creation by California universities of 50 open textbooks targeted to lower-division courses.” The textbooks would be hosted by the California Digital open Source Library, with the California Open Education Resources Council overseeing the book approval process. The books would be free to download or a physical copy could be purchased for $20. Similar initiatives have been made in Utah, Florida, Main and Washington State.

In November, 2013, Senators Durbin and Franken introduced “The Affordable College Textbook Act.” This piece of legislation would “authorize the Secretary of Education to make grants to institutions of higher education to support pilot programs that expand the use of open textbooks in order to achieve savings for students.” The main goals of the act are to help “achieve the highest level of savings for students, expand the use of open textbooks at other IHEs, and produce open textbooks that are of the highest quality.” Unsurprisingly, such initiatives have been met with some resistance from the major publishing companies who claim that these actions interfere with the free market.

FUTURE OF THE TEXTBOOK INDUSTRY?

It is clear that textbooks will remain an integral part of a college education, despite the rising costs. Unfortunately, the mind-set of today that “everyone should have and deserves a college education” has justified these skyrocketing prices. However, the textbook industry is shifting. The initiatives to cut the costs of textbooks are still fairly recent, and its effects haven’t been fully realised yet. The continued rise of textbook prices suggests some sort of bubble; the intrinsic value of a textbook has not increased, so the prices must be a reflection on a tumultuous industry. It is possible that in the future, textbooks will be free or a minimal cost to a student’s education – or that textbooks will settle at a constant yet expensive price. In any case, if textbooks and indeed tuition continues to increase at the same rate at which it has over the last few years, it is not clear whether the investment in one’s education remains a sound and smart choice.

Bitcoin: the future of currency?

spending-bitcoins


It’s an interesting fact of life that we often take money for granted. While it is true that “money makes the world go around” (and is constantly the source of both misery and happiness for us), the concept of what money is and what it represented is not questioned. In the United States, we rarely consider the value of money and our currency in relation to others’. These are the sorts of issues that the government, currency traders, and corporations worry about – not the everyday citizen. However, what happens when these assumptions are challenged? What happens when the value of our currency can’t be protected or backed by our government?

This is just one of many questions which have been brought up in the wake of the advent of Bitcoin. Bitcoin is a relatively new form of currency that was created in 2009 by Satoshi Nakamoto (an alias created to disguise true identity of the individual(s)). Bitcoin is a unique form currency in many ways.

First of all, Bitcoin is an electronic form of currency. This means that one bitcoin can be split into almost infinitely smaller pieces, allowing people to spend just part of a bitcoin like they may spend part of a dollar in form of quarters or dimes. Bitcoins are stored in one’s secure wallet which has a unique address similar to a bank account number: disclosing the unique address to someone allows you to pay them or vice versa. Every legitimate transaction is kept on record on a public ledger called the ‘block chain.’ Each Bitcoin wallet involved in the transaction also ‘signs’ the transaction in order to prove that the transaction was approved by both parties and is coming from the owner of the wallet.

Bitcoin it also decentralised – there is no central bank or government that backs the value of bitcoin. In the U.S., for example, the U.S. Federal Reserve decides how much money should be circulating within the economy via interest rates in order to control inflation. Bitcoin, on the other hand, uses peer-to-peer technology in order to “operate with no central authority or banks; managing transactions and the issuing of bitcoins is carried out collectively by the network.” This implies that Bitcoin is a more democratic form of currency, whose value is dictated completely by the market and how much people are willing to pay for Bitcoins.

Because Bitcoin lacks a central authority to both regulate and provide the source of the money, the way in which bitcoins are created is also different. Bitcoins are created through the process of ‘mining’ – like how one might mine for precious metals. However in this case, miners use powerful computers in order to solve extremely complex computer algorithms. Upon solving these algorithms, the miner is rewarded with bitcoins. More specifically, bitcoin mining is the process of verifying bitcoin transactions.

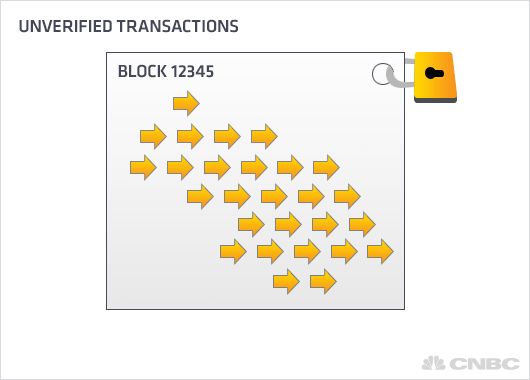
As mentioned previously, every bitcoin transaction is verified and encrypted so that others cannot undermine the integrity of the transaction by changing its details (time, amount, etc.) Since there are many transactions that happen every minute, transactions are compiled together in a box which is secured with an electronic padlock – “block chains.” Miners run software on their computers which attempt to open the padlock. Once the padlock is open, the miner is rewarded with bitcoins. According to blockchain.info, the average number of attempts it takes to unlock a block chain is 1,789,546,951.05. With a GTX 680 GPU and at the current difficulty level, a single miner can expect to mine one bitcoin in 98 years.

Because bitcoins are ‘mined,’ there are is a finite number of bitcoins available. The code that was written ensures that there will be 21 million bitcoins available. Today, there are more than 12 million bitcoins in circulation. The fewer the bitcoins are to be mined, the harder and more complex mining becomes, decreasing the rate at which bitcoins are mined. Currently, the a maximum of 25 bitcoins are able to be mined every ten minutes.


block


Bitcoin is an attempt to address many of the flaws present in a traditional form of currency. Much like cash, using bitcoin is almost completely anonymous. One never has to disclose their credit card details, name or identity in a bitcoin transaction, so long as their bitcoin address is valid. There are also no required transaction fees or foreign exchange fees when using bitcoins. For larger transactions – where one may gather bitcoins from multiple addresses – a transaction fee is usually expected but still not mandatory. There is an incentive to pay and charge transaction fees, however; bitcoin miners who validate the transaction are the ones who receive the transaction fee. Paying a transaction fee is “an incentive on the part of the bitcoin user to make sure that a particular transaction will get included into the next block which is generated.”

However the advent of Bitcoin has also raised significant concerns and highlighted some controversy. Due to the relative anonymity Bitcoin provides, there are some who use Bitcoin to conduct malignant operations and purchase illegal goods such as drugs. The U.S. for example, has researched heavily into Bitcoin and has illustrated its concerns over the potential terrorist threat Bitcoin poses: “The introduction of virtual currency will likely shape threat finance by increasing the opaqueness, transactional velocity, and overall efficiencies of terrorist attacks.”

However, the U.S. is not alone in these concerns. Due to Bitcoin’s connection with illicit activities, Russia has banned the use of Bitcoin: “Systems for anonymous payments and cyber currencies that have gained considerable circulation — including the most well-known, Bitcoin — are money substitutes and cannot be used by individuals or legal entities.” Furthermore, Russia had emphasized that the Rouble is to remain Russia’s only official currency, and that any introduction of other currencies or other monetary units would be illegal.

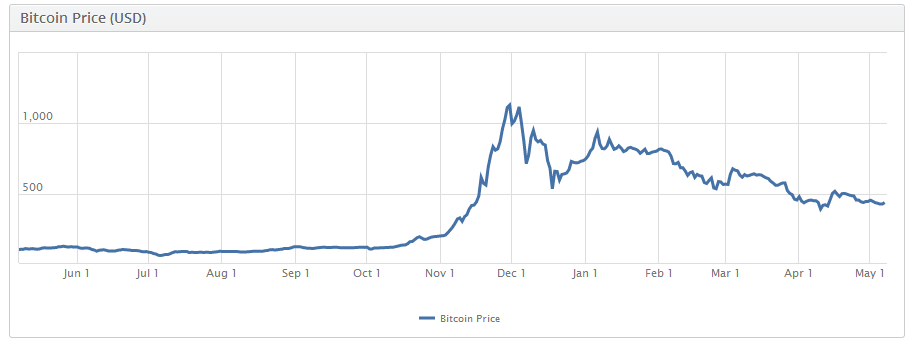
Because Bitcoin’s value at this point is completely on of public perception, it is an extremely volatile form of currency. While the lack of a central authority controlling its value means that political instability or corruption won’t affect its value, it also means that there is no force that is able to stabilize its value. In October, 2013, one bitcoin was valued at about $126 USD. Just one month later, the value skyrocketed to almost $1010 USD. In April, 2014 the value dropped back down to $420 USD. The extreme volatility of the currency is a serious cause of concern for many, preventing Bitcoin from being a universally accepted currency. Bitcoin is accepted by a few online merchants as well as select businesses and individuals around the world (mostly in Europe.)

Bitcoin remains a complex, innovative and experimental form of currency. While there have been variations of Bitcoin (such as Lightcoin and Dogecoin), its feasibility as a widely accepted form of money has yet to be tested.


Sources: 

https://en.bitcoin.it/wiki/Mining_hardware_comparison

http://www.pcworld.com/article/2151261/beginners-guide-to-mining-litecoin-dogecoin-and-other-bitcoin-variants.html

http://www.huffingtonpost.ca/2014/01/26/what-is-bitcoin_n_4661604.html

http://www.reuters.com/article/2014/02/25/us-bitcoin-mtgox-factbox-idUSBREA1O21M20140225

http://money.cnn.com/infographic/technology/what-is-bitcoin/

https://bitcoin.org/en/faq#what-is-bitcoin

https://bitcoin.org/en/how-it-works

https://coinbase.com/charts

http://www.theverge.com/2014/2/9/5395050/russia-bans-bitcoin

Futbol vs. Soccer: Comparing the American and European Transfer Market

Kaká has sadly been left out of Brazil’s roster for the upcoming 2014 World Cup but he still very much on the list of prospective players to move to the MLS later on this summer. Along with the AC Milan midfielder, Anderlecht midfielder Sacha Kljestan’s name was “tossed around the rumor mill” according to a Fox Sports article.

Many successful international players have migrated from the European league to Major League Soccer. David Beckham had a great run with the Los Angeles Galaxy. Theiry Henry is still enjoying his time with the New York Red Bulls.

The European soccer season is slowly coming to an end, and with the attention slowly turning to the American soccer league (leaving out the World Cup from this discussion), now is the best time to compare the two leagues and how both handle their transfer windows.

The European Transfer Market

The common rationality for any transfer window is that Team A offers a certain amount for a specific player, the player’s current team (Team B) negotiates the prices offered, negotiations reach a certain agreement and finally Team A obtains the player that they desired.

It’s simple, right? Not quite.

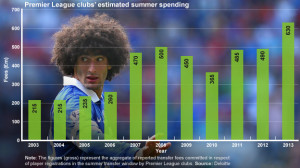
The European transfer market is one of the most expensive markets in the world, millions of Euros are exchanged every season.  Speculations influence transfers; dozens of media stories being released on who might be sold, sports analysts doing multiple segments on the subject and now, social media users voice their opinions on which players are the best fit for their teams. _69617549_030913_grosstransfergraph_624

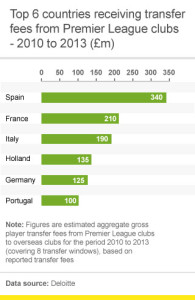
But aside from speculation is the freedom that the European leagues offer. For one, there is no salary cap. Teams can spend as much money as they want on the player and resources of their choice.  Back in 2003, Roman Abramovich bought Chelsea and took over west London with his one billion euro investment. This sort of “big money” is not just seen in the English league, but in Spanish and Italian leagues as well. _69617552_030913_top6countries_320x490

The other factor is the contingency that allows players to leave their clubs at any time—before, during or after the transfer window—and the club is responsible for making those arrangements happen. The most recent example of this was when Juan Mata, unhappy with Chelsea, was able to leave and be traded to Manchester United for 37.1 million Euros.

While this trade still occurred during the time of the transfer window, it does prove a point when it comes to the freedom that players, even big commodities such as Juan Mata, have when it comes to playing for the teams of their choice.

But as previously mentioned, players are able to leave regardless of the “boundaries” that the transfer window claims to have.

As the English Premiere League website states:

There are two transfer windows in each Barclays Premier League season.

The first commences at midnight on the last day of the season and ends on 31 August if a working day – or, if not, on the first working day thereafter, at a time determined by the Board.

The second transfer window commences at midnight on the 31 December and ends on the 31 January if a working day, and again, if not, on the first working day thereafter, at a time determined by the Board.

Temporary transfers can be made permanent outside of the transfer windows. For further information please see the rules in the Premier League Handbook.

This, also, is the same framework used in other European soccer leagues.


The Dilemma

As the rule with materialistic items is “the more exotic, the more expensive” the same rule is somewhat used when it comes to soccer players. Soccer players prices are based on one thing more than anything: location, location, location—in this case, where they were born (or what country they decided to nationalize themselves in). Neymar is a great example of this. His performance as a player was impressive but him being Brazilian was what made him that much more valuable. South American players are a big commodity as well as European players, but there is hardly demand for players from Canada or even Russia.

Country of origin is not the only thing that defines a player’s value but there is also the factor of what club owns the player. Continuing with Neymar, he started his career off playing with Santos FC  in Brazil. If he had decided to continue there, his value as a player would not have been as significant. The level he had and the competition he played against also play into this as well (performance being the third factor). So when Barcelona FC (one of the top teams in the Spanish league) purchased him, his value as a player soared through the roof.

While Neymar’s stories is a “Cinderella story” that is continuously seen not just in soccer, but in sports in general, these factors are what create a giant gap between different nations and clubs. The role that the transfer market plays creates a hierarchy of clubs that will always be at the top of the table that the “poorer” clubs will never be able to catch up to. Note: it is important to mention that performance for clubs has nothing to do with the system per se. Even though Manchester United did horrible doing this season in the Premiere League, they are still one of the richest teams in the EPL and will continue to stay in that position.

Continuing with the Neymar example, there is no regulation on the amount of money that is being spent. This led to Barcelona sparking a media frenzy regarding the purchase of Neymar.


American Soccer Transfer Market

The transfer window for Major League Soccer (MLS) works a bit differently than Europe’s.

For one, MLS works as a close league and not the European open league. Players are not able to leave clubs when they please and to even the playing field more and avoid this gap of rich and poor clubs, there is a draft is held around the time of the two transfer windows that occur during mid-February and another that opens on July 8th. Teams’ position in the draft is based on: their performance and what the standing was in the previous season.

As with other American sports, the highest pick goes to the worst performing team and the best teams find their slot at the very bottom. These teams draft in rounds, which goes from #1 to however many rounds indicated.

This allows for something that occurs in the MLS draft that does not appear in the European market at all—the role of trading draft picks. So, a team somewhere towards the bottom can trade their pick in the draft with a team that is a little higher up.

Another difference between the European transfer market and the MLS is the salary cap. As the MLS “Roster Rules and Regulations” states:

  • Players occupying roster spots 1-20 count against the club’s 2014 salary budget of $3,100,000, and are referred to collectively as the club’s Salary Budget Players.
  • Roster spots 19 and 20 are not required to be filled, and teams may spread their salary budget across only 18 Salary Budget Players.  A minimum salary budget charge will be imputed against a team’s salary budget for each unfilled senior roster slot below 18.
  • The maximum budget charge for a single player is $387,500.*

* See section entitled Allocation Money below, under Player Acquisition Mechanisms, for details on buying down a player’s budget charge.

As one can see, there is a budget that is upheld within the MLS; there is accountability for each player and how much can go when it comes to salary. That is not seen in European (as is evidence with the large amount of money that soccer stars such as Messi and Cristiano Ronaldo are paid).

The MLS looks to have a more even playing field and does so by regulating all aspects of the transfer window. This also helps to create greater competition for teams, regardless of how much money they have, because they have a better chance of obtaining a good player.


The Dilemma

The dilemma with the American transfer window is the role of politics. Players are not given as much freedom as there is in the European market when it comes to where and when players want to play. Though there is a disparity in income with European players, American players have very strict contracts with their teams that are often too expensive for any team to simply pay off to get that specific player.

As is noted:

  • A Team may buy out one (1) guaranteed player (including a DP’s) contract during the off-season and free up the corresponding budget space. Such a buyout is at the particular MLS Team’s own expense.
  • A Team may not free up budget space with a buyout of a player’s salary budget charge during the season. Such a buyout will be conducted by the League and count on a Club’s budget in a manner consistent with current MLS guidelines.

As with anything, is a very strict, orderly procedure that takes place for the buyout to even occur.

Nothing happens outside the transfer window that is not seriously examined for a long time.


Conclusion

Both the European and the American soccer transfer markets have their flaws. One seems to have a very free and open place that creates disparity while the other seems too strict to even try to mention the word “freedom.” What is important to note though is the simple question about the love of the game. The American soccer league is very strict about making sure they make a profit or do not spend any more than they have to  to avoid a deficit. However, what is important to note about the European market is this lack of salary cap that allows for people to waste so much without a worry; they simply do it for “the love of game.” Going back to Roman Abramovich and his purchase of Chelsea, economically it is seen as a bad investment. But from a pride standpoint, the investment was definitely worth it (it brought a Champions League Cup, two League Cups and two FA Cup wins).

So whether you enjoy soccer from an economic standpoint or for the love of the game, both have their flaws but both also have their benefits.

Rise of Digital Consumption Disrupts the Audience Measurement Business

In November 2013, Business Insider CEO Henry Bodget made a compelling presentation analyzing the state of media in the tech space. The findings were from Business Insider’s new research arm, BI Intelligence. The report created waves in the tech industry. In a matter of two days after the reports’ release, it had over 900,000 views.

There were many insightful slides that demonstrated the current digital realm.  However, one slide especially caught the eye of media leaders.

“Digital is now bigger than TV.”

Although a very contested claim, recent years have indicated that digital is causing a major disruption in the media business. In his slideshow, Bodget echoed the industry’s standard rule: money follows eyeballs. Until recent years, “eyeballs” were monetized through a rating system called GRP, invented by Nielsen. However, this method only worked wonders when our eyeballs had one screen: television. Today, we have tablets, smartphones, and desktops. We are constantly consuming and content is becoming available across all of these exhibition windows. The chart above indicate that “eyeballs” are moving to digital, and people want to know how to measure this revolution, and so far, GRPs aren’t cutting it. The rise of digital is shaking up the longstanding media metrics system, and everyone is keeping an eye on the digital ratings race.

Metrics as Currency

In his book, Audience Economics: Media Institutions and the Audience Marketplace, Phillip Napoli refers to audience measurement organizations as one of the four principal actor–along with media organizations, advertisers, and consumers–in the market for audience product. All services are interrelated and depend on eachother to survive.

Audience measurement organizations seek to provide quantitative data on audience viewership. In other words, they are in charge of monetizing attention. The value of a media product, whether it is a sitcom or an article, depends on the audience exposure, or ratings. How many people are watching? How many people are paying attention? Napoli says audience data functions as the “coin of exchange” in the audience marketplace, and it is the currency that media organizations use to sell, and the advertisers use to buy.

The rise of digital advertising has created a ripple effect in the media industry. The industry understands digital ad spending will eventually overtake television; it’s only a matter of time. However, there is also one giant obstacle in the way of this digital takeover–Nielsen.

Nielsen 

Picture 12

Nielsen is the undisputed king in the media metrics business. Founded in 1923, the 91-year-old company had revenues of $5.5 billion in 2011. During the TV era, Nielsen dominated the audience measurement industry. Nielsen’s monopoly has been a double edged sword. On one hand, having one audience measurement system eliminates complication and uncertainty. If there were multiple ways to measure, more resources would have to be put in media companies and agencies. If CBS used one method of audience measurement but Viacom used another, and a big client like Proctor and Gamble wanted to advertise on both, media agencies would have to juggle the different numbers and invest in new systems, making it immensely difficult and confusing.

However, on the other hand, because Nielsen is a monopoly, it gets to name its price without competition. Last summer, I had the amazing opportunity to be an IRTS (International Radio and Television Society) fellow, a media scholarship program that funds a select group of students to pursue a media internship in New York City. I got to attend a week-long “media bootcamp,” where we visited major media companies that included broadcasting, cable, digital, etc. In multiple panels, industry leaders complained about Nielsen’s monopoly over the metrics industry. Nielsen has been criticized to be slow in responding to rapid industry changes. Les Moonves, the CEO of CBS, is one of many industry executives who advocated for a better rating system. He pushed Nielsen and the media industry to accept the C7 metric rather than the C3, as the introduction of DVRs (digital video recorders) has allowed audiences to watch their favorite shows later in the week. While speaking to investors at a Deutsche Bank media confab in March 2013, Moonves expressed his frustrations when he said, “All we want is a fair measurement—we want Nielsen to measure everybody, and ultimately, we want an eyeball to count as an eyeball no matter where you watch your television shows.” CEO of Viacom, Phillip Dauman, also echoed Moonves’s frustration in an Economist interview when he said measurement is the “number one issue for television right now.”

How Ratings Work

There are a dizzying amount of terms to know in the media industry. CPMs, GRPs, LPMS, PPC, PPM, and the list goes painfully long. Ad Buyers stare at these numbers every day to allocate their clients’ media budgets; the ultimate goal is to reach as many people as possible for the lowest price. Just to give you a snippet of how the current rating system works, here is a ratings report for this Monday (5/5/2014).

Screen shot 2014-05-06 at 9.50.48 PM.png

I know, there are a lot of numbers on here. When I was interning at a major broadcast network in the ad sales division, a huge stack of these reports were delivered to our desks each week. The numbers on the columns determined the value of our product. Without going into too much detail, ratings on a sheet like this indicates the Nielsen ratings point system. One ratings point = 1% of the Nielsen estimate for the category being measured. On the chart above, the categories, or the target demographics, are 18-49 year-old viewers. LIVE+SD indicates the number of viewers that watched a program either while it was broadcast or watched via DVR on the same day.

Of course, there are so many questions that are unanswered by these numbers alone. What about Hulu? What about all the binge-watching of 30 Rock I did on Netflix last weekend? What about how much I actually like the show or paid attention to it? Nielsen has yet to come up with a satisfying answer, causing buyers to turn to new players.

The Digital Wave and its New Players

Now that the digital revolution is disrupting the media space, allowing more viewers to consume online, the media community is applying greater pressure on Nielsen to keep up with the trends. Although Nielsen traditionally monopolized almost every aspect of the media industry, it seems that the increased demand for digital measurement systems have introduced new challengers. Today, the digital audience measurement sector is the most vibrant and competitive sector in the metrics market.

Picture 10.png

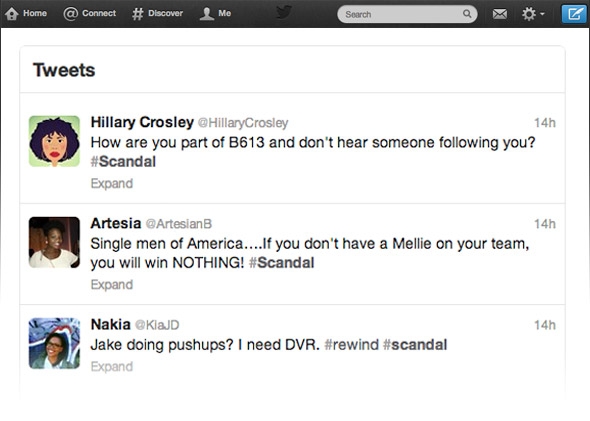
As Nielsen is already the established leader is measuring “eyeballs,” majority of these agencies have focused on the question of audience engagement–how audiences feel, respond, and interact with content. For instance, a client may seek to reach the coveted 18-49 audience, but the viewing experience of Mad Men on cable versus Huffpost Live on digital stream is vastly different. Social media has been the answer for many stakeholders who seek to gain this information (partly because Nielsen does not provide it). In his 2012 TWC research report, Napoli talks about the new players in market and their varying methods. Digital measurement companies like Bluefin, now owned by Twitter, engage in a new metric model depending on information gathered  from “web scraping.”

#Scandal Twitter Convos

#Scandal Twitter Convos

“Web scraping” is a common method used by social media analytics services, and it involves aggregating comments posted on social media platforms and using sophisticated algorithms to measure the popularity or sentiment of a show. These measurements derived from online conversations go beyond television consumption to include the consumer’s buying behavior and affinities. Another advantage of this method is that unlike Nielsen, which has a set measurement sample, information can be extracted from anyone who participates in the web.

However, Napoli points out that these digital measurements do not try to stray too far from traditional methods. For instance, Trendrr.tv offers a “share of voice” metric, representing the share of all television-focused social mid activity attributed to a network or a show in a specific time period. Bluefin Labs showcases a “response share” metric that measures a program’s share of the online television conversation at the time the program aired. Other applications like Getglue or Viggle depend on the “check-in” method, measuring digital activity on second screens like computer or mobile phones.

So far, there is no “one-size-fits-all” rating system for social media activity. Some analytics firms focus on a programs’ market share in a weekly or monthly basis while others focus on individual days. One major challenge of these new technologies is that their measuring process is not transparent. One reason for its secrecy is to protect its patents from competitors, but this creates a black box effect that drives ad buyers crazy. Again, the cost of having multiple players in the metrics marketplace is confusion and inconsistency.

Nielsen Strikes Back

Nielsen is trying to meet these new threats by introducing weapons of its own. Check out this cover of their latest yearly report.

Screen shot 2014-05-06 at 8.27.14 PM.png

Notice anything?

No television in sight.

Nielsen is no fool. The company understands industry trends and it is trying hard to keep up. Last year, it released a new product called “Digital Program Ratings,” recruiting big name partners like NBC, Fox, ABC, AOL, CBS, Univision, Discovery and A+E to participate in the test run. The product will mainly track the network’s desktop websites with plans to integrate mobile in the future. This release follows the company’s introduction of the Twitter TV Ratings system, a measurement of pure social activity. Nielsen also acquired Arbitron for $1.3 billion in December 2012, swallowing its rival with expertise in measuring mobile content.

Despite its shortcomings, Nielsen is still the undeniable leader in its industry. Despite initial reluctance, Google began a partnership with Nielsen in testing ad campaigns on Youtube using OCR (online campaign ratings) deals with select clients. It is a win for Nielsen and a smart move by Google. The search engine giant understand the major ad spenders have a longstanding relationship with Nielsen, and if it wants to gain their trust, they have to use a credentialed third party entity.

What About the Ad Buyers? 

Dubbed as “promiscuous consumption,” Millennials are consuming content through search, social, online video, mobile, and television. Ad Buyers are adjusting their buying habits in response to these new trends as well. Since 2010, ad spending on the internet saw the greatest change with a 7.5% increase.

zenithoptimedia-share-of-total-ad-spend-by-media-2010-2014-mar2012.jpg

Laura Desmond, chief executive of one of the world’s biggest ad-buying firms, Starcom Mediavest Group, shared her strategy of partnering with new measurement firms to help her company transition to digital. In a WSJ interview, Desmond said, “[p]art of the market is lagging, mostly because they’re holding on to the measurement that they know.”

She agreed part of this lag was due to Nielsen’s monopoly over the measurement business, and hinted that ad buying will eventually depart from the traditional Nielsen rating methods. With the increased media fragmentation and the promiscuous consumption of media by audiences, what Ad Buyers are ultimately looking for is a unified digital measurement system. Until digital measurement reaches this level of sophistication, agencies will continue to fall back to the biggest and most reliable measurement system. Love ‘em or hate ‘em, Nielsen is still the undeniable rating king.

Organic Food: Not Just For Humans

Patrons of this Los Angeles health food boutique have their choice of a cutting edge selection of foods and supplements, including the likes of calcified seaweed, Chinese herbs and fresh venison. They can even sample an organic cookie while they browse the store.

But if they want to make a purchase, they’ll have to beg their owners for their credit card.

My Pet Naturally is one of a growing number of dog boutiques that embraces all-natural wares. In addition to raw food and exotic treats, it sells recycled and hemp products and “a lot of the same supplements that people take,” said owner Neil Massa.

Consumers have become more concerned about organic food not only for themselves, but for their pets as well. Sales of organic pet food increased ten times from 2002-2009, according to the Organic Trade Association. And analysts predict the industry will grow even more, at 12 percent a year through 2015, according to Packaged Facts Market Research Company. Organic pet food is more expensive, it can cost as much as 30 percent more than non-organic, but an increasing number of pet owners are willing to pay the higher price. A few factors may contribute to this trend: two high-profile incidents of contaminated commercial food and an overall growth in the pet industry due to more Americans bringing furry friends into their homes.

Massa said he thinks the trend toward organic pet food took off more in urban areas because the residents are more attuned to holistic living.

“If you look at big cities, people are more aware of their food sources and they want the same for their pets. In metropolitan areas, people are more aware of wanting organic than you see in smaller towns,” he said. “I know from experience. My in-laws are from a smaller town and they have more of a Wal-Mart mentality.”

But even in Los Angeles, Massa finds he must still compete with chain stores, where prices range about five percent cheaper, he said.

“Because I have a smaller store, I buy food by the bag rather than by the truckload, like they do. They can buy more food and get a better deal on it,” Massa said. “We might also sell something for the same price, but it will end up being cheaper at a chain store because they offer a coupon.”

A pound of raw venison costs $8.00 at My Pet Naturally, while at Wal-Mart; customers can buy a 27.5 lb. bag of venison flavored dry food for $30.

photo-22

(Supplement shelves at My Pet Naturally)

Massa opened his store in 2006, a year before Menu Foods pet food manufacturer recalled more than 60 million containers of food. Menu Foods, which was based in Ontario, Canada, was the largest dog and cat food maker in North America. Its products were sold under well-known brand names atchain stores such as Petsmart and Wal-Mart.

“I’ve been making homemade food for my dogs since the 1980s,” Massa said. “I saw there was a need for it and not many were doing it. I read an article about how dead animals become dog food around the same time that people became more aware of Mad Cow disease.” Massa said the recall bumped business up about 10 percent and helped make up the difference in the lack of customers during the recession.

The toxic food killed about 1,950 cats and 2,200 dogs, according to estimates from the U.S. Attorney’s office. The Food and Drug Administration found that the Chinese wheat gluten present in Menu products was tainted with melamine, a substance also used in fertilizer. It is not approved as an ingredient for pet or human food. The products also had a contaminant used as rat poison, and another used to stabilize chlorine in swimming pools. Consequently, the incident scared many pet owners into shelling out for higher-quality fare.

Jacob Gonzalez, the owner of Woof Dog Boutique in Los Angeles, said organic food is “almost the first thing” customers are looking for since the beginning of another epidemic, also in 2007. In this case, thousands of dogs have fallen ill and about 600 died over the course of seven years after eating jerky treats imported from China. The FDA is still investigating the causes. The problems do not seem specific to a certain brand or manufacturer, but according to the FDA, dogs all over the world have been affected. Gonzalez said that ever since, his clientele have made buying American-made food another priority.

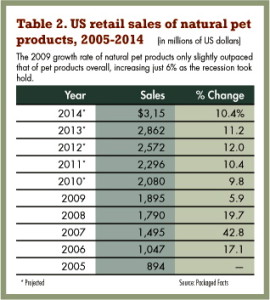
Even before the two food episodes, sales of natural and organic pet products had been growing in the U.S. by teen-double-digit rates since 2002, according to Packaged Facts. But in 2007, sales jumped 43 percent. This may result from the contaminations, as well more pet food marketers extending their lines to ‘natural’ products at this time as well. Sales continued rising to 20 percent in 2008. The increase dipped to six percent during the recession in 2009, but it began climbing up in 2010 and growth went back into the double-digits in 2011.

1009PET_updatetable2


(Packaged Facts)

Some brands market their pet food with labels such as “natural,” “premium,” or “holistic,” and it is typically more expensive. For example, the brand Alpo Come & Get It! Cookout Classics is sold for $0.51 per pound, while Iams Sensitive Naturals Dog Food fetches $2.49 per pound, according to Walmart.com. But the label does not necessarily mean the food is healthier. It is only the “organic,” designation that requires manufacturers to meet any standards. For both human and pet food, 95 percent of the ingredients must be organically grown or cultivated without synthetic pesticides or fertilizers in order to meet the qualifications set by the USDA. Some of the brands containing tainted food from Menu included products billed as “natural.”

Century City resident Linda Schwartz began buying raw venison from My Pet Naturally upon recommendation from her veterinarian. Her Shih Tzu dog was experiencing stomach issues for about six months, including colitis and irritable bowel syndrome.

“My vet said the preservatives in normal food were making my dog sick,” she said. Schwartz is also a fan of the store’s treats that Massa’s wife makes on-site. “My dog is allergic to chicken, but not the treats because they just have chicken juice.” She said that since she started feeding her dog raw meat her dog’s stomach issues have improved.

Although raw meat diets have proved beneficial to some pets, they are not recommended for all. The American Veterinary Association discourages feeding pets raw and uncooked meat because of the food-born illnesses it could inflict on both pets and the humans who are in contact with them. A study at the Cummings School of Veterinary Medicine at Tufts found that up to 48 percent of raw commercial food tested contained salmonella. The researchers also found that these diets could contribute to nutritional deficiencies.

But pet owners are treating their pets more like people, which sometimes means projecting their own desires onto their four-legged children. Sixty-two percent of American households own pets, up from 56% in 1988, according to statistics from trade association American Pet Products. And pet owners are spending more on everything, from products such as Halloween costumes to services related to travel and grooming, according to a 2013 report on pet trends from pet insurance company Embrace.

“People treat their pets like family members,” Gonzalez said. “Not just the dog we leave outside.”