In November 2013, Business Insider CEO Henry Bodget made a compelling presentation analyzing the state of media in the tech space. The findings were from Business Insider’s new research arm, BI Intelligence. The report created waves in the tech industry. In a matter of two days after the reports’ release, it had over 900,000 views.
There were many insightful slides that demonstrated the current digital realm. However, one slide especially caught the eye of media leaders.
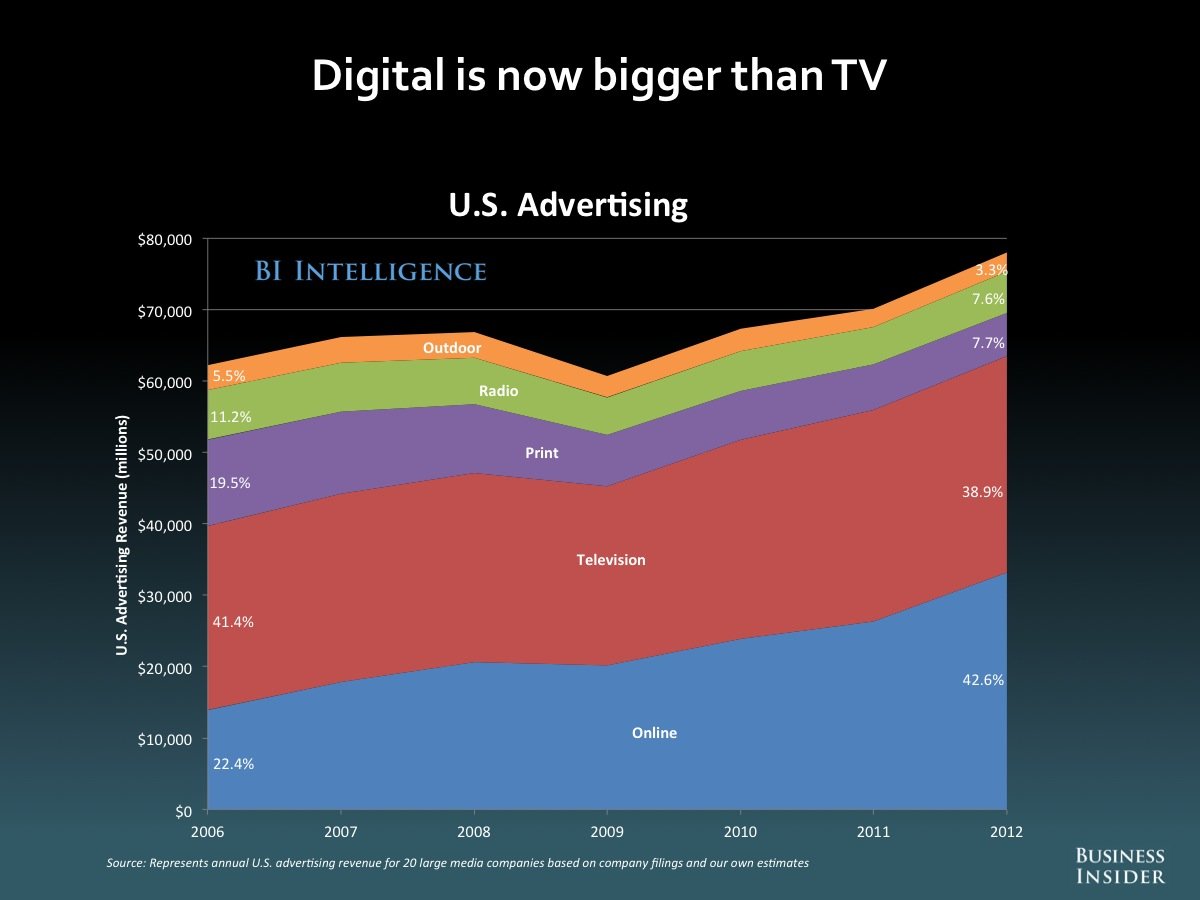
“Digital is now bigger than TV.”
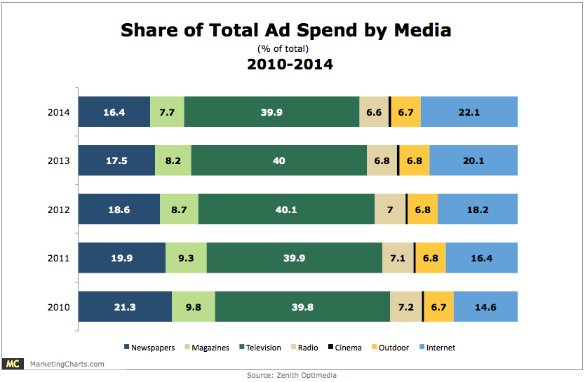
Although a very contested claim, recent years have indicated that digital is causing a major disruption in the media business. In his slideshow, Bodget echoed the industry’s standard rule: money follows eyeballs. Until recent years, “eyeballs” were monetized through a rating system called GRP, invented by Nielsen. However, this method only worked wonders when our eyeballs had one screen: television. Today, we have tablets, smartphones, and desktops. We are constantly consuming and content is becoming available across all of these exhibition windows. The chart above indicate that “eyeballs” are moving to digital, and people want to know how to measure this revolution, and so far, GRPs aren’t cutting it. The rise of digital is shaking up the longstanding media metrics system, and everyone is keeping an eye on the digital ratings race.
Metrics as Currency
In his book, Audience Economics: Media Institutions and the Audience Marketplace, Phillip Napoli refers to audience measurement organizations as one of the four principal actor–along with media organizations, advertisers, and consumers–in the market for audience product. All services are interrelated and depend on eachother to survive.
Audience measurement organizations seek to provide quantitative data on audience viewership. In other words, they are in charge of monetizing attention. The value of a media product, whether it is a sitcom or an article, depends on the audience exposure, or ratings. How many people are watching? How many people are paying attention? Napoli says audience data functions as the “coin of exchange” in the audience marketplace, and it is the currency that media organizations use to sell, and the advertisers use to buy.
The rise of digital advertising has created a ripple effect in the media industry. The industry understands digital ad spending will eventually overtake television; it’s only a matter of time. However, there is also one giant obstacle in the way of this digital takeover–Nielsen.
Nielsen

Nielsen is the undisputed king in the media metrics business. Founded in 1923, the 91-year-old company had revenues of $5.5 billion in 2011. During the TV era, Nielsen dominated the audience measurement industry. Nielsen’s monopoly has been a double edged sword. On one hand, having one audience measurement system eliminates complication and uncertainty. If there were multiple ways to measure, more resources would have to be put in media companies and agencies. If CBS used one method of audience measurement but Viacom used another, and a big client like Proctor and Gamble wanted to advertise on both, media agencies would have to juggle the different numbers and invest in new systems, making it immensely difficult and confusing.
However, on the other hand, because Nielsen is a monopoly, it gets to name its price without competition. Last summer, I had the amazing opportunity to be an IRTS (International Radio and Television Society) fellow, a media scholarship program that funds a select group of students to pursue a media internship in New York City. I got to attend a week-long “media bootcamp,” where we visited major media companies that included broadcasting, cable, digital, etc. In multiple panels, industry leaders complained about Nielsen’s monopoly over the metrics industry. Nielsen has been criticized to be slow in responding to rapid industry changes. Les Moonves, the CEO of CBS, is one of many industry executives who advocated for a better rating system. He pushed Nielsen and the media industry to accept the C7 metric rather than the C3, as the introduction of DVRs (digital video recorders) has allowed audiences to watch their favorite shows later in the week. While speaking to investors at a Deutsche Bank media confab in March 2013, Moonves expressed his frustrations when he said, “All we want is a fair measurement—we want Nielsen to measure everybody, and ultimately, we want an eyeball to count as an eyeball no matter where you watch your television shows.” CEO of Viacom, Phillip Dauman, also echoed Moonves’s frustration in an Economist interview when he said measurement is the “number one issue for television right now.”
How Ratings Work
There are a dizzying amount of terms to know in the media industry. CPMs, GRPs, LPMS, PPC, PPM, and the list goes painfully long. Ad Buyers stare at these numbers every day to allocate their clients’ media budgets; the ultimate goal is to reach as many people as possible for the lowest price. Just to give you a snippet of how the current rating system works, here is a ratings report for this Monday (5/5/2014).
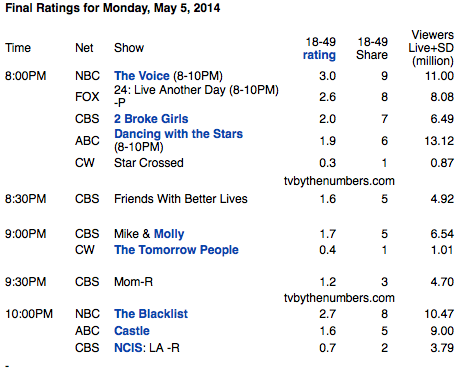
I know, there are a lot of numbers on here. When I was interning at a major broadcast network in the ad sales division, a huge stack of these reports were delivered to our desks each week. The numbers on the columns determined the value of our product. Without going into too much detail, ratings on a sheet like this indicates the Nielsen ratings point system. One ratings point = 1% of the Nielsen estimate for the category being measured. On the chart above, the categories, or the target demographics, are 18-49 year-old viewers. LIVE+SD indicates the number of viewers that watched a program either while it was broadcast or watched via DVR on the same day.
Of course, there are so many questions that are unanswered by these numbers alone. What about Hulu? What about all the binge-watching of 30 Rock I did on Netflix last weekend? What about how much I actually like the show or paid attention to it? Nielsen has yet to come up with a satisfying answer, causing buyers to turn to new players.
The Digital Wave and its New Players
Now that the digital revolution is disrupting the media space, allowing more viewers to consume online, the media community is applying greater pressure on Nielsen to keep up with the trends. Although Nielsen traditionally monopolized almost every aspect of the media industry, it seems that the increased demand for digital measurement systems have introduced new challengers. Today, the digital audience measurement sector is the most vibrant and competitive sector in the metrics market.
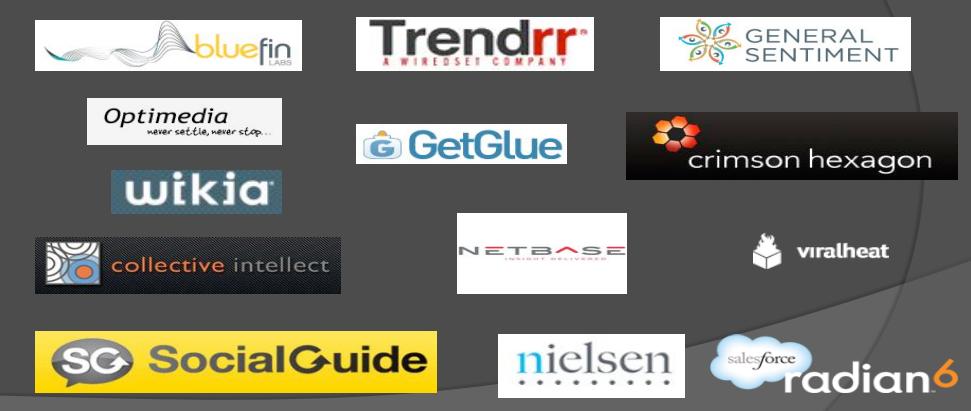
As Nielsen is already the established leader is measuring “eyeballs,” majority of these agencies have focused on the question of audience engagement–how audiences feel, respond, and interact with content. For instance, a client may seek to reach the coveted 18-49 audience, but the viewing experience of Mad Men on cable versus Huffpost Live on digital stream is vastly different. Social media has been the answer for many stakeholders who seek to gain this information (partly because Nielsen does not provide it). In his 2012 TWC research report, Napoli talks about the new players in market and their varying methods. Digital measurement companies like Bluefin, now owned by Twitter, engage in a new metric model depending on information gathered from “web scraping.”
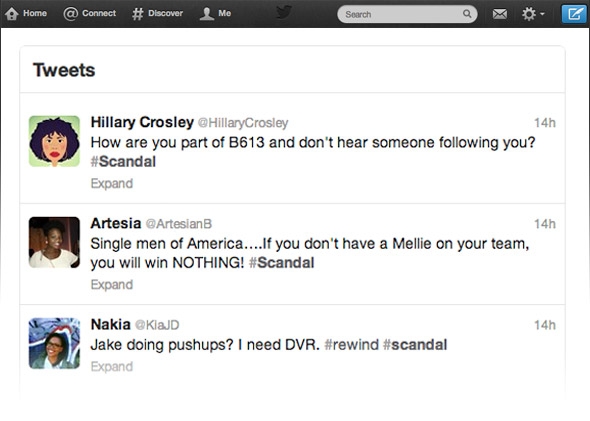
#Scandal Twitter Convos
“Web scraping” is a common method used by social media analytics services, and it involves aggregating comments posted on social media platforms and using sophisticated algorithms to measure the popularity or sentiment of a show. These measurements derived from online conversations go beyond television consumption to include the consumer’s buying behavior and affinities. Another advantage of this method is that unlike Nielsen, which has a set measurement sample, information can be extracted from anyone who participates in the web.
However, Napoli points out that these digital measurements do not try to stray too far from traditional methods. For instance, Trendrr.tv offers a “share of voice” metric, representing the share of all television-focused social mid activity attributed to a network or a show in a specific time period. Bluefin Labs showcases a “response share” metric that measures a program’s share of the online television conversation at the time the program aired. Other applications like Getglue or Viggle depend on the “check-in” method, measuring digital activity on second screens like computer or mobile phones.
So far, there is no “one-size-fits-all” rating system for social media activity. Some analytics firms focus on a programs’ market share in a weekly or monthly basis while others focus on individual days. One major challenge of these new technologies is that their measuring process is not transparent. One reason for its secrecy is to protect its patents from competitors, but this creates a black box effect that drives ad buyers crazy. Again, the cost of having multiple players in the metrics marketplace is confusion and inconsistency.
Nielsen Strikes Back
Nielsen is trying to meet these new threats by introducing weapons of its own. Check out this cover of their latest yearly report.

Notice anything?
No television in sight.
Nielsen is no fool. The company understands industry trends and it is trying hard to keep up. Last year, it released a new product called “Digital Program Ratings,” recruiting big name partners like NBC, Fox, ABC, AOL, CBS, Univision, Discovery and A+E to participate in the test run. The product will mainly track the network’s desktop websites with plans to integrate mobile in the future. This release follows the company’s introduction of the Twitter TV Ratings system, a measurement of pure social activity. Nielsen also acquired Arbitron for $1.3 billion in December 2012, swallowing its rival with expertise in measuring mobile content.
Despite its shortcomings, Nielsen is still the undeniable leader in its industry. Despite initial reluctance, Google began a partnership with Nielsen in testing ad campaigns on Youtube using OCR (online campaign ratings) deals with select clients. It is a win for Nielsen and a smart move by Google. The search engine giant understand the major ad spenders have a longstanding relationship with Nielsen, and if it wants to gain their trust, they have to use a credentialed third party entity.
What About the Ad Buyers?
Dubbed as “promiscuous consumption,” Millennials are consuming content through search, social, online video, mobile, and television. Ad Buyers are adjusting their buying habits in response to these new trends as well. Since 2010, ad spending on the internet saw the greatest change with a 7.5% increase.
Laura Desmond, chief executive of one of the world’s biggest ad-buying firms, Starcom Mediavest Group, shared her strategy of partnering with new measurement firms to help her company transition to digital. In a WSJ interview, Desmond said, “[p]art of the market is lagging, mostly because they’re holding on to the measurement that they know.”
She agreed part of this lag was due to Nielsen’s monopoly over the measurement business, and hinted that ad buying will eventually depart from the traditional Nielsen rating methods. With the increased media fragmentation and the promiscuous consumption of media by audiences, what Ad Buyers are ultimately looking for is a unified digital measurement system. Until digital measurement reaches this level of sophistication, agencies will continue to fall back to the biggest and most reliable measurement system. Love ‘em or hate ‘em, Nielsen is still the undeniable rating king.
Leave a Reply
You must be logged in to post a comment.