Why Sentiment Is Greater Than Spending

Economic indicators such as unemployment rates, the U6 number and the consumer price index are key insights into analyzing the economy. Experts are constantly studying what is going on in both the global economy and economies of specific countries in order to understand current economic states. This allows individuals to make educated predictions about the future of these economies. Often the most important indicators to look at are not those providing data of what is happening now or the spending that is taking place currently, but rather indicators that forecast future trends. These indicators are called leading indicators – one being consumer confidence.

Consumer confidence measures how optimistic consumers are feeling about the current state of the economy, as well as their own personal financial situation. The index is based on a monthly survey of thousands of United States households. The survey is put on by The Conference Board and consists of five questions surrounding topics like current business conditions, business conditions for the next six months, current employment conditions, employment conditions for the next six months and total family income for the next six months. Opinion on current conditions makes up around 40 percent of the index and expectation about the future makes up around 60 percent. The primary focus on the future is what categorizes consumer confidence as a leading indicator, as opposed to a trailing indicator like retail sales.

While this economic indicator specifies consumer sentiment, it has the powerful ability predict consumer spending. Consumer confidence will directly point to whether individuals are likely to go to the mall on the weekend to do some leisurely shopping, or if they will only be focusing on fulfilling only their basic needs. In turn, it aids experts and other consumers in understanding where the general population feels the economy is going – arguably the most important insight into a nation.

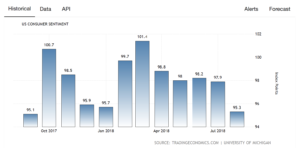
Normality of consumer confidence is measured at 100. In August 2018, consumer confidence in the United States was the lowest in almost a year, falling from 97.9 in July to 95.3. A graph tracking consumer confidence in the U.S. over the last year is shown below:

Experts are estimating the low reading is mainly due to less favorable perceptions of market prices. Additionally, consumers reported viewing vehicle and home-buying conditions as less favorable. There is evidence that consumers have become very sensitive to even low inflation rates, as they were anticipating a 2.9 % inflation rate ahead of August.

This fall in consumer confidence will likely reflect in next month’s retail sales and personal spending numbers. Aware of the effect of this economic indicator, corporations as well as politicians utilize consumer confidence to anticipate whether people will be likely spending more or saving more in upcoming months. Businesses are able to adjust operational plans as a result of the indicator, either increasing or decreasing volume production of their product. Additionally, the government can adjust their expected tax revenue based on consumer spending.

It is essential to pay attention to consumer confidence. It allows consumers and experts in economics to make proactive decisions regarding the economy. The economic indicator also provides valuable insight into the certainty citizen’s feel about their nation.

Trump Helps Mexican Economy?

Despite a previously rocky relationship between the Mexican government and the Trump administration, new trading deals have been discussed that seem to satisfy both countries. Trump has had a difficult relationship with Mexican President Enrique Peña Nieto due to Trump’s demands that Mexico pay for a border wall, yet it appears that negotiations have been made to continue a cordial trade relationship with Mexico. 

President Trump has been openly opposed to the North American Free Trade Agreement (NAFTA) and so he is determined to create new trade deals during his presidency. In an effort to achieve this goal, he has negotiated a new trade agreement with Mexico and is in the process of negotiating with Canada. Due to the complicated and difficult relationship between the United States and Mexico, Canada has been waiting for the issues between the two countries to be sorted out before getting involved in the new trade agreement.

In this new trade agreement, Trump has addressed his fear for loss of American manufacturing jobs. According to Charles Wallace, in Forbes, “the agreement provides that 85 percent of parts in the car must be made in North America to be considered for tariff-free imports. The Trump Administration has been concerned that car parts from Europe and Asia, especially china, were being assembled in car in Mexico and then imported for sale in the United States.” This new trade agreement gives Mexico an incentive to use America car parts because it saves them money on tariffs. 

President Trump is always very confident about his decisions, yet some of his plans for this new trade agreement may not be possible. Trump wants to get rid of NAFTA completely and create his new trade agreement as the sole agreement between the US, Canada, and Mexico. However, it is unclear whether this form of action can be implemented or will be allowed by Congress. He also feels so strongly about the trade agreement with Mexico that he has contemplated the idea of following through with the agreement even if Canada does not get involved. This is not a mind set that is agreed on by all members involved, though. Mexico has made it clear that the trade agreement must involve Canada and the US Congress has backed this opinion. Because of this, the trade agreement will not be complete until negotiations have successfully been made with Canada. There is, additionally, a time limit for the final negotiations to be made because López Obrador will likely attempt to make changes if the treaty is not completed before he assumes the presidency.

Currently, both the United States and Mexico stand to benefit from this trade agreement and the ability to negotiate between the two countries is a success in itself. However, there are still uncertainties about the future of the agreement and its success.  

How Turkey’s economy collapsed and what it teaches others

Last week, the Turkish lira tumbled to an all time low post-2008, losing a third of its value and is, at present, around six lira to the US dollar. The ripples were felt in several emerging markets. In Argentina, for instance, as the peso slumped to a record low, the nation’s central bank raised its interest rate to a staggering 45%. The currencies of South Africa, Brazil and Mexico were also affected.

In an article in Forbes, Jesse Colombo wrote that since 2002,“Turkey’s economy nearly quadrupled in size on the back of an epic boom in consumption and construction that led to the building of countless malls, skyscrapers, and ambitious infrastructure projects. Like many emerging economies in the past decade, Turkey’s economy continued to grow virtually unabated through the Global Financial Crisis, while most Western economies stagnated.”

Taking advantage of the low interest rates after the global recession of 2008, Turkish banks and firms drew on massive foreign loans to fund a relentless drive towards economic growth. Turkey’s real GDP grew by more than 34% in the last five years – only slightly less than China and India.

Things were looking up for quite some time: the labor force participation rate steadily increased, youth unemployment rate dropped, and the inflation rate was mostly steady. But there had always been indicators of the impending collapse that would burst the bubble.


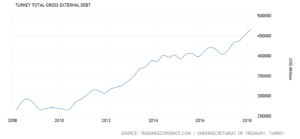
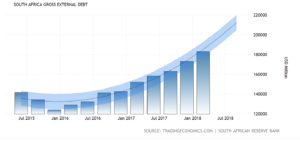
Turkey’s growth has been so dependent on financing from foreign investors that the nation’s total gross external debt reached around $466657 million in the first quarter of this year. Turkish banks had borrowed money at low rates from European and American banks right after the recession so that they could, in turn, loan the money out to Turkish companies. But as the value of the lira plummets, it seems more likely that the companies would be unable to pay back the loans, therefore also affecting Europe and the United States.

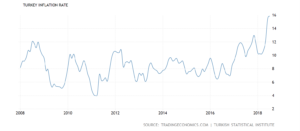
While the country’s inflation rate had more-or-less steadied itself between 2010 to 2016, it started spiraling upwards from the middle of 2016 and sky-rocketed in the past two months. The Central Bank of the Republic of Turkey was prevented from making the necessary interest rate adjustments to fix the crisis.

President Erdoğan is a believer of the idea that interest-based banking is “prohibited by Islam” and has also claimed that increasing the rate of interest is “treason”. Throughout his tenure as president, he has gradually stripped power and independence of financial institutions. After acquiring sweeping executive powers after his re-election in June, he resisted the bank’s calls to increase the interest rate. Perhaps in an effort to assert greater control of his country’s economy, Erdoğan appointed Berat Albayrak, his son-in-law to the office of Treasure and Finance Minister last month.


What can Turkey’s implosion teach other countries?

While the collapse of the Turkish economy would obviously affect the countries that invested the most in it, the indicators that should have ideally served as warnings of an impending collapse, can also teach something to other emerging markets. Several developing countries weathered the global recession and, like Turkey, used foreign investments to fund staggering levels of growth. Two examples are India and South Africa.

While the India’s external debt has steadily increased in the last ten years, it has so far managed tokeep inflation under controlwhile at the same time reporting high GDP growth rates. While India dealt with the global recession much better than most other states, in recent months, the Indian currency has taken a hit, perhaps indicating that the world’s second most populous country is walking an economic tight-rope.

South Africa on the other hand is on the exact same trajectory as Turkey. Its external debt has rapidly risen and while the inflation rate was under control for some time, it has shown a steady increase and is set to increase again. The labor force participation rate of the country has also been steadily falling over the last few months.


How politics burst the Turkish bubble

Besides purely financial factors, the rule of law too has an effect on a nation’s economy. Among other things, politics was also responsible in causing a decline in Turkish fortunes. Local businesses got caught up in the government crackdown of dissenters post the failed coup d’étata couple of years back. It has often reached ludicrous levels. According to a report by NPR, for instance, a certain brand of carpet stopped selling because the factory that manufactures it had been raided by the police for alleged links toFethullah Gülen, the United States-based cleric whom President Erdoğan accuses of orchestrating the coup.

Internationally, the relationship between the United States, a major investor, and Turkey have recently worsened over a variety of issues ranging from Turkey’s continued detention of Andrew Brunson, an American pastor allegedly linked with the coup, the nation’s handling of the Syrian crisis, and its cozying up to Russia. The financial crisis was in-part accelerated by President Trump’s decision to double steel and aluminum tariffs on Turkey.

While the crisis in Turkey could affect the United States, Europe, and some emerging markets of developing countries, it could further destabilize the economies of neighboring Iraq and Syria, further destabilizing a region already torn apart by war.

Are “They” Taking Our Jobs?

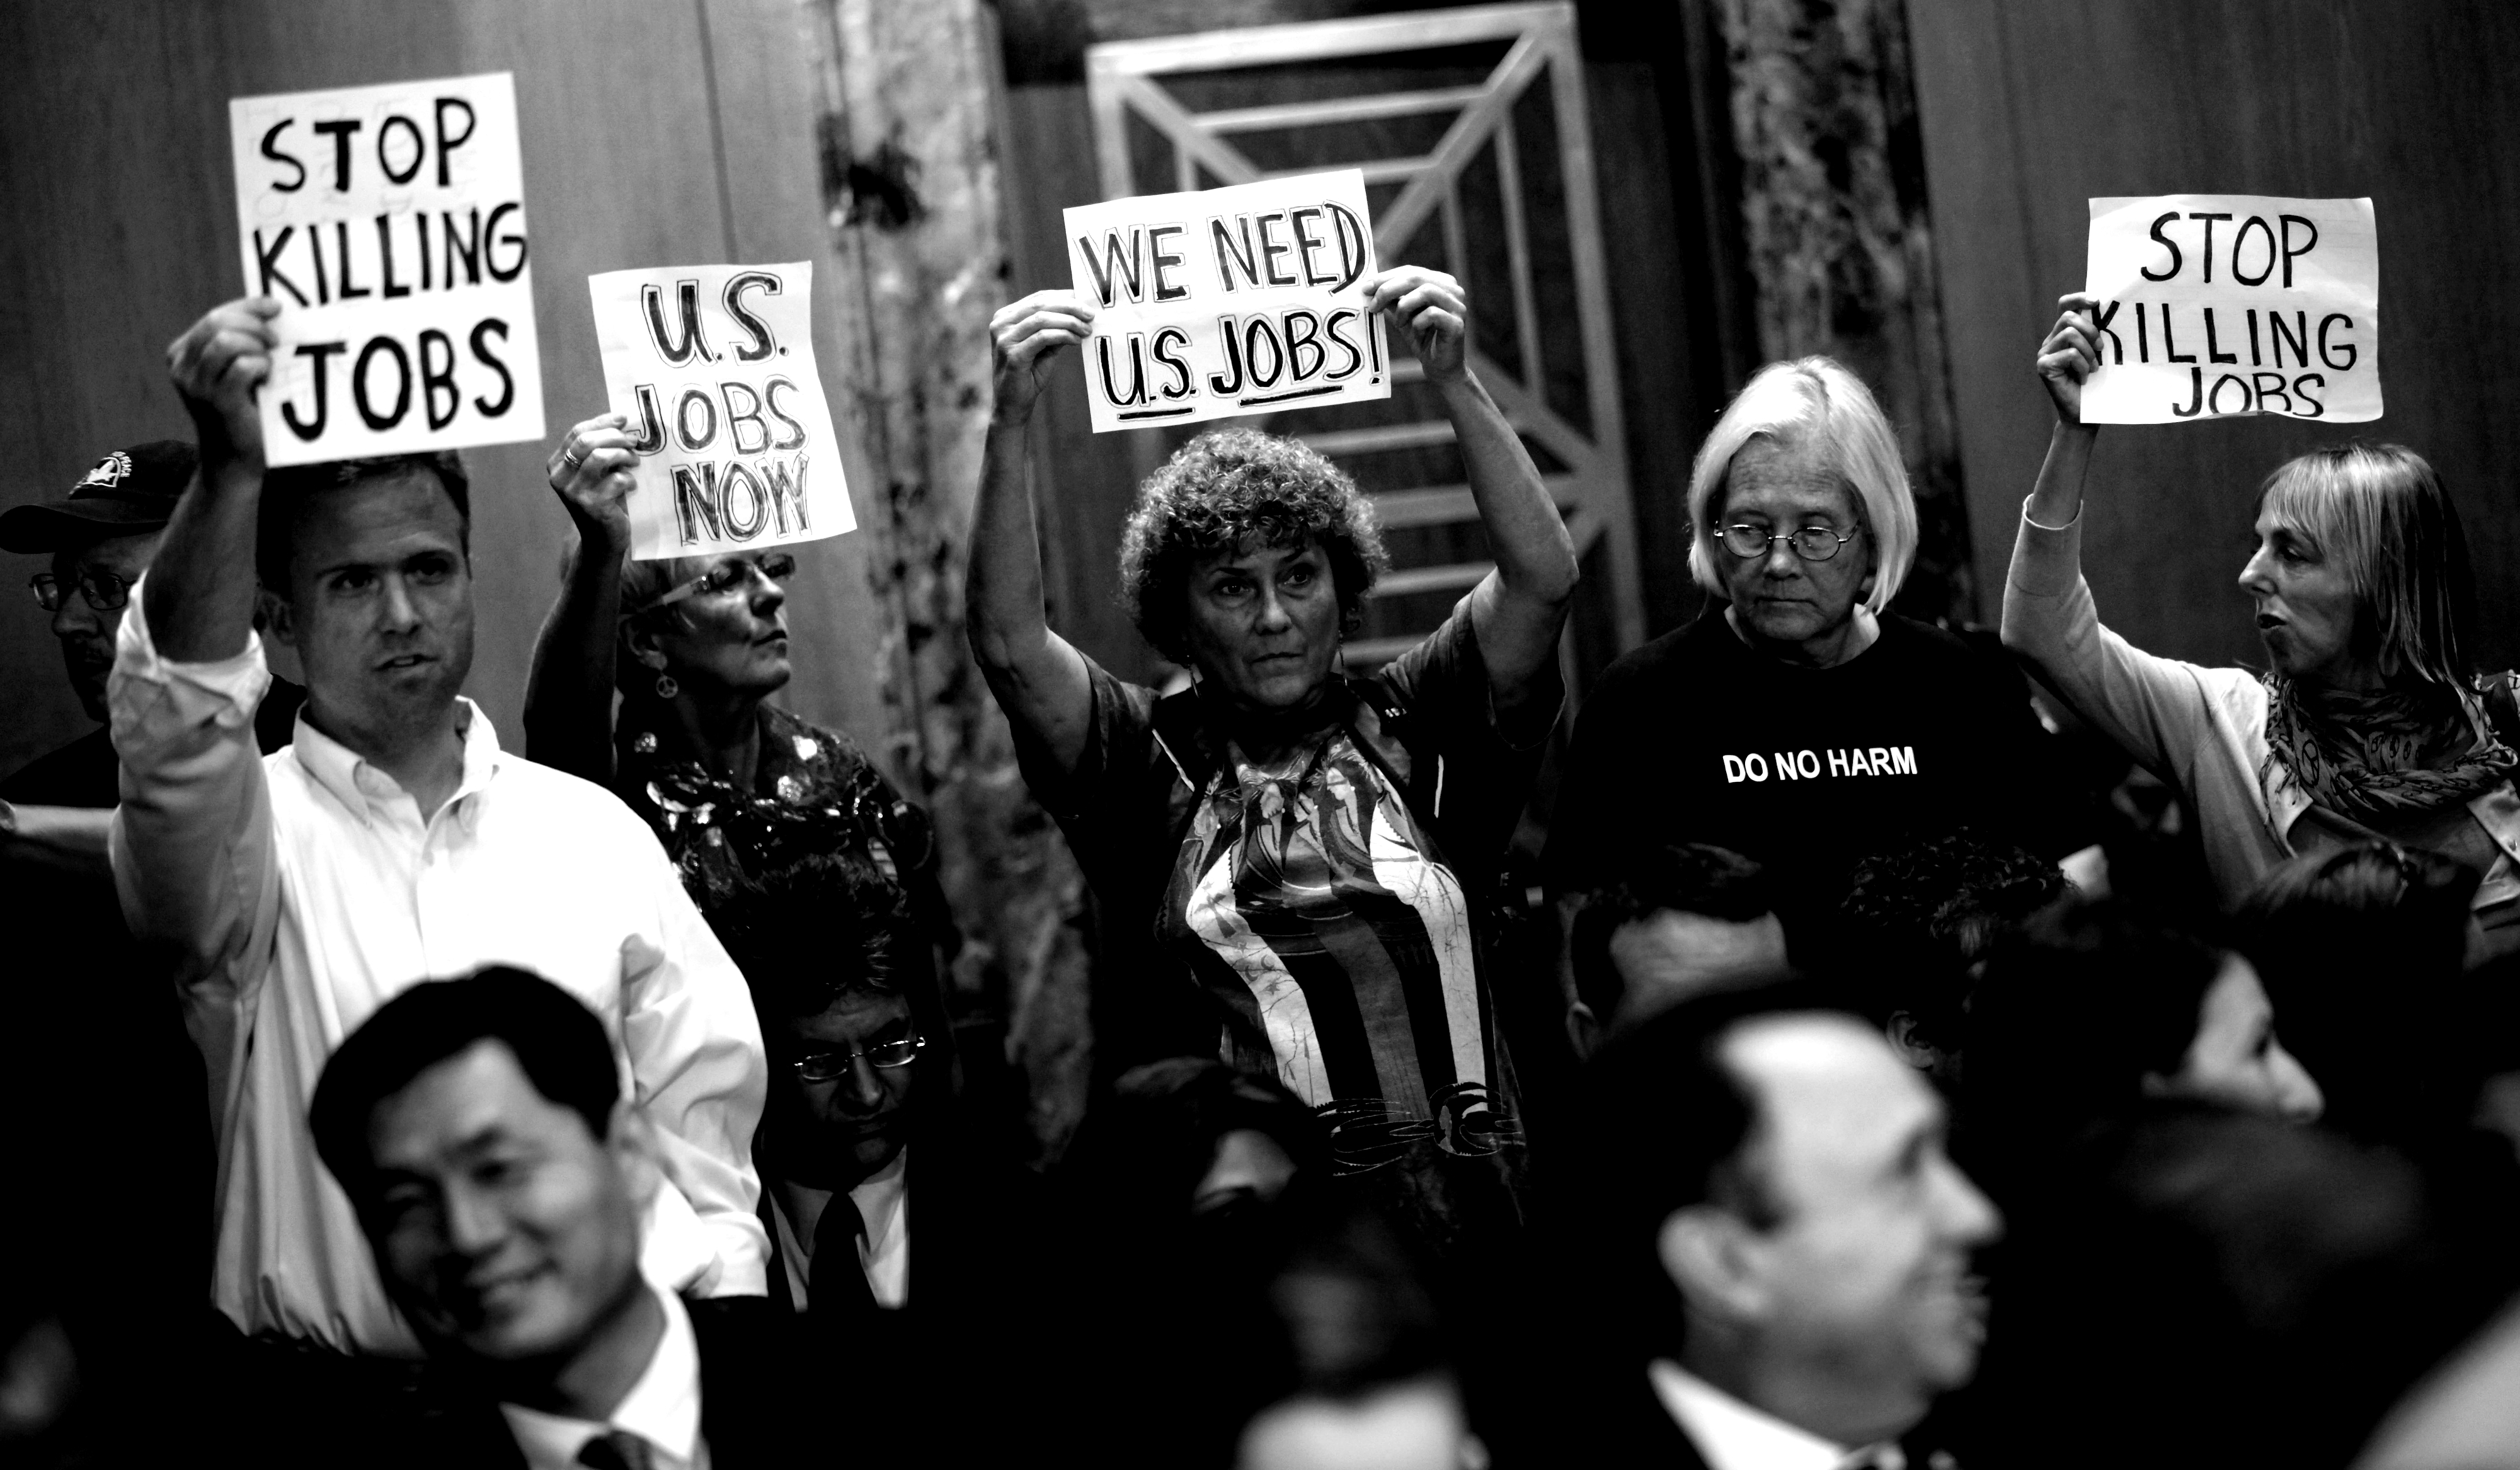
A significant part of the justification behind Donald Trump’s recent trade war with China lies in his supposed rapport with the American White working class, specifically those who come from the manufacturing, farming, and mining sector. He repeatedly makes the claim that the outsourcing of jobs and the stealing of U.S intellectual property by countries like China has taken away “millions and millions” of jobs, costing us “billions”. Hence, taxing foreign imports would encourage American industries to “buy and invest local.” The U.S trade deficit plays a huge role in this. China is screwing us, Trump claims, and stealing “500 billion dollars” from our economy.

But if it were really the case that massive trade imbalance harms the economy, then it would follow that at the very least an increase or decrease in the trade deficit would correlate with an increase or decrease in unemployment rates.

The unemployment rate measures individuals who are willing and available to work or are actively seeking work. Those working part-time are considered employed. The trade deficit measures the difference between a country’s net exports (goods leaving the country) and net imports (goods coming into the country).

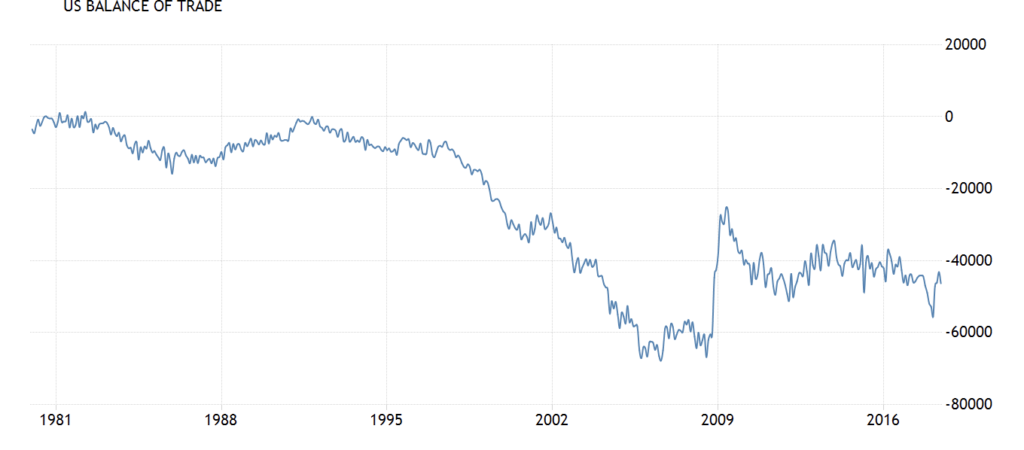
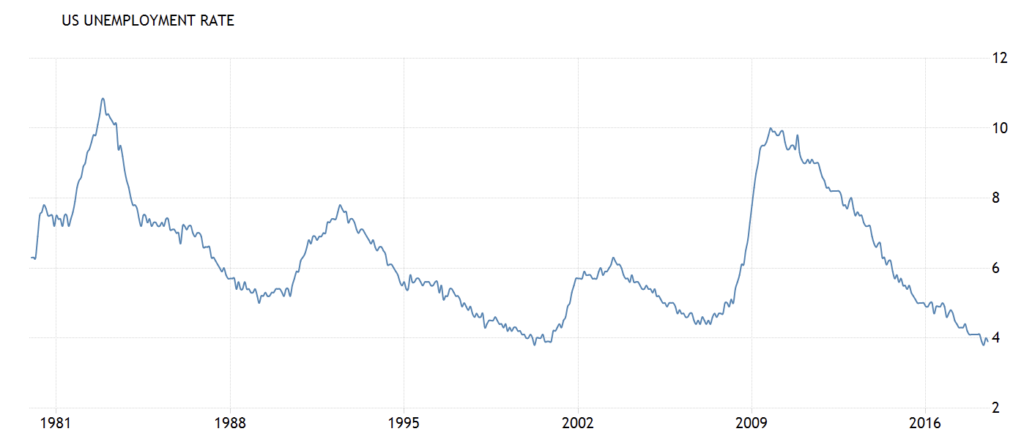
Compare and contrast, then, U.S trade balance and the unemployment rate since 1980, according to the U.S Bureau of Labor Statistics:


The above graphs of course paint a very complicated picture of the effects of trade balances on employment rate. While the periods between 1981 and 1986-86, and 1988 and 1992-3, saw a slight correlation between rising unemployment and an increasing trade deficit, the period between 1995 and 2000 saw the opposite: there was a huge decrease in unemployment despite a massive widening of the trade deficit. In fact, sometimes it is even the case that decreasing trade deficits correlate with rising unemployment, as is demonstrated by the 2008-2010 period.

So if Trump wants to cause a trade war, he’d best provide another justification, as job losses don’t seem to have much to do with trade imbalances. It also weakens his NAFTA argument—that NAFTA is one of the main culprits in the massive outsourcing of jobs to Mexico. Since the act’s passing in 1993 until the Dot-Com Bubble, employment had actually decreased from about 7% to 4%. So there you have it: “they”—those malevolent, rapacious, cheating foreigners—are not taking away our jobs. The question then remains as to why Trump continues to wage this ridiculous trade war with China, even when it actually hurts American workers.


Cannabis, Cash, and California

In November 2016, following a trend of progressive change and cultural shift throughout the country, California passed the legalization of recreational marijuana for consumers over the age of twenty-one. Going into effect starting in 2018, any person over the age of 21 can legally buy marijuana. According to California State Treasurer John Chiang, the $7 billion industry is expected to generate over $1 billion in state tax revenue.

However, per the federal government, marijuana remains a schedule 1 narcotic, the same level of hazard and as heroin. The federal government is responsible for regulating banks and interstate commerce, which naturally yields problems for states with the legal sale and consumption of marijuana. Ergo, those who work within the new industry of recreational cannabis are completely blocked off from banking and financial services. Interstate banks fear harsh criminal repercussions from handling money from illicit activities—they can lose accreditation or even face money laundering charges. During the Obama Administration, Deputy Attorney General James Cole and the administration employed a lax stance on marijuana. Stopping marijuana sales in legal states was pushed to the back burner, and there were even some compliance guidelines that allowed for a small number of banks to work with some cannabis-related businesses. However, current Attorney General, Jeff Sessions has taken a vehement opposition to the sale and consumption of marijuana. At the beginning of his term, Sessions outlined a plan to employ more resources to curbing the federally illicit activity in the rogue legalized states. However, the agenda item has failed to actually commence, as a June 2017 deadline passed with no sited work in progress.

With a burgeoning $7 billion industry existing mostly in cash, there are dangerous and inefficient implications that stem from the neglect of banking services. The irony of the industry is that it is essentially the only business that is begging to be regulated, as regulation will create safety for everyone involved in the transaction. Less cash on hand means less potential for burglary and crime. Additionally, the switch to electronic payment systems would make wages and compensation more foolproof, as well as more efficient with sending tax revenue to the federal government (though the drug is recognized as a schedule I narcotic, the federal government still requires taxes on the sales of said illegal drug).

Hundreds of thousands of dollars in cash being mulled around in duffel bags and cars present a high risk for crime and theft. Armored vehicles and security guards are a necessity and a costly investment. The laborious counting of stacks of cash for paying taxes is slow and inefficient—it requires the tax collectors to use more time and people bring backpacks full of cash to bank and takes time Additionally, a cash-only system makes it difficult to pay employees and write checks.

In efforts to find an effective solution to the impending booming industry, California State Treasurer John Chiang commissioned a task force coalition, the Cannabis Banking Working Group (CBWG), to brainstorm solutions to this problem, comprised of representatives from law enforcement, banks, regulators, and local governments. The goal is “to ensure a safe a smooth transition for the public, businesses and financial institutions” in the “unchartered waters” of legal recreational marijuana. The coalition has met several times in 2017 and published a report in early November 2017 outlining possible solutions to marijuana and banking in California. Four proposed solutions were detailed in the report. Chiang and the CBWG certainly signal a strong volition that may over time lead to actual policy results.

Solution 1: State Courier Service: Under this plan, “the money would come to the state and the would be the party that would interact with the banks”. Armored vehicles would pick up cash from marijuana businesses and then transport those tax dollars to a secure counting facility. The cash would then be taken to either a federal reserve facility or a financial institution willing to “accept the cash as deposits to state accounts”.

Solution 2: Adhere to lenient existing laws: Support and expand the few small banks that continue to follow the strict compliance guidelines that allowed for business with the marijuana industry under former U.S. Deputy Attorney General James Cole.

Solution 3: Creation of a publicly owned bank or state-supported financial institution. Public banks are independent of the federal reserve and are insured by the state. This idea has been gaining popularity since public dissatisfaction with Wall Street and big banks, and may also reap other benefits. Such a bank could expand banking to underserved groups beyond the cannabis industry. However, the obstacles are formidable: it would be extremely difficult to obtain deposit insurance. Expensive start-up costs and investments would likely reach billions of dollars, and the likelihood of taxpayers paying for potential losses for several years is probable. In addition, a public cannabis institution might have trouble obtaining federal regulatory approval and access to Federal Reserve money transfer systems. So far there only exists one state-owned bank in the United States—The State Bank of North Dakota, which is insured by the state of North Dakota.

Solution 4:  Lofty Federal Goals

  1. Provide legal safe harbor to financial institutions, by prohibiting federal prosecutors or regulators from penalizing them for serving cannabis customers that comply with state law.
  2. Legalize cannabis by taking it off the list of Schedule I controlled substances.
  3. Prohibit federal officials from prosecuting cannabis consumers or businesses in states that have approved medical or adult recreational use.

Some dispensaries that have already secured tightly regulated financial bonds with credit unions are also finding innovation to take their business from cash to plastic, using the stringent guidelines still existing from the Obama years. CanPay, “the world’s first debit payment app for Cannabis retailers,” is available in a handful of states and offers app holders with an electronic form of payment with their dispensary. According to BDS Analytics, people buy more with debit cards than cash, as its easier for cashiers to up-sell customers at the register, as the buyer doesn’t come in with a hard cash limit.

There are existing small banks and credit unions that offer services to the cannabis industry. However, the Fourth Corner Credit Union has been in a battle with the denial of federal deposit insurance from the Federal Reserve Bank of Kansas City. The Union has taken the case to the 10th Circuit Court of Appeals. Recently, “the ruling leaves Fourth Corner free to pursue another master account and provides a legal fallback in case that bid were to be quashed”.

Though the tension between the legality of marijuana continues to brew, the legality will ultimately come from a major shift in sentiments, especially from conservative lawmakers. In September 2017, Senator Orinn Hatch (R-UT) introduced a bill into the Senate that would make it easier for researchers to conduct research on the medical benefits of marijuana. Hatch, who is by no means a supporter of the recreational use of marijuana, issued a witty prepared remark:

“It’s high time to address research into medical marijuana. Our country has experimented with a variety of state solutions without properly delving into the weeds on the effectiveness, safety, dosing, administration, and quality of medical marijuana. All the while, the federal government strains to enforce regulations that sometimes do more harm than good. To be blunt, we need to remove the administrative barriers preventing legitimate research into medical marijuana, which is why I’ve decided to roll out the MEDS Act”

While Senator Hatch’s remarks represent a potentially more open perspective on easing marijuana jurisdiction. On the other hand, however, cannabis and banking remain stagnated by members of Congress. In mid-November, a proposed amendment protecting Cannabis Banks was blocked by GOP members of the House. Also known as the “Safe Act of 2017”, the amendment would have allowed greater access for the cannabis industry into Federal Banking and for financial institutions to give services to cannabis-related businesses through safe harbor.


ofo: China’s Bike-Share Giant Faces Bumpy Roads Ahead

First came the taxi hailing and riding-sharing apps Didi and Uber, then there was the lodging app Airbnb. China has been fully embracing the concept of “sharing economy” in recent years, and the next big trend is here: dockless bike-share. Founded in 2014, ofo has now become the leading bike-share company in China and is valued at $2 billion. Today, ofo has 200 million users and is operating in more than 100 cities globally. While it seems like ofo fits every definition of a successful internet start-up, many people are questioning whether this rare unicorn is in fact a giant bubble waiting to burst.

It all started when 5 college students in the cycling club of Peking University, one of the most prestigious colleges in China, decided to create a student project together involving bikes. Dai Wei, the 24 year old CEO and co-founder of ofo first came up with the now household name because the letters are shaped like a bicycle. At the beginning stages, ofo was only operating on the campus of Peking University. Students who offer their own bikes for ofo’s bike-share program will gain access to use all the other ofo bikes around campus with a small charge, including the initial 200 bikes Dai bought. What is different about ofo is, these bikes do not need to be parked at specific bike stations. Users can look for bikes near them, and park the bikes at their convenience at the end of their trip. In September 2015, 1,000 more ofo bikes were brought to the Peking University campus. In a month, the amount of orders ofo received daily grew from less than 200 to over 4,000.

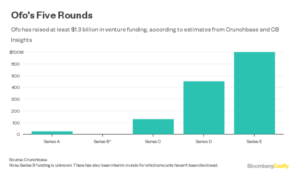
After its successful launch in Peking University, ofo quickly expanded to five more prestigious universities around Beijing. However, the team soon realized that they cannot rely on the students to share their own bikes to quickly grow their user base. Rather, the company learned that it needed to buy more bikes because easy access to the bikes is what attracts more people to use their app. From then, ofo has been through many rounds of venture funding, capturing more capital each round. Data from Crunchbase shows that ofo received 10 million RMB ($1.5 million) in series A funding in January 2016. In October, the start-up was able to raise $130 million in a series C round. In the latest D and E rounds, ofo raised $450 million and $700 million led by DST and Chinese tech giant Alibaba, respectively. With all this capital in hand, ofo has been doing one thing—expand. In 2016, ofo owned 85,000 bikes; this year, that number has gone up to 10 million.

Exactly what kind of business model attracted so much capital? Today ofo operates by charging users 0.5 to 1RMB ($0.07 to $0.15) an hour to use their bikes in China. Their pricing overseas is usually higher, at around $0.5 to $1 an hour. Users have to download an app on their smartphone, pay a 199RMB ($30) security deposit, and scan a QR code on the bike to unlock and use it. This is a big shift from when ofo operated solely on college campuses, which are better regulated environments with clear demand. Also, because ofo collected student owned bikes, the pricing was likely profitable. Today’s ofo effectively operates as a bike renting company, even though it is still being marketed as a “bike-share” company. Ofo is fundamentally different from ride-sharing apps like Uber or Didi because it does not provide a two-sided platform connecting riders and drivers. There is no network effect, namely, the value of ofo’s service does not increases with the number of users on the platform. Moreover, unlike Airbnb, there is no significant asset-sharing going on with ofo. It is not part of the sharing economy where companies connect users with assets owned by someone else that are underutilized. Airbnb does not own a singlepiece of property but uses other people’s “spare rooms”, whereas ofo directly owns all the bikes its users are paying to use. “What they’ve got is a very interesting technology, but a basic business model that makes no sense,” says Paul Gillis, an accounting professor at Peking University.

Is the new ofo model actually profitable? It seems like no one has a definitive answer to that question. Michelle Chen, COO of ofo claimed during an interview with Financial Times China that the company has gained profit in a few cities, but refuses to reveal any details about the profit margin or name the cities. In fact, many believe that the current business model of ofo may never profit. “Across the board, what we are seeing is non-economic behavior and a race for scale that is fueled by hype and enabled by easy access to money”, says Jeffrey Towson, a private-equity investor and a professor of investment at Peking University. Towson believes that the biggest issue with ofo is that its pricing is “almost certainly unprofitable”. Ofo bicycles are reported to cost 500 RMB ($75) to manufacture. According to the company’s official website, there are currently around 10 million bikes in use and 25 million rides registered per day. Assuming each rider spends 1 RMB on each trip, it would take about 200 days to recoup the production expense of a bike. Although this seems like a rather promising calculation, with high expense for maintenance, as well as theft and vandalism charges, the odds of breaking even drops immensely.

Ofo needs to hire numerous maintenance teams to move the illegally parked bikes, and to redistribute bikes in areas with high demand because there are many complaints of the bikes blocking the streets and pedestrian walkway. The maintenance teams are also responsible for tracking down bikes that are vandalized, stolen or reported broken and unusable. Videos of people throwing ofo bikes in to canals have gone viral on the internet, and there are also reports of the QR codes being intentionally defaced so that users are not able to scan and unlock the bike. Unlike Uber and Airbnb, where most of the tasks involved with purchasing and maintenance are outsourced to users (drivers, hosts and guests), ofo has to take these losses and put a lot of money and effort into the maintenance of bikes. Essentially, the very factors that make ofo’s bike-share services so convenient—low prices and ease-of-use, have resulted in razor-thin margins and widespread customer negligence, and are making it difficult for it to stay afloat.

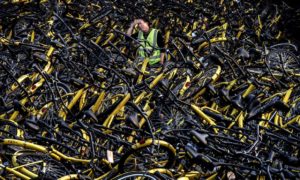
A mechanic from Ofo stands amongst damaged bicycles needing repair in Beijing. Photograph: Kevin Frayer/Getty Images

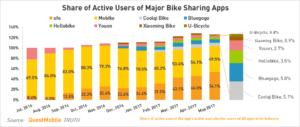
Despite the still lingering questions about the ultimate profitability of ofo’s business model, the company continues to carpet bomb China with hundreds of thousands of bikes. The main reason why ofo is taking this strategy is that it is fighting for the market share. Even though ofo is the first dockless bike-share company, many copy cats soon entered the competition and are putting their own colorful bikes on the streets of China. In 2016, 30 different bike-share companies were operating around China, scrambling for investments and users. Mobike, ofo’s largest competitor backed by Tencent, was able to surpass ofo with a 69.5% share of active users of bike-share apps. With the support of more capital, ofo stroke back this year with more bikes and promotions to attract users and regained its lead in the market. However, it appears that this fight for market share between different bike-share companies will not end soon. Michell Chen, COO of ofo claimed that the company’s goal for next year is to continue its expansion by putting more of its bikes in more cities. Mobike and smaller competitors including Youon and Mingbike are also planning on further expansion. This creates continued competitive pressure on already likely razor-thin, if not negative, operating margins.

Under ofo’s current business model, revenue depends on getting rides, and getting rides depends on making sure bikes easily accessible wherever you are. One way to ensure that a potential rider always has a bike nearby is to put dozens of bikes on every street corner, but that has led to chaos and oversupply. In August, Shanghai’s municipal transportation bureau sent a notice to a number of bike-share companies demanding they refrain from adding more new bikes on the streets. The notice also asked these companies to relocate bikes parked and scattered carelessly across the city. According to Quartz, Ofo said it was addressing the problem in Shanghai in an interview with China’s Hubei Television in August.“This month Ofo has dispatched 80 extra carts [to relocate bikes], and we have a total of 2,500 operations staff working on cleanup and repairs,” said Hu Yun, chief of Ofo’s operations in Shanghai. “We are proactively cooperating with the government’s calls to clean up the city.” By the end of November, the city has already cleared out 500,000 excessive bikes (link in Chinese) put on the streets. The government also called for the comapnies to register the 1.7 million sharing bikes (link in Chinese) in the city. Similarily, authorities in Beijing, Shenzhen, Guangzhou, Wuhan, and many other cities also put the brake on adding more shared bikes to the streets. With five operators, including Ofo and Mobike, expanding rapidly since in the city at the end of last year, Wuhan’s urban districts now has 700,000 shared bikes (link in Chinese), far exceeding the city’s carrying capacity of 400,000. The government stepping in to prevent the companies from adding new bikes on the streets is no small hindrance for the industry’s core business model. Ofo now needs to spend even more resources on maintenance under the government’s tight scrutiny, and needs to figure out new ways to expand their business.

Thousands of share bikes laid to rest in the south-eastern Chinese city of Xiamen. Photograph: Chen Zixiang for the Guardian

In the past six months, six different bike-share companies has went belly up (link in Chinese), and over 1 billion RMB ($151 million) of users’ security deposit has been lost. In July, some users of Mingbike claimed that they were having problem getting their security deposit back, causing many users to request their money back from the company. Employees of the company claimed that they still owe 250,000 users a total of 50 million RMB ($7.55 million). In August, Dingding was branded an “abnormal enterprise” by the authorities due to illegal fundraising and cash flow problem, and was not able to return the security deposit to over 10,000 users. In September, when many users of Bluegogo bike found that their refund of security deposit was overdue, Chinese social media erupted in complaints about the company. With more than seven million bikes, Bluegogo was the third largest bike-share company in China and had expanded their business into Sydney and San Francisco. Nevertheless, the company failed last month in what analysts say is the sign the country’s bike-share bubble may be bursting, leaving thousands of users without their deposit back.

Over the past two years, China’s bike-share companies have grown in an astonishing speed and have taken over the streets with colorful bikes. However, it is clear that there has been far too many players backed by far too much venture funding chasing far too little profit in the sector. Moving forward, even well-managed and well-funded ventures like ofo will face an uphill climb. Many peole predict that ofo will eventually have to merge with its biggest competitor, Mobike, in order to stop burning money and focus on turning profit. Earlier this year, CEOs of both companies have made it clear that they would not consider a merger. However, since the landscape in China’s bike rental industry has been settled with ofo and Mobike accounting for 95% share of the market, the attitudes of investors behind these companies are growing more favorable towards a merger to end the costly competitive battle, according to Bloomberg. Will the two companies join forces to become a single leader in the industry? Will ofo be able to achieve its goal to turn a profit in 2018 under its current business model? How will ofo manage its many branches overseas and adhere to local policies? For now, the future of the company remains unclear.

Blue Apron’s Bust

To date, 18+ investors have put $199,400,000 into a company they believed would disrupt the world. In a pre-IPO regulatory filing, the company said it could be worth $3 billion, pricing shares at a range of $15-$17 and making it a unicorn. More recently, though, one of the co-founders stepped down as CEO, the company’s market value is $714.59 million, and as of December 5, 2017, at 6:26 pm EST, those highly-anticipated common shares are worth a measly $3.76.

Blue Apron was once a highly sought after and heavily funded food and beverage startup. Now, it’s the most recent company to go down in a string of failed initial public offerings. So, what happened?

In 2012, chef Matt Wadiak connected with Harvard MBA Matt Salzberg and engineer Ilia Papas, a duo looking to launch a food startup. In August of that same year, the three began hand-boxing ingredients, the first version of their product, in Wadiak’s New York City apartment. They shipped to their 20 closest friends and family members and found vast success.

The idea, and the company, took off. In February of 2013, Blue Apron received $3 million of funding in its Series A round. Series A follows seed capital, the initial funding round that raises cash for market research and business development. Blue Apron received $800,000 in its seed round from angel investors Traveon Rogers, Jason Finger, and James Moran. Angel investors “are affluent individuals who inject capital for startups in exchange for ownership equity or convertible debt” (convertible debt is a bond that the holder can either convert to shares in the company or cash out at the equivalent amount). These three investors–a football player and two entrepreneurs–saw something in Wadiak, Salzberg, and Papas. They invested in the founders themselves and an idea that could confront an industry ripe for disruption: food.

The hefty $3 million from Series A financed the optimization of Blue Apron’s product–meal-kit deliveries–and user base, growing the number of subscribers much higher than those first twenty friends and family members. This round saw action from Greycroft Ventures, Graph Ventures, First Round Capital, BoxGroup, and Bessemer Venture Partners, all of which are venture capital firms.

Venture capital has a relatively short history. In America, companies were originally funded heavily by debt. This began to shift in 1811, when New York established limited-liability laws, making it so that shareholders wouldn’t be held liable if companies went bankrupt. These new laws, in addition to the development of information systems that reliably report the status of a company to potential investors, are what allowed funding via equity to come to fruition. Railroad companies were some of the first companies to be funded by equity. Since their shares were tied to tangible assets–trains, train tracks, etc.–people were more keen to invest in them because they could always sell these assets as direct materials if the company itself went bankrupt (Salon).

Henry Goldman (yes, relation to Goldman Sachs) next introduced a way to underwrite securities for companies without tangible assets like railway cars, deriving market value from a company’s earning power. Goldman’s valuation process was used mainly for merchandise and retail companies. Tech companies couldn’t borrow from banks or raise capital because people didn’t know how to value them or if they were reliable companies. Thus, private equity was born. These tech companies were too high risk for the typical methods of funding, so they turned to private, wealthy individuals (Salon).

The invention and mainstream adoption of personal computers ignited an explosion of startup companies seeking venture capital to fund their early growth stages. Venture capital is special because it mainly funds new companies and ventures who are looking to raise early stage funding. This type of investing can be done by individuals (Angel investors), investment banks, or other firms, funds, or financial institutions. VC can yield extremely high returns, but is also very high risk.

The venture capital phenomenon gained even more traction with the invention of the internet, ultimately leading to the formation of a dot com bubble. Venture capitalists were investing millions of dollars in any company that ended in .com. These new internet companies, however, wouldn’t produce earnings or profits for several years, so their valuations were based purely on speculation.

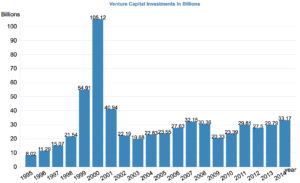
Graph: Data Science Central

As seen in the graph, U.S. venture capital investments reached an insane high of over $106 billion in 2000. The following year, 2001, is when the dot com bubble burst. These highly speculated and overvalued internet companies could not meet the expectations of the VCs who owned equity in them, and eventually they tanked. Trillions of dollars of venture capital funding went under. The landscape since has recovered, yet in recent years has started to see an uptick.

In 2016, $69.1 billion of venture capital was invested across 7,751 companies (NVCA). Blue Apron actually skipped funding efforts that year, as it was anticipating going public. The company received their $3 million Series A funding (mentioned earlier) in early 2013, only to be met with another $5 million from Series B later that summer. The next year, 2014, brought $50 million in Series C, and the year after $135 million for Series D. At this point in time, October of 2016, Blue Apron was set to do more than $1 billion in annual revenue and was preparing to IPO. As reported in the unaudited income statement provided in Blue Apron’s 2017 Q2 Earnings Statement, Blue Apron did $482,900,000 in revenue in the six months ended June 30, 2017, which was up from 2016’s $374,022,000, but not close to being on track to make the projected $1 billion in a year. Once again the question arises, what happened?

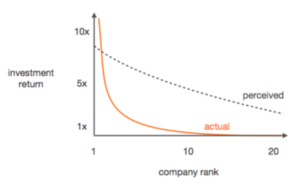
Chris Dixon, of prominent VC firm Andreessen Horowitz, applies something called the Babe Ruth Effect to venture capital. Babe Ruth, an American baseball player, frequently struck out while at bat. However, when he did hit the ball, he broke several batting records. Typically used in gambling and statistical logic, the Babe Ruth Effect explains that in venture capital, a few big hits are what often “return the fund.” VC investors will bet frequently on new ventures, of which only a few, or one, will have success of any magnitude. In fact, 80% of returns come from only 20% of the deals (CB Insights). This follows a power law distribution. Most people expect companies and their returns to fall somewhat linear in rank v. return. In reality, the graph looks very different from this expectation. The highest ranked company typically performs exponentially better than the second highest, and so on and so forth.

Graph: Michael Dempsey, Compound VC

Power law distribution is prevalent in venture capital, as it is also seen across unicorn companies (startup companies valued at over $1 billion). When 100+ unicorn companies are ranked from highest to lowest valuation, a cluster of values dominates at one tail-end of the graph.

Graph: CB Insights, November 16, 2017

The top ten unicorns, including Uber, Snapchat, SpaceX, AirBnb, Pinterest, Dropbox, etc., represent $184 billion, almost half of the total valuation. Blue apron can as one of the following 70 unicorns. Its valuation falls between Trendy Group International and Proper Marketplace, all three of which are companies or relatively similar valuation size. Because the distribution follows power law, the first few unicorns have the highest valuation by exponential values, followed by the rest of the unicorns. The tail trails off with most companies at almost the same valuation.

Valuation and market capitalization are two different measures. Valuation is the estimation of a private company’s market value. It is what these unicorn statuses are based on. Companies like Uber, who are still private, have no measured market value, so they must go off of valuation. Dash Victor, former Square accounting manager, explains that a company’s valuation can be calculated by multiplying the price paid per share at the latest preferred stock round (for Blue Apron this is their Series D funding round) by the company’s fully diluted shares, which consists of outstanding preferred shares, options, and warrants, restricted shares, and potentially an option pool. Before going public, Blue Apron had a proposed valuation of just under $3 billion. Its current market capitalization, calculated by multiplying outstanding common shares by the current stock price, is only $710.79 million.

Differences in the way these two numbers are calculated can be attributed to some of Blue Apron’s woes. In market capitalization, only common shares (stock sold at IPO in addition to preferred shares converted to common shares at time of IPO) are used in calculating the total. Valuations, on the other hand, include outstanding options, warrants, and restricted shares. Additionally, a company’s valuation is based on preferred shares, which as titled, have preferred options over common shares, like in some cases guaranteed pricing upon exit. Victor explains that valuing a private company using this method is like “valuing a concert by taking the price of a front row seat and multiplying it by every seat in the house.” The premiums involved make it difficult to compare a company’s valuation to its market capitalization.

Valuation/market cap discrepancies were nowhere close to Blue Apron’s only problem. The year 2013 saw record highs for the volume of global VC investment, the majority of which was in companies in early and seed stage funding. Money was cheap, markets were overconfident, speculation was high, and this venture capital funding was easy to obtain. VC firms were investing in more and more companies, and according to the law of distribution, lots of these companies were bound to fail.

Graph: Global VC financing volume into technology companies by stage. (TechCrunch)

Blue Apron credits itself as an American ingredient-and-recipe meal kit service. When asked to define Blue Apron, a past subscriber coined it simply as a “food service.” Blue Apron is a subscription service that delivers semi-weekly, perfectly portioned ingredients and step-by-step recipes. Their vision claims a they’re on a quest to create better standards, regenerate land, eliminate the middle man, and reduce waste. The past user, Bella, said she and her father subscribed as an easy way to transition into being a single parent family. Her dad wanted to continue providing home cooked meals for her, but he didn’t have time to devote to grocery shopping, meal planning, and ingredient prepping. They subscribed for the convenience of the product, not the vision.

Another problem Blue Apron faced in going public was this current environment of hyper convenience. It seems as if every new product or service provides people with something to make their lives easier. This abundance of convenience is becoming oversaturated. The Los Angeles Times’ Tracey Lien writes that new ventures aimed at solving “seemingly trivial problems” have increasingly been popping up. This is due to powerhouse startups–Facebook, Google, Snapchat– already picking the “low-hanging fruit of the startup economy.” This is why the world had a $700 juicer and has a sock company that has received $110 million in funding. With lots of investment cash and copious amounts of wannabe founders, the startup economy has seen an increasing number of companies founded not to solve pressing world issues, but instead the trivial issues of the upperclass. This is what accounts for the hyper convenience in U.S. products and services. People no longer feel that delivery or subscription services are special. They’ve become desensitized to these luxuries, and no longer give them much value.

Another dilemma in the obsession with startups and their culture is the way in which they is communicated. For starters, the media defines almost every new venture, Blue Apron included, as a tech company. Blue Apron is a subscription service, but its products lie in the realm of the food and beverage industry. It can be classified as a delivery or ecommerce company, but to strictly define it as a technology company would be inappropriate. America is obsessed with technology, so consequently, startup coverage is heavily focused on tech companies. But with no real parameters for determining what it means to be “tech,” metrics and numbers can be misconstrued. A food and beverage company should not be expected to perform the same as an SaaS company. Similarly, an apparel startup should not be anticipated to live up to the performance metrics of a fintech company. Fortune’s David Meyer was wrong to compare 2017’s worst IPOs–Snap, Inc., Blue Apron, and Stitch Fix–all as technology companies.

Blue Apron’s meal kit delivery was a good idea. It probably could have done well in certain high income markets. However, it was overvalued, overfunded, and over speculated, leading to an unsatisfactory initial public offering. The state of American venture capital is at a tricky crossroads. Hundreds of trivial companies are being funded, leading to increasingly inflated valuations. Very few of them will IPO, but of those that do, they often face a rude awakening when their market capitalizations do not match their private valuations. The current obsession with tech, VC, and going public could potentially create drastic consequences for the American startup economy.


Has Hollywood Blackout Really Improved Chinese Domestic Film Industry?

For some Chinese students studying in the United States, a lot of Hollywood movies might not be accessible for them to watch in movie theaters, if they decide to go back home for vacations. Spider-Man: Homecoming, for example, was released in the United States on June 28, 2017, while the release date for this film in China was September 8, 2017. Thus, for Chinese international students who went back home for summer vacation in May and return back to America in September, they might miss screening period in both countries. Such over two months delay is referred as the practice of Hollywood blackout in Chinese film market, or Chinese domestic film protection months.

[The history of Hollywood blackout period]

The Chinese government has never released any written document to acknowledge the official existence of this Hollywood blackout months, and even in 2012, the Vice Director of Chinese State Administration of Radio, Film, and Television Jin Tian denied in an interview that the Chinese government has even intentionally protected its film industry. Tian said the film market in China is free and is determined by consumers’ demand. However, ChinaDaily,NetEase Entertainment, and PeopleDaily all traced the idea of Hollywood blackout back to 2004. When Chinese movie House of Flying Daggers was released in July of 2004, the Chinese State Administration of Radio, Film, and Television gave an oral order to all Chinese theaters that while House of Flying Daggers was on screen, no Hollywood movies were allowed to compete against. The Spider Man 2 and Shrek 2 both got pushed off release date in China. The order worked effectively, as House of Flying Daggers garnished $92.8 million, which was the second highest box office in China that year and the highest box office for domestic movie in China that year. It also broke the record of the highest box office for Chinese domestic movie. In an interview conducted by Sina Entertainment, The Director of Chinese State Administration of Radio, Film, and Television Gang Tong praised the marketing operation of House of Flying Daggers. He said, “this model helped Chinese domestic film industry.”

Consequently, such model has kept since then and became so-called Hollywood blackout since Hollywood movies are major component of Chinese imported movies. According to ChinaDaily and NetEase Entertainment, aiming to support Chinese domestic film industry, during summer vacation (June to August), Spring Festival, and National Day holiday week, Chinese government discourages theaters to put on foreign movies, especially Hollywood blockbusters, to compete against domestically made Chinese movies. The term “Chinese domestic film protection months” was created by media and film industry, not an official term.

[How has Hollywood Blackout performed in China]

The Hollywood Blackout has been active in Chinese film industry for twelve years so far.

The Hollywood Blackout did help Chinese movies such as Aftershock and The Founding of a Party to end with an impressive box office.

BUT has Chinese domestic film industry as a whole enjoyed the protection and improved since then?

Not really.

According to Hollywood Reporter, since 2012, the Chinese government only allows 34 imported movies on screen each year. In addition to this quote and the Hollywood Blackout, the Chinese government also has applied strategies such as putting big name Hollywood movies at same period; thus, they are in head-to-head battles to decrease Hollywood movies’ box office.

According to Shenzhen Daily, the Hollywood Blackout also resulted a negative competition environment for Hollywood movies since all delayed American movies will massively emerge on theater at the end of August. Shenzhen Daily said Warner Brothers tried to contact China Film Group, a State-owned enterprise which is the only government-authorized importer of foreign films, to delay the opening of “The Dark Knight Rises” to late September, so it would not combat with its another movie “The Amazing Spider-Man” at same period. The Chinese government did not agree. They were both released on September 3rd. They both harmed each other’s box office.

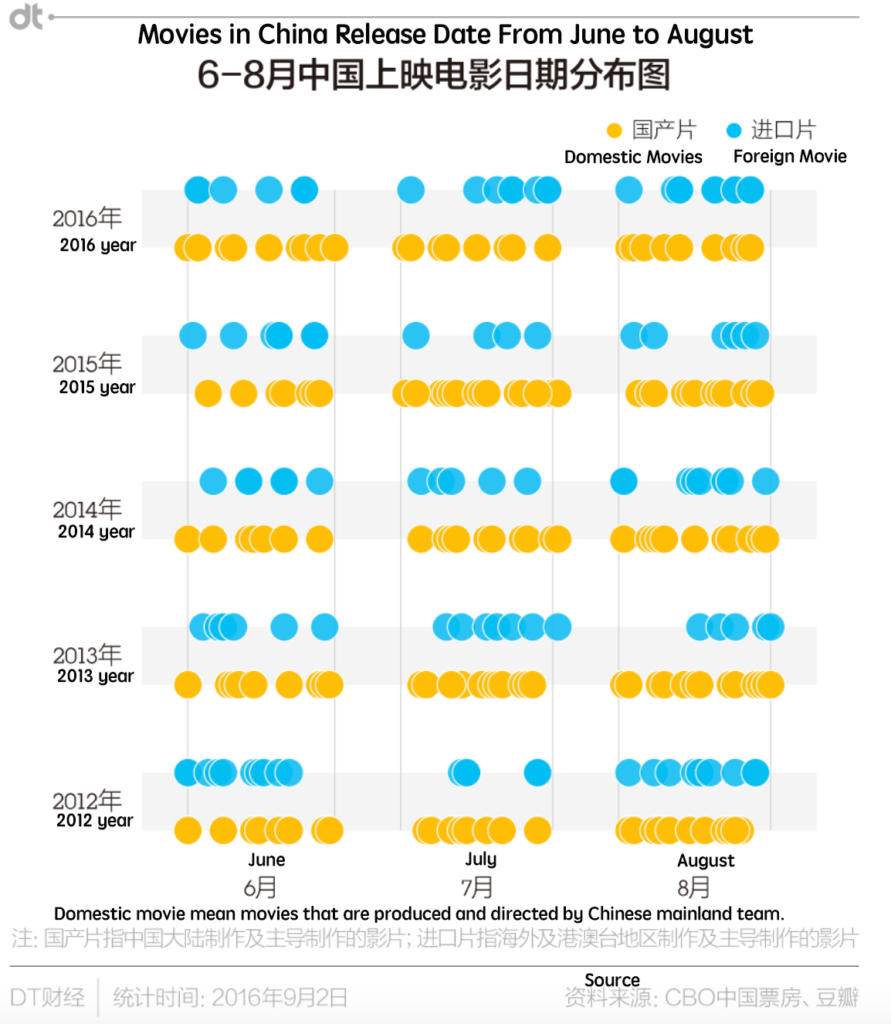
Here is the Chinese release date of movies from June to August. The blue dots represent foreign movies, while the yellow dots represent Chinese domestic movies. Clearly, from June to August, there were much more domestic movies than foreign movies on screen. However, the above graphic also indicates that the Hollywood Blackout is not strict as it stated. In July 2013, for example, there was still a lot of foreign movies. BUT Soho Entertainment argues that most of these foreign movies during “Hollywood Blackout period” are not competitive Hollywood movies.

Did Chinese domestic film industry experience a boom during Hollywood Blackout?

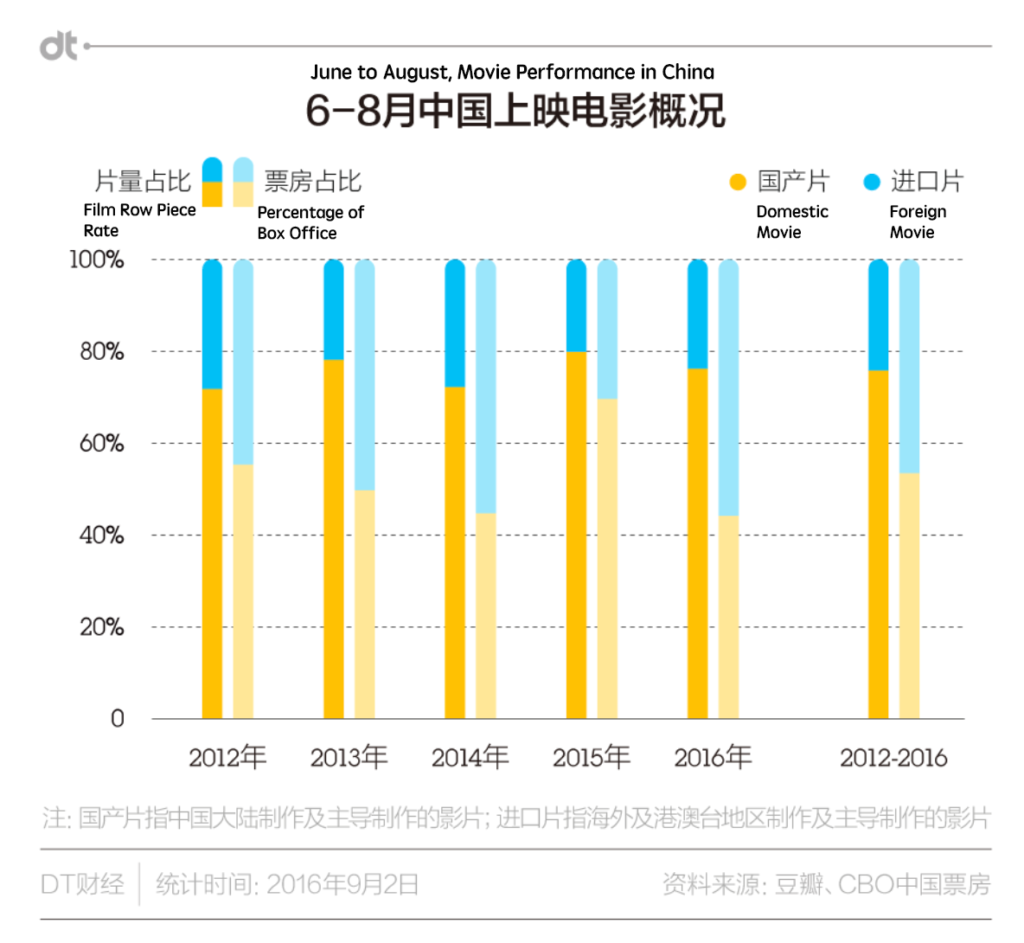
The statistics above presents the film row piece rate and percentage of box office for domestic movies and foreign movies during Hollywood Blackout. The film row piece rate indicates the rate of screening of a film in cinemas within a specified time period, which is calculated by dividing the number of screenings of a film in cinemas within a specified time period by the total number of film screenings in cinemas within the same period. The above chart clearly tells that even the film row piece rate of Chinese domestic movies is generally 3-4 times that of foreign imported movies during Hollywood Blackout period, the foreign movies still could share box office half and half with Chinese domestic movies. The only exception is 2015, which was a clear winning case for Chinese domestic movies, but that momentum did not keep in 2016.

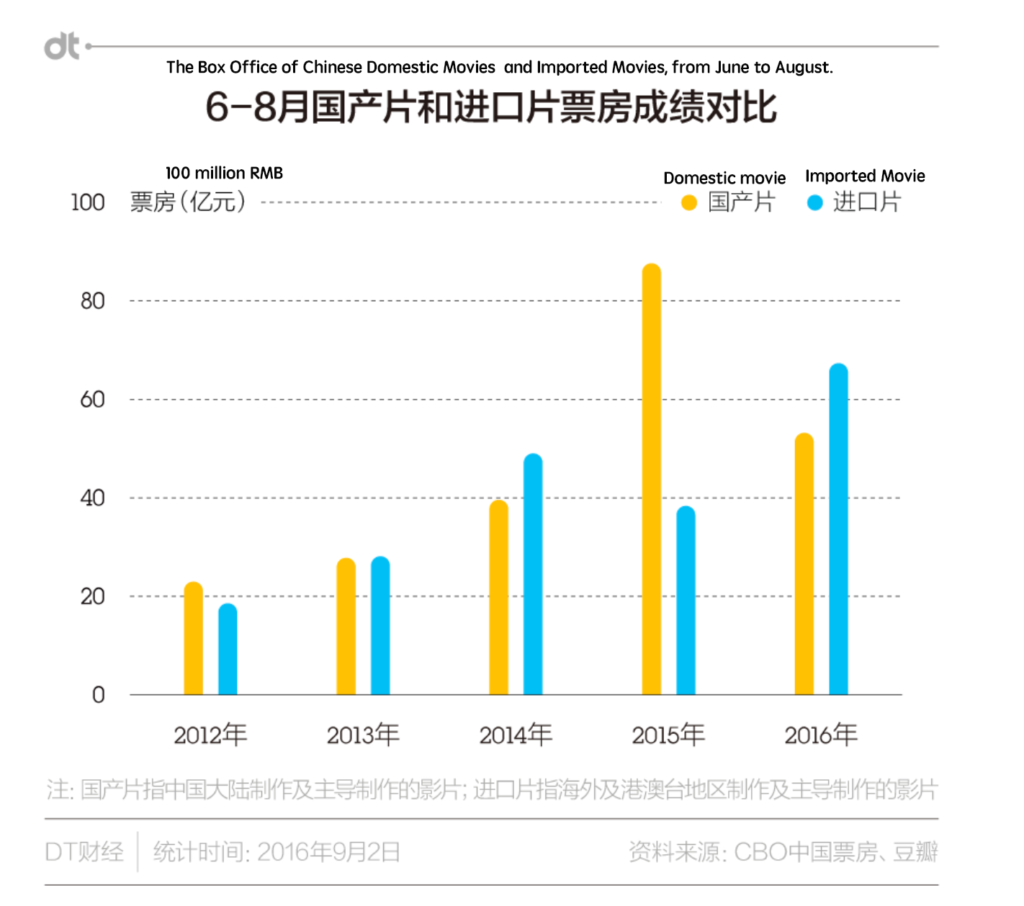
Here is a direct comparison of box office between domestic movies and imported movies during Hollywood Blackout Period. Again, 2015 is the only year that domestic movies took significant advantage.

[What Happened in 2015?]

There was a clearly huge boom of Chinese domestic film industry in terms of box office. What happened in 2015? Is this year an isolated case?

According to CGTN, CCTV English Channel, a growing size of middle class and an expansion of cinema infrastructure contribute to this boom of Chinese film industry.  According to the State Administration for Press Publishing Radio Film and Television (SAPPRFT), “A total of 8,035 screens were installed in 2015 — a rate of 22 screens erected every day. China’s screen count currently sits at 31,627, while the number in North America is estimated at around 39,000.”

In an interview with Deputy Chairman of the Shanghai Film Association Shi Chuan, he said since more theaters and screens were built in smaller cities, more audience could go to cinemas. Furthermore, there was indeed a growing trend of the quality and diversity of Chinese domestic movies, according to Hollywood Reporter.Monkey King: Hero is Back, a 3D animated film based on a beloved classic Chinese story, received not only good looking in box office number but also a positive public review.

However, there was a huge controversy regarding to box office inflation, or even  it should be called fraud. Chinese movie Monster Hunt garnished RMB 2.43billion ($379m) in China and became the highest-grossing film not only during Hollywood Blackout period but also the highest in Chinese  history up to that year.Chinese state broadcaster CCTV addressed an issue that Monster Hunt might conduct box office fraud that many sold-out screenings were actually filled with empty seats. Later, the distributor of this movie, EDKO Film company, admitted that the company gave away RMB 40 million worth of tickets during the final 15 days of its run. In the past, it was a common practice for Chinese movie companies to offer “free welfare tickets” to young children, seniors, police, teachers and the disabled. However, film companies like EDKO took advantage of this welfare tickets and exploited this strategy in order to get their box office number higher.

When the record-breaking Monster Hunt hit in North America, it only got $468 per theater in the U.S., which was the lowest per-theater average of any new film that weekend.

Epoch Times published an article in 2015 that exposed some dirty truths of Chinese box office figures. The article also asserts that “an anonymous executive at a film distributor spoke to Sina about his involvement in a large-scale box office ticket purchase. The distributor had spent over 60 million yuan ($9.7 million) nationwide to boost one film.” Some companies also asked their partners and contributors to buy more tickets. The reason is that “even if the movie didn’t earn much money by the end, the high box office figure may already have created opportunities for the listed movie company on the stock market.” Moreover, the article said high box office in short period of time, like reaching 100 million by the third day, can soon attract media attention. The more media coverage could boost a movie’s competitiveness in the market since people tend to go to watch high-box-office movies.

Another unethical practice mentioned in the Epoch Times article is bribing theaters. In exchange, theaters arrange more showing time for their partners, increasing their sales. “According to the Sina report, profits are split 43/57 percent between the film distributor and the theater, respectively.”

[Has the quality of Chinese movies improved?]

Not much.

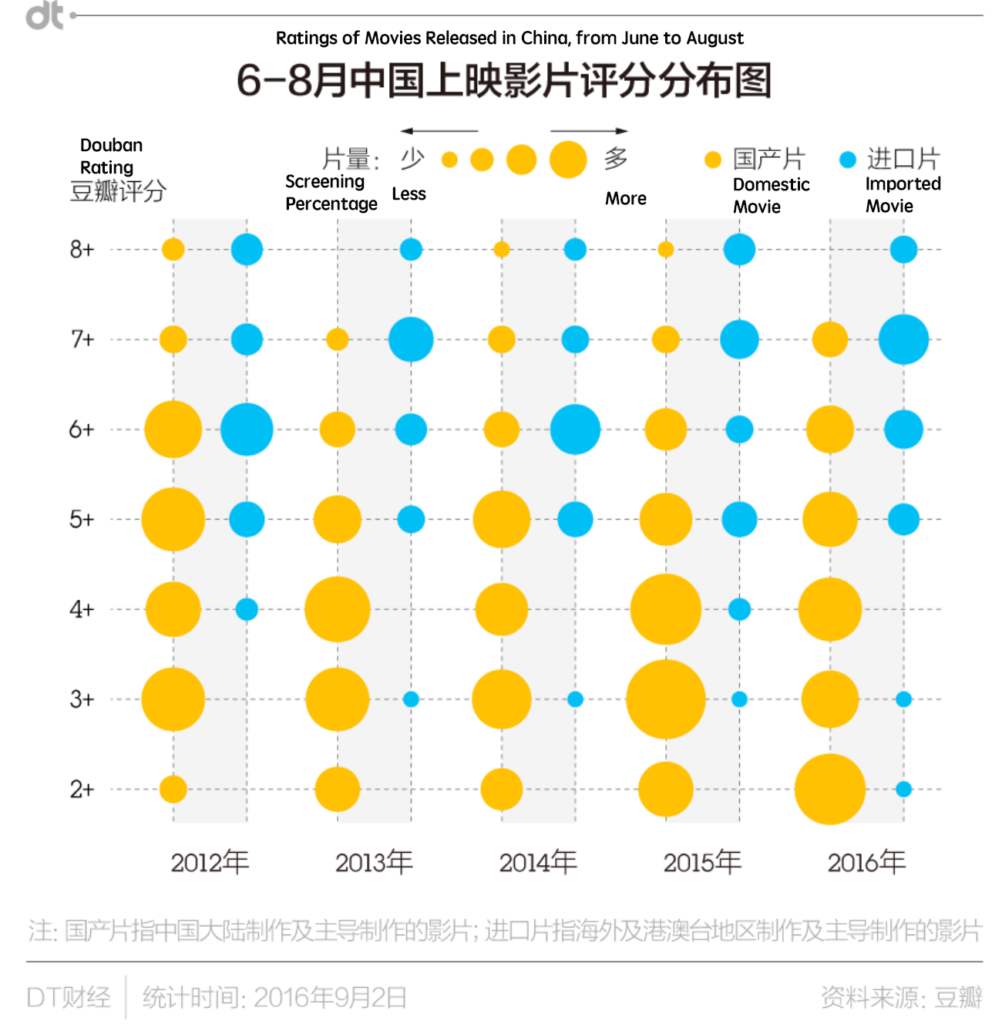
The above chart shows ratings of movies in China during Hollywood Blackout period. The source for rating is DouBan, which is a counterpart of Rotten Tomato in China. Larger dots represent more high screening percentage in theater. Chinese domestic movies with low ratings occupy large scale of screening time in theater. Chinese domestic movies with lower and lower ratings took larger and larger portion of Chinese screen, as the years went. In 2016, movies with 2+ ratings are the largest portion on screen while there was an empty whole for Chinese domestic movie with 8+ rating. It is not a healthy trend. The general public in China is disappointed by their domestic film products during Hollywood Blackout period.

In 2017, China Youth Daily published an article that criticized the effectiveness of Hollywood Blackout. The article first acknowledge the function of Hollywood Blackout that it helped Chinese film industry to claim dominance in the market, battling against Hollywood. It also saves time for Chinese film industry to grow, but the article also argues that current domestic film protection mechanism failed to either help small film business companies or boost high-quality movie products. It only created a domestic capital competition environment. The Chinese movie companies with largest capital won, not necessarily a victory for high quality movies. Consequently, Chinese audience tended to equalize Hollywood Blackout period as trashy movie period. They would wait to go to theaters after Hollywood Blackout. This contributes to the fall down of box office in 2016 during Hollywood Blackout.

[Recent Updates and How to Get Around it]

A good new for Hollywood. In 2016, due to a box office turndown, the Chinese government relaxed the quota for imported movies from 34 to 38. According to the Guardian the quota is set to keep expanding as part of trading deal between President Trump with Chinese President Xi.

Chinese audience is definitely a lucrative market for American film producers. The Fate of the Furious, for example, earned just $215 million stateside but collected $388 million at China’s box office.

2017 was a good year and also an interesting year for Chinese domestic movies during Hollywood blackout. Chinese movie Wolf-Warrior 2 grossed RMB5.68 billion($870 million). It defeated Chinese state-military propaganda movie The Founding of an Army. It shows that despite to the all regulation, Chinese audience are able to distinguish what is a better quality movie.

Felicia Chan, a senior lecturer at the University of Manchester said , “I’m not sure if ‘preventing too much Western influence’ is an argument any more at the Chinese box office, given the numbers Hollywood blockbusters are hitting in China … I suspect (the blackout) keeps the Chinese film industry buoyant, which then allows its players to have more negotiating power with Hollywood.”

There are two ways for American film producers to get around Hollywood Blackout.

The first one is to release the movie in May. The Hollywood Blackout only set restrictions that imported blockbusters are restricted to be premiered. However, American movies can get on screen in the mid of May prior to Hollywood Blackout period and can slip into June and July, which are hottest time for people to go to theaters. “Despicable Me 3”, for example released right before the blackout period, was the only Hollywood film on the top-grossing list of 2017.

The second way is to co-produce a movie with a Chinese film company. Then, it will not be considered as an imported movie during the Hollywood Blackout and also be exempted from the annual quota of imported movie.

 The Hollywood Blackout could be viewed as a Chinese tariff on imported movies to protect the Chinese entertainment industry. It intended to create an environment for Chinese film companies to grow before they face competition against western counterparts. However, instead of taking this opportunity to improve, Chinese film companies actually were spoiled by this protection period. More and more trashy quality movies are taking larger and larger portion of screening times on theater. The box office has become floated and misleading. Small and Middle Chinese movie companies are not benefited. It becomes an unhealthy market of playing capitals and money that discourages movies’ quality but focuses on making money in a short period of time.


The “Good” Signs That We Are Ignoring

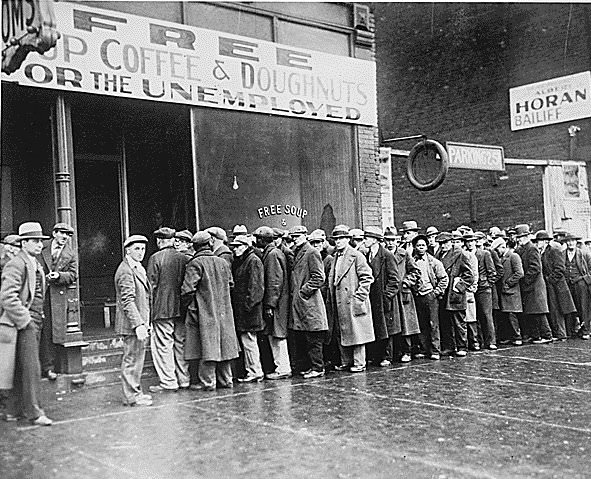
The Great Depression. People waiting in line to eat for free. Source: http://reason.com/blog/2012/11/21/why-are-a-record-number-of-americans-on

The Great Depression was a scary time for America. A time full of poverty, hopelessness, fear, and especially, unemployment. Of course as economies tend to do, we were able to create stability, improve employment, increase hopefulness, and get through the Great Depression. We proved that we truly are the “land of the free and home of the brave,” emphasis on the brave. If we were able to get through the Great Depression, we could get through pretty much anything the economy threw at us, right? Wrong. Fast forward to the Great Recession of 2008 and it felt like, once again, that there was no hope. No hope for economic freedom, no hope for stability, no hope for anything. It felt how the photo to the left probably makes you feel. Millions of Americans lost their jobs, and the world was impacted by Wall Street “hotshots,” who thought they knew everything and simply would never lose the “game” of life. Well, life should never be a “game,” especially when that game ultimately affects millions of people. Case in point — ­­the housing crisis and the declared bankruptcy of the Lehman Brother’s. Wall Street was and is shady.

Since the 2008 recession, markets have been on the rise. Stock markets are looking strong, consumer spending habits are great, and unemployment rates are at an incredible low of 4.2%. That said, it doesn’t mean we should keep following the yellow brick road. I’m all about positivity, but it feels like we are replaying history. Before the Great Recession, Wall Street bankers were ignoring the “good” signs and thought, “hey the markets are hot, housing is through the roof (no pun intended), and we are making millions of dollars. Nothing to worry about here.” Meanwhile, thousands of people were starting to get big houses they couldn’t afford, and so the deep, dark rabbit hole began.

Are we ignoring the “good” signs again? If we look back at history, the truth of the matter is that we are overdue for a recession. Our “low” unemployment rate isn’t as low as we think, so it’s time to stop ignoring the “good” signs and start figuring out how to help our economy….before it’s too late (see picture below).

Source: http://money.cnn.com/infographic/economy/the-us-economy-to-the-brink-and-back/index.html

The “Good” Signs That We Are Ignoring –– Longest Economic Recovery

This is almost the longest we have been in economic recovery since a recession. If we look at history, we are due for another economic recession. History tends to tell a story, so why are we choosing to ignore it? While it is great that our economy has showed strength after the Great Recession, history proves that recovery can’t last more than a decade before seeing another economic recession. America has gone through 33 economic recessions, but the Great Recession was the first one that was as distressing as the Great Depression (hence the name).

Some economists are predicting another Great Recession after seeing such long economic recovery. What goes up must come down…? Even Barclays Capital is calling it a “Hakuna Matata” market. Everything is going up. The market isn’t worried” (Rapoza, 2017). Well, if I remember Lion King correctly, I started to cry when Mufasa died. All jokes aside, with everything going up, all the “good” signs are being ignored. This has been one of our longest economic recoveries, and even Janet Yellen, prior chair of the U.S. Federal Reserve believes we will experience more “major financial crises in our lifetime” (Rapoza, 2017).

While the length of economic recovery doesn’t really feel like an important indicator in the eyes of many people, it matters more than we think. Banks tend to “lower their standards over time [and] at the end at the end of very long expansions, banks and finance companies are willing to lend to almost anyone, because they become overly optimistic” (pbs). Kind of sounds like a similar situation to the housing crisis, doesn’t it? This is what is now happening with U.S. car loans.  (Please see the example of how an industry can affect the economy, detailed in deck at end of presentation). According to Forbes, “a severe market crash will be followed by no growth in the U.S., possibly even two quarters or more of contraction.” Few are actually predicting this “crash” and ignoring the “good” signs similar to the 2008 Great Recession.

The “Good” Signs That We Are Ignoring –– Unemployment Rate

When the Bureau of Labor Statistics releases its employment information, many people are quick to focus on the unemployment rate since it’s a significant sign of how an economy is doing. Well, our economy is only showing “good” signs of low unemployment rates varying between 4.1-4.2%. Do most people, however, know what the unemployment rate consists of? The unemployment rate is the share of the labor force that is jobless, expressed as a percentage (investopedia). This percentage includes people actively seeking work. The percentage fails to mention the pool of people who are neither employed nor actively seeking work because of weak job opportunities (Economic Policy Institute). Thus, unemployment numbers are actually higher than we think. If we really dive into the numbers (which will be explained in more depth on the attached deck at the end of the post), we will quickly learn that we are leaning towards another recession. In fact, Trading Economics is already predicting a 6% or higher unemployment rate in 2020. Since October the number of long-term unemployed (those jobless for 27 weeks or more) was little changed at 1.6 million, and it accounted for 24.8 percent of the unemployed (Economic Policy Institute). Continuing jobless claims in the U.S. increased to 1,957 in the final week of November, after being 1,915 the week prior (Trading Economics). People who are actively seeking work aren’t getting hired and are entering into a new pool of people, as mentioned above. These are a pool of people who aren’t being accounted for within the “good” signs of our economy.

                                 Source: Google Images

The Ugly Truth

The truth of the matter is that we are overdue for a recession. The proof is in the pudding. This is the longest our economy has been in economic recovery, and it seems like our “low” unemployment rates are unparalleled, but we are ignoring the fact that so many Americans can’t find a job. The worst part is that it feels like President Donald Trump is not ready to handle an economic crisis. In fact, “Many Republicans in Congress are firmly against dramatically increasing the size of the federal budget and railed against the last stimulus bill. And given that interest rates are so low already, the Federal Reserve would not be able to cut rates by much” (The Atlantic). Seeing the trend that Trump is taking with his presidency, it is possible that he is the one landing us in our next recession, and he won’t be able to get us out of it. If our predictions are right and we find ourselves in an another economic recession within the next year, it will prove truly damaging for so many Americans. According to Forbes, 61% of Americans do not have enough money saved to cover six months of living expenses, 49% of Americans are currently living paycheck to paycheck, 68% of all respondents’ investment strategy does not account for a recession, and 64% of Americans do not have secondary sources of income. Essentially, if we land in another recession, YES we will get through it, but we will go through a lot of pain in the process. Back to hopelessness, back to more poverty, back to skyrocketing unemployment rates, and back to the pain of losing your economic freedom. I am not an economist, far from it in fact, but I do think it is important to inspect the “good” signs that our economy is projecting, so we can avoid repeating a traumatic economic history. Here’s to you America…. land of the free and home of the brave.

(This medium does not support the viewing of the deck that goes with this article. Please refer to your e-mail if you wish to view the supported deck). 

Sources:

https://www.theatlantic.com/business/archive/2017/03/is-the-economy-overdue-for-a-recession/519180/

https://www.pbs.org/newshour/economy/get-ready-economic-recession-coming-2017

https://www.forbes.com/sites/kenrapoza/2017/06/29/heres-what-would-happen-if-u-s-faces-another-recession/#13dc75457a79

https://www.forbes.com/sites/axiometrics/2017/04/21/is-a-recession-coming/#57ecbd6e6103

https://www.thebalance.com/could-the-great-depression-happen-again-3305685

https://tradingeconomics.com/united-states/continuing-jobless-claims

https://www.bls.gov/news.release/pdf/empsit.pdf

https://tradingeconomics.com/united-states/unemployment-rate/forecast

http://money.cnn.com/infographic/economy/the-us-economy-to-the-brink-and-back/index.html

http://reason.com/blog/2012/11/21/why-are-a-record-number-of-americans-on

http://www.nber.org/cycles/cyclesmain.html