Ubernomics

Learning economics is a difficult undertaking for students like myself. Unlike biology or mathematics, economics is not tangible or easy to visualize. Even its definition–the study of scarcity–leaves me puzzled about the nature of economics as a field of study.

However, Uber, a global ridehailing service, is an economics student’s saving grace. Uber’s market is an ideal for what we want the economy to look like. It has characteristics of a competitive market: low barriers for entry, many buyers and sellers, and somewhat homogenous services. Most importantly, the prices riders pay are a direct response to supply and demand. Uber is an excellent example with which to apply numerous economic terms and theories.

Take, for example, consumer surplus. According to Britannica, consumer surplus is “the difference between the price a consumer pays for an item, and the price he would be willing to pay rather than do without it.” It’s a number that has been impossible to estimate in the real world (unless you are a fan of the Infinite Universe theory) until now. Steven Levitt, an economist at the University of Chicago, was able to estimate a consumer surplus measurement using Uber’s data, which collects information about completed trips and those that were considered (user opened the app) but never taken.

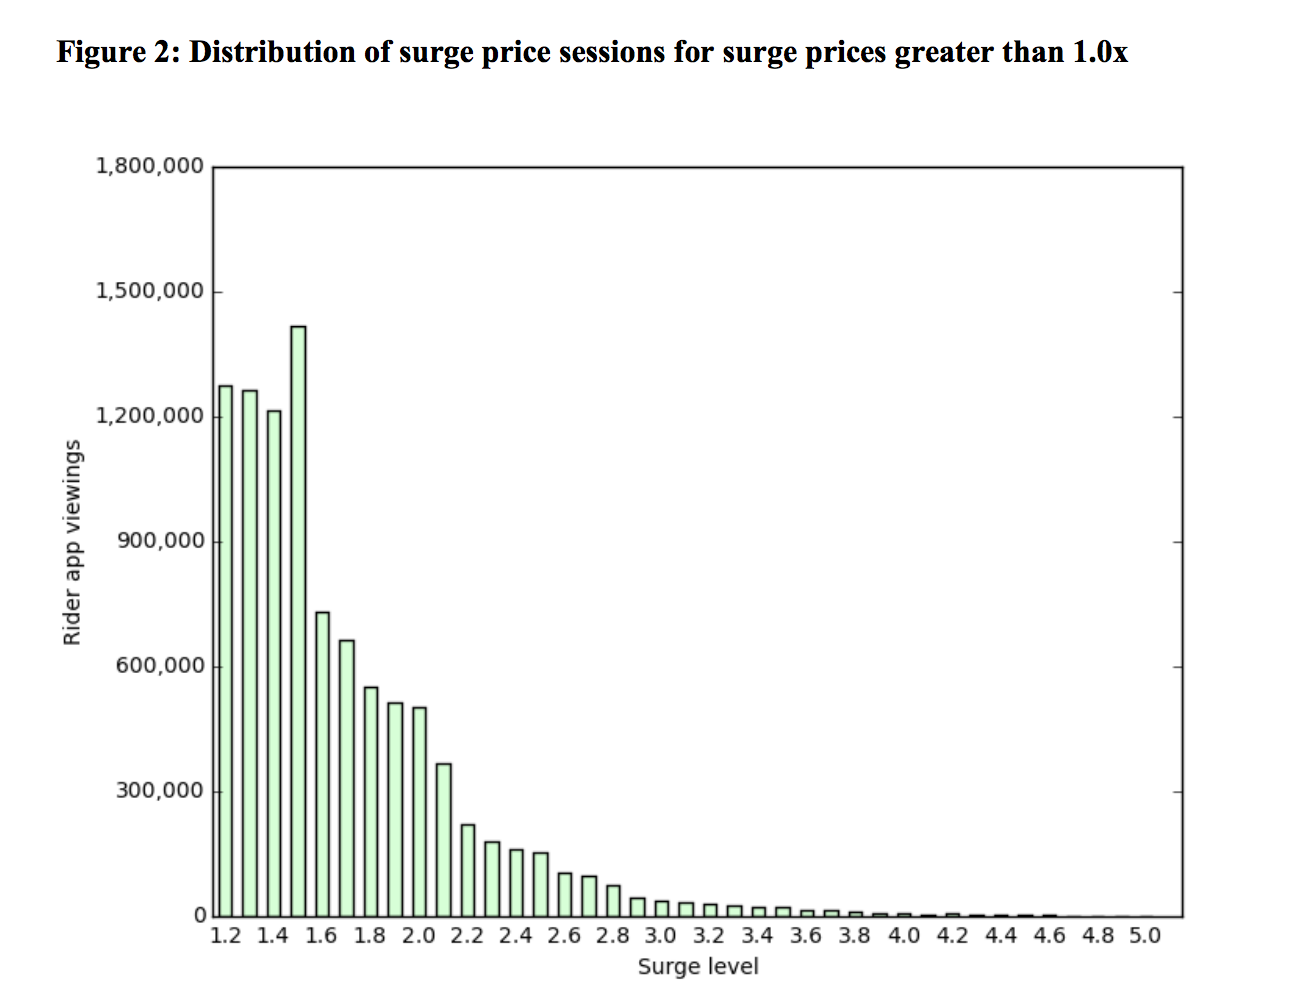
On Freakonomics’ podcast from September 7, 2016, Levitt explains that even though Uber has an algorithm to come up with the ideal prices of surged rides, the company instead only multiplies the cost by tenths (1.1, 1.2, 1.3) for customer convenience. This series of minute discontinuities allows for the estimation of the price-sensitivity of Uber riders.

Now, what is price sensitivity? In Greg Ip’s The Undercover Economist, he explains the concept: “when I raise the price, how much do my sales fall? And when I cut the price, how much do my sales rise?” So, it’s the extent to which the price of something affects if a person will buy it.

Levitt examined Uber’s database of many similar consumers facing incrementally different prices to examine the price sensitivity of the riders (at what price will they leave the app instead of booking a ride). Levitt also used this data to estimate Uber’s consumer surplus. He extrapolated that in 2015 the consumer surplus in the United States was $7 billion, which means that riders were willing to spend $11 billion on rides, but in reality only paid $4 billion.

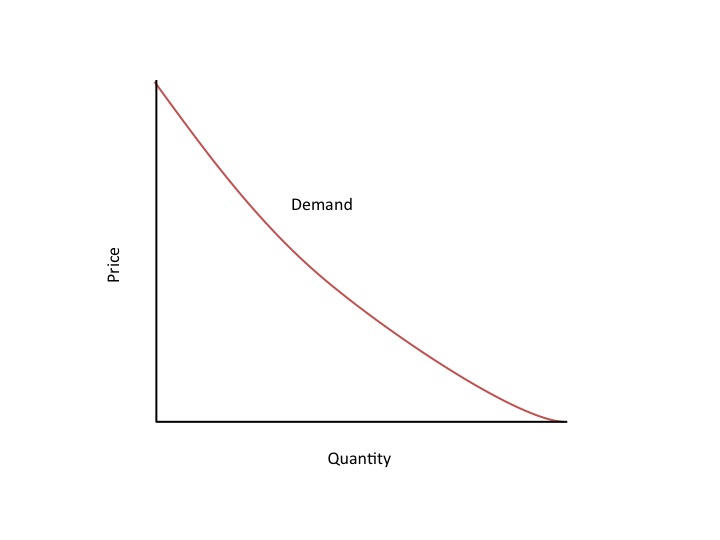
The “Regression Discontinuity Analysis” that Levitt used to estimate consumer surplus can also be used to illustrate a real-life example of the demand curve. Britannica explains that the Demand Curve is a graph illustrating the relationship between price and quantity. The curve slopes downward from left to right because price and quantity are inversely related. It’s an artificial construct that economists use to examine real-world situations. But once again, Uber can be of assistance. Uber’s price surging data, all of the small jumps in price faced by similar consumers, can be added together to discover an instantaneous demand curve. When there is no surge, the price of rides is average and so is the amount of drivers. As an oversimplification it can be noted that demand is at equilibrium. When surges occur, prices go up and and the amount of drivers available declines, so demand is high.

Uber has been in the news a hundred times over for all of its scandals and controversies. But Uber deserves more positive press–it led me to pass my econ quiz!


The Effects of Hurricane Harvey on the National Economy

The devastation of Hurricane Harvey on Houston, the 4th largest city in the United States, has been predicted to negatively impact national activity and employment, according to Chad Moutray, chief economist for the National Association of Manufacturers.

The damaging effects of Hurricane Harvey left physical scars on Texas, and to an extent, a few bruises to the national economy. While some can argue that huge widespread events actually spur economic re-structuring, the Federal Reserve reported that industrial production decreased by nearly 1% In August from July. To put this number to scale—this decline was akin to that during the 2008 recession. This decrease in production was attributed to less oil drilling and petroleum refining.

Due to a decreased supply of oil, gas prices rose, and as a result, consumers have less money in their pockets to spend on other things. This accounts for the “C” component in the GDP equation.

At a rudimentary level, economists expect overall output to decrease in short run because of storm-related job losses, but note that it will ultimately increase in future quarters when jobs and structure start to come back. In the long run, however, the Harvey won’t drastically affect the big economic indicators: GDP, unemployment, and inflation.

The Wall Street Journal forecasted that Hurricane Harvey will “reduce the pace of job gains by about 27,000 jobs a month” in Q3. By Q1 of 2018, forecasters predict a boost of 13,000 jobs. Economists also predict GDP will fall by 0.3% in the third quarter.

To add salt to the wound, most homeowners and business-owners did not have flooding insurance, which additionally decreases their ability to spend and invest. It’s almost analogous to the effects of a stock market crash, says Constance Hunter, chief economist at KPMG.

Although the commerce department could not completely isolate the effects of Harvey on brick and mortar retailers, the weeks following the storm saw a mix of sales drops and increases. Necessity goods sales increased, including home furnishing supplies and grocery stores, while sales of non-necessity goods decreased. For instance, gas-station sales rose 2.5% in a month, due to higher oil prices. Internet sales fell a percent, the largest decline since Q2 2014. Another uptick to the equation is a 0.2% increase in auto sales, due to the loss of automobiles (a necessary good) from the storm.

Overall, a small dip in productivity will be seen for a quarter, due to rising oil prices, lost assets, and decreased consumer spending. Though only a short-term scale, consumer spending, which accounts for two-thirds of GDP, will still have a profound effect on the surrounding economic and regional locus.

Sources:

https://www.wsj.com/articles/u-s-retail-sales-fell-in-august-1505478885

https://www.wsj.com/articles/u-s-industrial-production-fell-in-august-as-hurricane-harvey-hit-gulf-coast-1505481802

https://www.wsj.com/articles/how-hurricane-harvey-will-ripple-through-the-u-s-economy-1504792802

Equifax Doesn’t Ring a Bell? Well it Should Because It Probably Affects You

Equifax Inc., one of three major U.S. credit reporting agencies, or in other words, a company who has access to your most personal information from social security number, driver’s license, to credit cards.

The company receives all of this personal data most likely from your bank provider, and their “data breach it discovered on July 29” (Wired), is one of the most high-profile security breaches in its’ history. In fact, Equifax stated that 143 million customers—almost half of America—were affected by this breach, and from that number, 209,000 of the U.S. consumers had their credit card numbers exposed.

So why does all this matter? Equifax has most likely put your personal information at risk of being available online. And this data “packaged together sells for upwards of $30 per identity on online black markets, according to Mark Nunnikhoven, head of cloud research for cybersecurity firm Trend Micro.” He adds, “it’s enough to allow cyberthieves to take over you online” (qtd. in CNN).

If this isn’t still clear to you, it means you probably won’t pass a credit check, thus, making it impossible for you to take out any loans. And on top of that, for example, “[if] someone gets a driver’s license in your name and runs a red light or gets a speeding ticket, you’re on the hook,” according to CNN. CNN adds, that “[recovering] from identity theft isn’t easy,” to say the least, and “you could have to provide months or years of information to clear your name.”

The potential for economic disaster is detrimental. So if you’re poor, you’re basically screwed. The worst part is, since “Equifax still hasn’t given reliable information on who exactly was affected,” according to Quartz, that means everyone has to play victim and take responsibility on minimizing potential damages—damages, again, ranging from “thieves using stolen identities to file taxes, obtain drivers’ licenses, run up medical bills or commit crimes” (Quartz)—this not only takes up time, but money.

In a 2016 survey by the Identity theft Resource Center, out of 300 participants who were victims of identity theft, “52% earned household incomes below $50,000 per year, and 33% earned less than $25,000,” as well as an average of “$1,343 in stolen assets” for the average victim for identity theft costs—and on top of that, “31% lost their home” (Quartz).

Now imagine if half the United States was affected, which is what Equifax put us in risk of. Sounds like another depression just waiting to happen. Basically, this Equifax breach can affect you in the most difficult of ways messing up your life in so many countless ways.

On top of its affect on us, who matters, Equifax’s “shares [dropped] more than 8 percent in after-hours trading,” according to Bloomberg. And following the massive security breach, Equifax executives sold “nearly $2 million in shares of credit bureau Equifax Inc,” actions compared to “insider trading,” said Reuters. These stock sales are currently being investigates by the U.S. Department of Justice, the Securities and Exchange Commission, as well as the Federal Trade Commission.

On September 15th of 2017, the Equifax released a statement on their site, announcing the retirement of their CIO and CSO, as well as offering “free credit monitoring and identity theft protection to all U.S. consumers.” If you haven’t already, it’s time to start taking some precautions.

Hurricane Harvey’s effect on the Economy

It is obvious that the tragic event of Hurricane Harvey has left thousands of families devastated, as it has destroyed billions of dollars’ worth of homes and properties. What is not so obvious, however, is the effect it will have on the U.S. economy. Although it is extremely difficult to accurately predict the impact a hurricane such as Harvey will have on the economy, economists are breaking down the impact by economic indicators.

According to the Commerce Department’s Bureau of Economic Analysis, Texas accounted for 8% of the total U.S. economic output with a GDP of $1.5 trillion in 2016. The cost of the hurricane is estimated to be somewhere between $70 to $100 billion.

Inflation is an important indicator of Harvey’s impact, exemplifies through the increase of gas prices in Houston. According to the AAA, the average gas price has increased from $2.35 to $2.66 a gallon. This number is expected to continue to increase more before settling down. The increase in inflation will have its own impact on consumer spending, forcing people to spend less money on secondary items.

Hurricane Harvey is expected to have an impact on initial jobless claims, or people filing for unemployment for the first time. Historically, we have seen an increase in claims about 2 weeks after a massive hurricane, such as Katrina in 2005 and Sandy in 2012. This could account for all the people who lost their jobs because of companies shutting down or working part time due to weather conditions.

However, at a more macro level, Harvey’s impact on the economy may not be as bad as it sounds. According to Goldman Sachs, the rebuilding of homes and properties in the future could possibly offset the damage done to the overall economy. Although in the short run it may seem harmful, in the long run, properties are going to require rebuilding. This will motivate construction companies and their workers to migrate to Houston for job opportunities.

It has only been a few weeks since the hurricane struck Houston, therefore only allowing room for predictions about the future of its economy. It will be interesting to see how the impact of this hurricane will compare to other historical hurricanes in the past. Will Harvey be the costliest? Will it have a larger negative impact on the economy, or will rebuilding efforts balance it out? We have yet to find out.

References:

http://www.foxbusiness.com/features/2017/09/07/how-hurricane-harvey-will-ripple-through-u-s-economy.html

http://www.businessinsider.com/hurricane-harvey-economic-impact-2017-8/#the-cost-of-harvey-1


The Economic Impact of Repealing DACA

On Sept. 5th, the Trump administration announced the repeal of DACA. As a part of the announcement Attorney General Jeff Sessions claimed that DACA has had a negative impact on the American economy, that is not correct. Rather, repealing DACA would hurt the economy.

Repealing this Executive order will not only lead to almost 800,000 undocumented immigrants who came to the united states as kids not being able to work legally and being at risk for deportation, but it will also have a negative impact on the size and growth of United States economy.

First, the actual act of repealing the excretive order will be expensive. The Cato Institute estimates that it will cost the federal government at least $60 billion over the next ten years to execute the repeal of DACA.

By rescinding DACA, the GDP would both shrink in size and growth. A Center for American Progress study estimates that the repeal of DACA would cause US GDP would shrink by $433 Billion over 10 years. The Cato Institute estimates that in that same time frame US economic growth would be reduced by $280 Billion. Both these studies show a dramatic negative impact on the American Economy.

The GDP would not be the only thing to suffer. A CAP study approximates that the contributions to entitlement would drop by $24.6 Billion.

DACA recipients are a key working age population, the average age of a DACA recipient is 22. As the overall American population ages and there are more people dependent on Medicare and social security we will need more people to pay into these programs. By eliminating DACA we are also eliminating a group that

helps keeps entitlements funded.

In general, the United States needs immigration in order to keep our

population pyramid in check. DACA has helped increased that vital working age population to help hold up our increasing top-heavy pyramid.

DACA will not only have a negative impact on national economy, but some states with large populations of DACA recipients will face even greater economic consequence.

California, the state with largest number of DACA recipients, would face an estimated $11.3 Billion annual GDP loss. Texas would also face approximately a $6.1 Billion GDP loss per year.

Venezuela – What happened?

Once a wealthy country in the 1970s, Venezuela is now experiencing political turmoil and its citizens are living in poverty. With over 298 barrels of proven oil reserves, why is Venezuela, the country with the largest oil reserve in the world, the poorest performer in terms of GDP growth per capita? What happened to one of the richest countries in Latin America?

  1. It’s ongoing economic crisis

Venezuela is now in its fourth year of recession. With the economy shrinking, the price of goods keep increasing. The price for a dozen eggs is equivalent to US$150. So, this means devaluation of their currency, the Bolivar. To put it into perspective, one U.S. dollar was 100 bolivars in 2014. In 2016, one dollar got you 1,262 bolivars. On top of this, years of the excessive government spending and poorly managed government programs led Venezuela to experience its worst economic crisis in history.

  1. The currency split

Venezuela established three different exchange rate systems for the bolivar; one rate for “essential goods”, the other for “nonessential goods and another one for its citizens. The two primary rates overvalue the bolivar, and the black market values bolivar near worthless. The government has tried increasing the number of bolivars to tackle this problem, but the money in circulation isn’t enough.

  1. Venezuela is running out of cash and gold

Venezuela is struggling to pay its bills. It owes approximately US$15 billion while its central bank only has US$11.8 billion in reserves. The oil company, PDVSA (Petroleum of Venezuela), is pumping less oil and is at risk of defaulting. China used to come to Venezuela’s aid and loan it billions of dollars at a time. But even China has stopped giving out cash. Interestingly, most of Venezuela’s reserves are in the form of gold and has being making debt repayments in the form of gold bars.

  1. Its hottest commodity, oil, isn’t “hot” anymore

Venezuela has the world’s largest oil reserves, but the problem is that oil is the only commodity it has to offer. Ninety-five per cent of Venezuela’s revenue comes from exports, so if it doesn’t sell oil, the country hasn’t got much money to spend. Venezuela’s situation went downhill pretty quickly when oil prices plunged in 2014. It’s been struggling to recover ever since.

  1. Government control

The Venezuelan government enforced strict price controls on golds sold in supermarkets. It also stopped food importers to cease importing basically everything because they would have to sell their products for a major loss. In 2016, the government stopped enforcing price control. However, prices are still so high that Venezuelans can’t afford even the most basics supplies.

There are many factors that have contributed to Venezuela’s economic and political turmoil. The challenge for the country will be to escape the cycle it is stuck in, and that’s only if they can sort out the state of their government first. There won’t be a quick fix solution, it will be long and arduous journey for the country.

References:
Article 1
Article 2

What Would the End of DACA Mean for the Economy?

The health of the United States’ economy is largely determined by the actions of the President and those appointed by him. Ever since Donald Trump’s presidency began, the country has held its breath watching the decisions he has made on behalf the U.S. people, hoping for the best.

Most recently, one of President Trump’s decisions is putting the country at risk of a huge economic decline. A few weeks ago, Trump chose to end the Deferred Action for Child Arrivals (DACA) program, which was put in place by Barack Obama to protect the children of immigrants who came illegally, from being deported. This decision would affect about 800,000 “dreamers” in the U.S.

While the DACA program’s future is still not officially decided, if no supplemental program is put into effect, the loss of all those jobs plus the government expenses could be detrimental to the economy. A study conducted by the CATO Institute concluded that the cost the federal government alone would suffer from deportation efforts over the next 10 years would total at least $60 billion. The overall economic impact would be over $200 billion.

In addition to the governmental costs that the end of DACA would bring, the U.S. GDP would also take a hit. The Center for American Progress conducted a study finding that without the DACA workers, the GDP would decline by $433 billion over the next 10 years.

This decline would be felt in certain parts of the country more than others. California, for example, employs about 188,000 DACA workers. If the program was terminated, the GDP in California alone would suffer a loss of $11.3 billion a year. Texas would lose $6.1 billion per year, and North Carolina would lose $1.9 billion a year.

FWD, a pro-immigration reform group, conducted a study finding that 91% of DACA recipients are employed. Many employers of Fortune 500 companies have been stepping forward defending the DACA program and advocating for Congress to put a stop to Trump’s movement. As Microsoft President, Brad Smith stated via a blog post, “These employees, along with other DREAMers, should continue to have the opportunity to make meaningful contributions to our country’s strength and prosperity.” He admitted that Microsoft knows of at least 27 employees who are DACA beneficiaries, including engineers, finance professionals and sales associates.

The White House has enacted a six-month delay to the end of the program to give Congress time to act and hopefully come up with another solution. Until then, dreamers will continue to protest, advocate and fight to keep their rights and avoid the eventual economic decline that would come from the end of DACA.

What Does the Fall of Retail Mean for the Country’s GDP?

It is no secret that consumer spending has shifted in the recent economic climate. Brick-and-mortar retailers are suffering under the pressure from e-commerce sites like Amazon. In the past year alone, there have been countless stories of Big Box retailers like Macy’s, JCPenny and more closing stores in an effort to remain profitable.

But does the fall of retail spending mean the fall of consumer spending altogether? Will the country’s GDP will be affected? While these are valid questions, the answer, in short, is probably not. Unfortunately, if the economy were that easy to predict, we probably wouldn’t have had the economic recessions that we have in recent years.

According to AP, consumer spending in the U.S. rose 0.1 percent in April, 0.2 percent in May and June, and 0.3 percent in July. These increases occurred in tandem with a 0.4 percent increase in incomes in June and a 0.5 percent rise in wages and salaries in July. Though these increases in consumer spending have been slight, the addition of the increases in income and wages is another good sign for the overall GDP of the country.

In 2017, the GDP has been rising consistently overall. According to Reuters, there was a 1.2 percent growth pace from January-March. With the increased consumer spending in the following months, GDP increased at a 3.0 percent rate from April-June.

Even with the growth of both consumer spending and the GDP in the US, some people are still concerned about the country’s economic activity overall. Consumer spending alone accounts for about 70 percent of the country’s overall GDP, according to economists, and those who are skeptical about the small growth numbers say it is not enough to evoke enough confidence for the future.

While consumers may not be spending their money on retail like they once were, the fact is they’re still spending that money somewhere. Some say healthcare spending has taken the place of retail spending for many, while some say the shift is in millennials wanting to spend their money on experiences, rather than material goods.

Regardless of the exact cause of the recent fall of the retail industry, consumers are still finding things to spend their money on, and that is the most important thing to maintain the health of the economy. As long as the overall GDP continues to rise and consumer spending is a contributor to that, the country is on a path to continue growing and prospering.

Retail Realignment – Good or Bad?

Having been around for centuries in the United States, the retail industry is no stranger to the economy we live in today. The industry is constantly experiencing ups and downs, depending on the styles, trends, and brands that are “in” at the moment. However, the industry is now experiencing something different – a revolutionary shift to e-commerce at a rapid pace. Recent studies show that just over half of the American population today prefers shopping online. I mean, who even likes spending hours at a mall just to find one t-shirt?According to the U.S. Bureau of the Census, as of this quarter, e-commerce retail sales make up 8.9% of total retail sales. Overall, this percentage has increased by 13.8% since 2000. As a result, retail companies are shutting down store locations, laying off employees, and some are even going under.

Just like almost any other advancement in technology, this disruption in the retail industry has had a direct effect on employment. According to The Atlantic, major department stores, such as Macy’s, have “shed nearly 100,000 jobs” from October 2016 to April of this year.

So how is it that thousands of jobs are being shed as a result of this transition, but yet we are seeing an increase in the number of jobs and wealth in America? Economist Michael Mandel believes that this shift towards online retail has actually had a positive impact towards employment. His studies show that the e-commerce market has created more jobs than the total lost jobs caused by the transition. But wait, there’s more! – These new jobs that are being created by the e-commerce sector are paying much higher wages than traditional retail jobs.

The statistics generated by Mandel assume that “general warehousing” jobs are directly correlated with retail sales. He uses the example of Amazon to justify his argument by saying that they employ 12,000 employees, which includes warehouse workers, rather than the 2,640 that the Bureau of Labor Statistics states, which does not.

Mandel might be up to something with his optimistic analysis, but it is truly very difficult to measure the direct effect e-commerce has had on employment. There are just way too many aspects, making it too complex to come to an accurate conclusion. However, it is always great to hear that we might actually be heading towards the right direction. Many people would argue – What will happen once robots start replacing humans in these warehouses? I guess we’ll just have to wait and see!


References:

https://fred.stlouisfed.org/series/ECOMPCTSA

https://www.bigcommerce.com/blog/ecommerce-trends/

https://www.theatlantic.com/business/archive/2017/04/the-silent-crisis-of-retail-employment/523428/


U.S. GDP Grew 3%, Fastest Growth since 2012

The U.S. Commerce Department said on Wednesday that the U.S. economy had expanded by 3% in the second quarter (April-June) of the year. It’s not only better than the previous estimate, 2.6%, but also a substantial boost from the first quarter’s 1.2%.


“The acceleration in real GDP in the second quarter primarily reflected upturns in private inventory investment and federal government spending and an acceleration in PCE that were partly offset by downturns in residential fixed investment and state and local government spending and a deceleration in exports,” according to the report. To sum up, consumer spending is basically the backbone of the second quarter GDP growth.

President Trump commented on the growth that he thinks the economy will “go much higher than 3 percent.” Economists and the media, however, are not too optimistic about future growth. In an analysis, the New York Times straight-out called it a “Sisyphean challenge”:

“There are several reasons that his goal is probably far-fetched, namely the country’s aging work force and slower population growth than in the past. Combine that with low productivity growth, and hitting Mr. Trump’s target begins to look like a Sisyphean challenge.”

The impact of Hurricane Harvey is minor, according to a CNBC analysis.

President Trump said on Wednesday, “on a yearly basis, as you know, the last administration during an eight-year period never hit 3%. So we’re really on our way.”

However, he is incorrectly comparing a quarterly growth to an annual growth. In this handy chart by Fortune, we can see clearly that quarterly growth during Obama exceeded 3% eight times.