Chonieconomics: The Men’s Underwear Index

Throughout the course of history, people have been caught with their pants down (so to speak) on various occasions by shifts in the economy—some sudden; some cyclical. Little did the gentlemen among these folks know that underneath said pants, was one of the more obscure metrics tracked as an indicator of the relative health of the economy.

The Men’s Underwear Index is, apparently, a real thing. So said Alan Greenspan in the 70’s.

underwear index_9 3

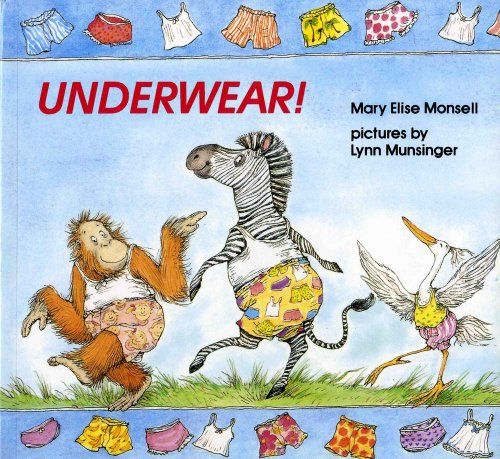
The orangutan, the zebra and the stork clearly lived in economic prosperity.

As we’ve discussed in class, economics often gets a bad rap because many people’s exposure to it consists of a bunch of old, white guys on TV talking about the most widely used economic indicator—the stock market—in what sounds like an alien language. However, despite it including the synthesis of a lot of real-time information, the stock market is a leading indicator (a measure of what people think is going to happen) and is, by nature, speculative. To some extent, the talking heads on TV are guessing, and they know it.

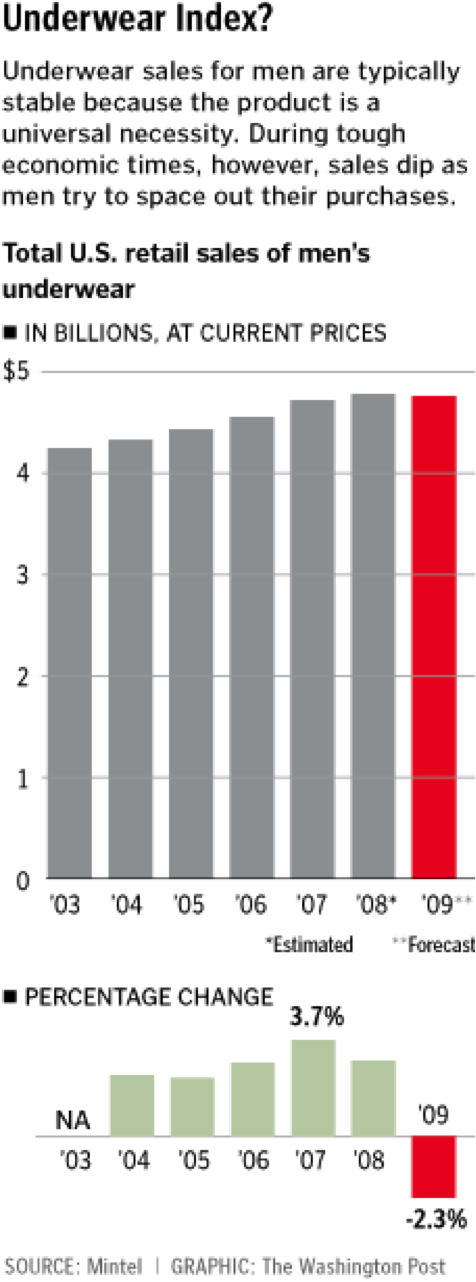
Chonies as an indicator, on the other hand, are referred to as lagging. (I know…sorry, gents.) A lagging indicator is simply a compilation of data points from what has already happened—in this case, purchases of men’s underwear. This empirical measurement has been a fairly solid indicator of what has happened with the economy since it came into existence almost half a century ago.

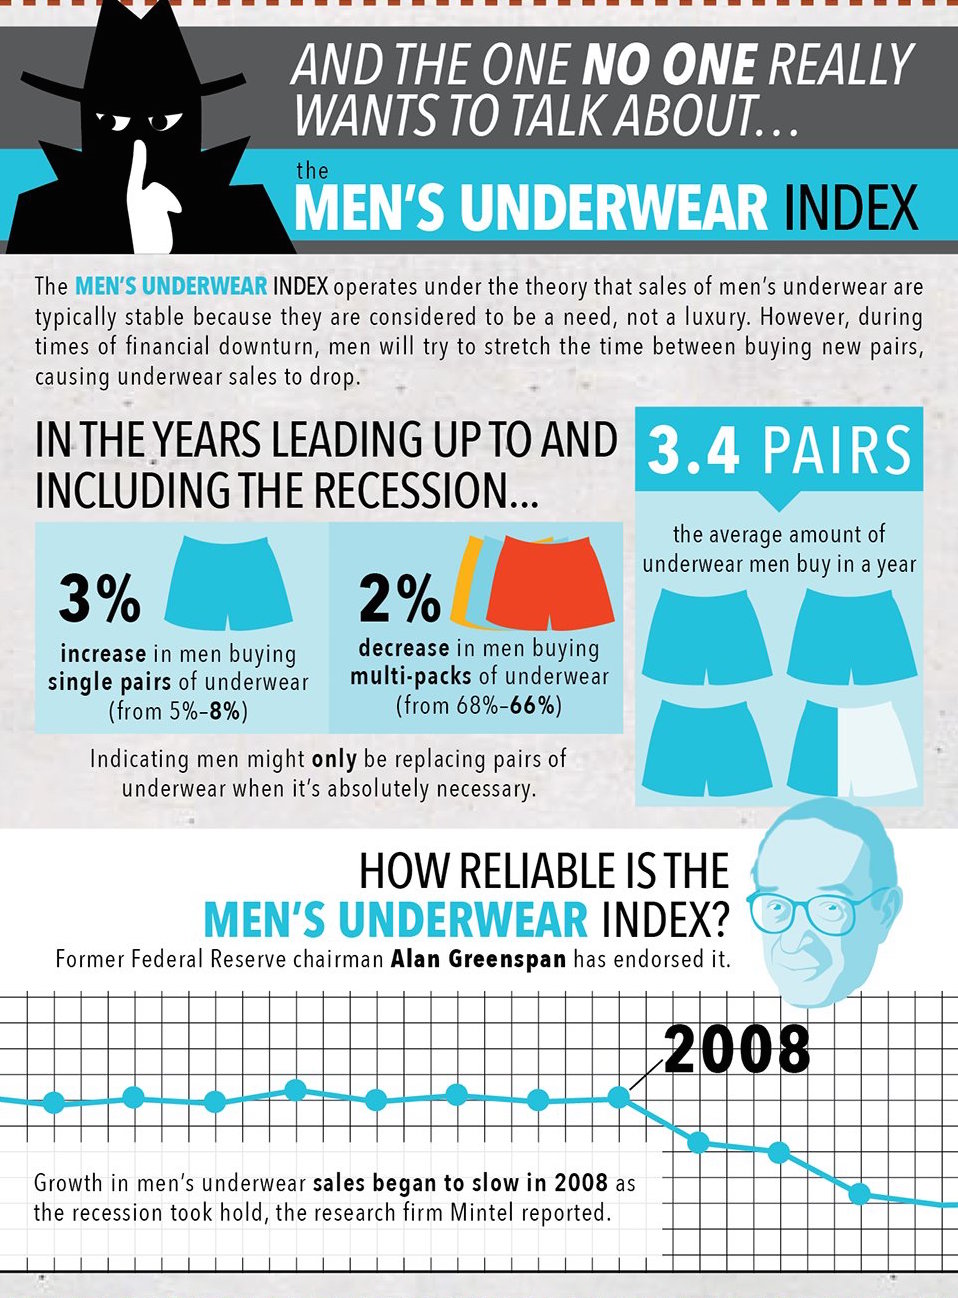
Per Esquire (repurposed from Business Insider), men purchase an average of 3.4 pairs of underwear per year. That number has tended to increase in times of economic prosperity and decrease in difficult economic times.

What I don’t understand is why this is considered some genius insight. It makes sense that in a down economy people would not spend money, primarily because they don’t have it.

The best explanation I’ve been able to find is that underwear is deemed a necessity, which sets it apart from other clothing items and makes it a better baseline. That hasn’t stopped economists from developing other obscure indicators as well. Hemlines, dry cleaning, ties and lipstick have all been referenced to measure the health of the economy, but the common thread through all of them is that people purchase more when the economy is good and they have the money to do so. Regardless of what CNBC analysts tell you, it’s as simple as that.

Greenspan trolled us all, but I suppose I should thank him. He gave me a reason to write about underwear in a class blog.

What Men’s Underwear Tells about Economy

Many know more or less about the lipstick index, or the hemline index that both indicate certain relationship between economics and female fashion trends. Has anyone ever wondered what men’s fashion have to do with the economics? The Men’s Underwear Index tells you everything about the hidden ties between the sales of men’s underwear and current economic conditions.


The revenue generated by men’s underwear usually stays stable because they are regarded as daily necessity instead of luxury items. However, when the economy faces a downturn, men’s underwear industry is likely to suffer from a “prolonged purchase”, according to Marshal Cohen, because male tend not to purchase new pairs of underwear until the economy gets better. As a result, men’s underwear industry is likely to witness a decrease in sales when economy is bad.


On the other hand, however, since men’s underwear companies have discovered the underlying connection between the Men’s Underwear Index (MUI) and the economics, they start to utilize predictions for men’s underwear sales as an indicator for economy conditions as a whole. In the early 2000s, men start to explore a world where their choices of underwear are no longer limited to basic black and white boxers, since companies started to make colorful and modern designs underwear with high-tech materials. These advancements signify a growing economy, which is reflected by increasing sales numbers during the time. Had the economy been growing at a stable rate, the estimated sales of men’s underwear would look like this:

MUI 1


However, as time approaches the year of 2008, the relatively stable men’s underwear industry has observed a phenomenon, which men are increasingly willing to purchase single pairs of underwear instead of multi-packs of underwear. During the recession, men’s underwear sales dropped by 2.3 percent; and it is not until in 2010 when sales began to slowly climb up again. This transition represents the change of men’s habits during times when smooth economic growth is challenged: they tend to purchase underwear only when they absolutely need to. Of course, there are men who still purchase underwear regular basis during times when economy is slowing down; but what the MUI indicates is a big picture from which people can tell the economic conditions according to increase/decrease in men’s underwear sales numbers.

MUI

Overall, the Men’s Underwear Index can be regarded as a reliable economic indicator, thanks to its stable sales behavior throughout the years. When an economic downturn arrives, men are less likely to shop for underwear on a frequent basis, therefore extending the purchasing cycle and lowering sales in the long run.


http://www.huffingtonpost.com/2012/10/09/underwear-sales-growth-economy_n_1952214.html


http://www.washingtonpost.com/wp-dyn/content/article/2009/08/30/AR2009083002761.html?hpid=topnews


http://www.businessinsider.com/mens-underwear-index-economy-indicator-2014-9


Optimistic Farmers Look Past Index Prices

When Farm Prices are low, farmers aren’t necessarily pessimistic. Farm Futures’ first survey of 2016 demonstrates that farmers are eager to plant more crops on their acreage no matter the circumstances.

At the beginning of this month, the Department of Agriculture released an index of prices received from farmers for their current month.  This index measures crop prices, livestock, and product prices. The outcome is farm prices – m/m % change is down -1.9% with an overall -5.7% and farm prices – y/y% change is down -7.1 with and overall -10.0%. The drops in numbers are mostly because of poor weather conditions earlier in the year.


graph 2

Though the chart tells the public one thing, farmers express another.

Like the economy, there are many factors to farming that can affect its status. According to the article Farm Futures’ 2016, planting intentions survey shows low prices won’t deter grower’s conditions. Bad weather that occurred last fall interrupted crops like the red wheat in the Midwest. Wheat grounds in other areas could shrink, with farms predicting only to plant 40.4 million acres in the fall, which are about 220,000 lower than last year.

“While profit margins remain in the red, farmers are reluctant to cut acreage, knowing that volatile crop prices can turn around quickly if weather problems emerge,” said Farm Futures market analyst Bryce Knorr, who conducted the survey.

Even though the percentages of farm prices are low, the survey mentioned earlier, Farm Futures’ first survey of 2016, gives a different attitude for agriculture.

After farmers took this survey, it showed that they plan on planting 89.65 million acres of corn which raises the number 1% from 2015. Soybeans could have a jump in growth as well. The report indicates that Farmers would like to plant 86.32 million acres of soybeans, which raises it 2.4% more than was previously estimated.

The fact that farmers are finding other ways to be productive, even though farm prices are low, gives the future hope. Even when the market is not doing the greatest, it does not necessarily mean it will stay that way. Food is a basic necessity that humans need; therefore food products are extremely important. Farmers and economists know this and that is what makes The Farm Prices graph so interesting. Obviously, farming will continue and more products will be created no matter what the economy looks like. Farmers’ eagerness to expand their product and invest more in other produce is a sign of adapting to the economy and its demand.

Gators & GDP

Alligator

Alligator

After reading dozens of lists of strange economic indicators, ranging from things like unclaimed corpses to baby diaper rashes, I settled on researching more about the Alligator Population Index. Believe it or not, generally when there are more alligators in the world, the economy usually is not doing so well.

The reason? Well think about it. Alligator skin is typically used to make high priced luxury goods like handbags, shoes, belts and more. Basically anything that comes in leather comes in alligator skin, except it is usually around triple the price. These items are sold in stores like Neiman Marcus, Bergdorf Goodman, Saks Fifth Avenue, and Bloomingdales. They’re produced by brands like Gucci, Hermes, Manolo Blahnik and Jimmy Choo.

And who buys these goods? Generally it is the people who have the most money to spend. The trend starts from there. If the rich are not dropping $25,000 on an alligator skin handbag, then Gucci is not buying alligator skin from the tanneries, and then the tanneries are not buying the alligators from the farmers.

So the rich are watching their funds by not buying luxury goods. Then Gucci cuts back by not buying the skins at all. Then the tanneries have no reason to buy from the farmers. And the farmers lose A LOT of money.

A New York Times article from 2009 tells the story of Tommy Fletcher, a Floridian man who was forced to shut down his alligator farming business after 5 years. In 2008, Louisiana farmers gathered over 500,000 alligator eggs fro the wild. But in 2009, for the first time in a very long time, most farmers collected none.

The article names the economy as the “lead culprit.” It discusses how “even wealthy customers began balking at the price of alligator skin products, which can range from the expensive to the wildly expensive.” Once considered a bumper crop, there was now a large surplus in the alligator skin market. Alligator farming is a business that cannot sustain itself on even a shaky economy. It is an expensive business from top to bottom. It’s expensive to buy the eggs, raise the gators, buy the skin, produce the product, and then buying the finished product.

Since that large 2009 dip in alligator products, it has since shown signs of bouncing back, with the reopening of a few farms, and the re-production of products by the high-end brands.

http://www.nytimes.com/2009/11/30/us/30gator.html?_r=0

What chart should I keep my eyes on?

To sell or not to sell.

Business Insider publishes every year the list of The Most Important Charts in the World .

To put up the list, they ask some of the world’s most influential analysts, economists, hedge-funders and traders one question: What charts are you always keeping your eyes on?

Almost all the answerers – 50 experts in economy – give a different answer. And that does not make an ordinary reader like me wiser.

I believe the 50 professionals – among them Nobelist Paul Krugman and Bloomberg’s chief economist Michael McDonough – follow more or less the same economic indexes, but what is the most important for each, depends on the job they do and the decisions they have to make.

So there is no such thing as the most important chart in the world.


I have not really been keeping my eyes on any economics chart, but now I am about to sell a hut. It is a tiny seafront cottage in my hometown Helsinki. It is surrounded by 100 other tiny cottages in the area that used to be a recreational place for city’s policemen and public transit workers.

At the turn of the millennium the city of Helsinki, who owns the land, decided that it was time for all the residents of the city to enjoy this place. Anyone living in Helsinki was allowed to buy a cottage from the area – if somebody was willing to sell.

I was one of the first “outsiders” to buy one. I bought it from an old constable’s widow for €6,000. I was lucky. The area is charming and prices of the huts soon started to go up.

Last year one of my neighbors sold her hut for €50,000. Another sold his for €38,000.

I did not consider selling mine until this August. My study year in California turned out to be more expensive than I expected (this is why).

The question is now: should I sell it or wait until later? What chart should I keep my eyes on?


I looked again at the Business Insiders most recent list of ”the most important charts in the world” (February 2015).

None of those indexes seemed to relate to my situation – except for Eurozone charts that showed that the economic situation in Europe is nothing but deteriorating.

As I need the money, I decided to follow my instinct with help of one chart.


Consumer Confidence Index (CCI) is measured world wide and ”based on households’ plans for major purchases and their economic situation, both currently and their expectations for the immediate future”, as OECD explains it.

In the U.S. the consumer confidence went down the first half of the year 2015 but increased during the summer months.

In the Euro area the confidence was increasing the first four months of the year but has since decreased. Finland’s figures are in line with the European ones.

Every month national center of statistics interviews 1200 Finnish consumers and compares their opinions to a ”normal” state. Long-term median value of the CCI in Finland is 11,8.

In June 2015 it was 10,8. In July it was 6,9.

With this in mind I figured that I should sell my cottage for any price as fast as I can, before consumer confidence is in zero.

However, when comparing to last year’s index, the CCI shows that confidence is in fact increasing. In August 2014 it was only 2,2.

When taking closer look I realized that opinions varied a lot. According to the most recent CCI 30 percent of the Finns believe that the economic situation of Finland will get better in year’s time. 27 percent believe that it will deteriorate.

What can I learn from this?


I do not think consumers are well-informed with the economics. In my opinion media fails to tell about money and markets comprehensively, and even the best economists fail to predict the future.

However, economy are not just facts. It much about trust and feelings.

When one consumer reads that – according to the CCI – other consumers are gaining confidence in the economics, he might think that: yes, it is time to buy the hut of his dreams.

And I am the one to sell him that.

There still might be people who have courage to buy a trendy cottage for a good price.

The Garbage Index: What A Load Of Rubbish Can Tell Us About The Economy

Our trash can tell us a lot about ourselves: What magazines we read, how much we love Trader Joe’s frozen pizza, or whether we’ve finally decided to get rid of your parents’ couch from the ‘70s. But, as it turns out, the sum total of our trash, and our neighbors trash, can also tell us a lot about the health of a country’s economy.

This is called the Garbage Index, which looks at the total amount of waste a country produces to measure the health and growth of its GDP.

1508921362

[Read more…]