Bitcoin: the future of currency?

spending-bitcoins


It’s an interesting fact of life that we often take money for granted. While it is true that “money makes the world go around” (and is constantly the source of both misery and happiness for us), the concept of what money is and what it represented is not questioned. In the United States, we rarely consider the value of money and our currency in relation to others’. These are the sorts of issues that the government, currency traders, and corporations worry about – not the everyday citizen. However, what happens when these assumptions are challenged? What happens when the value of our currency can’t be protected or backed by our government?

This is just one of many questions which have been brought up in the wake of the advent of Bitcoin. Bitcoin is a relatively new form of currency that was created in 2009 by Satoshi Nakamoto (an alias created to disguise true identity of the individual(s)). Bitcoin is a unique form currency in many ways.

First of all, Bitcoin is an electronic form of currency. This means that one bitcoin can be split into almost infinitely smaller pieces, allowing people to spend just part of a bitcoin like they may spend part of a dollar in form of quarters or dimes. Bitcoins are stored in one’s secure wallet which has a unique address similar to a bank account number: disclosing the unique address to someone allows you to pay them or vice versa. Every legitimate transaction is kept on record on a public ledger called the ‘block chain.’ Each Bitcoin wallet involved in the transaction also ‘signs’ the transaction in order to prove that the transaction was approved by both parties and is coming from the owner of the wallet.

Bitcoin it also decentralised – there is no central bank or government that backs the value of bitcoin. In the U.S., for example, the U.S. Federal Reserve decides how much money should be circulating within the economy via interest rates in order to control inflation. Bitcoin, on the other hand, uses peer-to-peer technology in order to “operate with no central authority or banks; managing transactions and the issuing of bitcoins is carried out collectively by the network.” This implies that Bitcoin is a more democratic form of currency, whose value is dictated completely by the market and how much people are willing to pay for Bitcoins.

Because Bitcoin lacks a central authority to both regulate and provide the source of the money, the way in which bitcoins are created is also different. Bitcoins are created through the process of ‘mining’ – like how one might mine for precious metals. However in this case, miners use powerful computers in order to solve extremely complex computer algorithms. Upon solving these algorithms, the miner is rewarded with bitcoins. More specifically, bitcoin mining is the process of verifying bitcoin transactions.

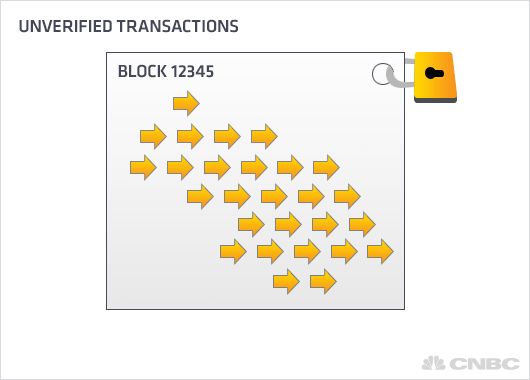
As mentioned previously, every bitcoin transaction is verified and encrypted so that others cannot undermine the integrity of the transaction by changing its details (time, amount, etc.) Since there are many transactions that happen every minute, transactions are compiled together in a box which is secured with an electronic padlock – “block chains.” Miners run software on their computers which attempt to open the padlock. Once the padlock is open, the miner is rewarded with bitcoins. According to blockchain.info, the average number of attempts it takes to unlock a block chain is 1,789,546,951.05. With a GTX 680 GPU and at the current difficulty level, a single miner can expect to mine one bitcoin in 98 years.

Because bitcoins are ‘mined,’ there are is a finite number of bitcoins available. The code that was written ensures that there will be 21 million bitcoins available. Today, there are more than 12 million bitcoins in circulation. The fewer the bitcoins are to be mined, the harder and more complex mining becomes, decreasing the rate at which bitcoins are mined. Currently, the a maximum of 25 bitcoins are able to be mined every ten minutes.


block


Bitcoin is an attempt to address many of the flaws present in a traditional form of currency. Much like cash, using bitcoin is almost completely anonymous. One never has to disclose their credit card details, name or identity in a bitcoin transaction, so long as their bitcoin address is valid. There are also no required transaction fees or foreign exchange fees when using bitcoins. For larger transactions – where one may gather bitcoins from multiple addresses – a transaction fee is usually expected but still not mandatory. There is an incentive to pay and charge transaction fees, however; bitcoin miners who validate the transaction are the ones who receive the transaction fee. Paying a transaction fee is “an incentive on the part of the bitcoin user to make sure that a particular transaction will get included into the next block which is generated.”

However the advent of Bitcoin has also raised significant concerns and highlighted some controversy. Due to the relative anonymity Bitcoin provides, there are some who use Bitcoin to conduct malignant operations and purchase illegal goods such as drugs. The U.S. for example, has researched heavily into Bitcoin and has illustrated its concerns over the potential terrorist threat Bitcoin poses: “The introduction of virtual currency will likely shape threat finance by increasing the opaqueness, transactional velocity, and overall efficiencies of terrorist attacks.”

However, the U.S. is not alone in these concerns. Due to Bitcoin’s connection with illicit activities, Russia has banned the use of Bitcoin: “Systems for anonymous payments and cyber currencies that have gained considerable circulation — including the most well-known, Bitcoin — are money substitutes and cannot be used by individuals or legal entities.” Furthermore, Russia had emphasized that the Rouble is to remain Russia’s only official currency, and that any introduction of other currencies or other monetary units would be illegal.

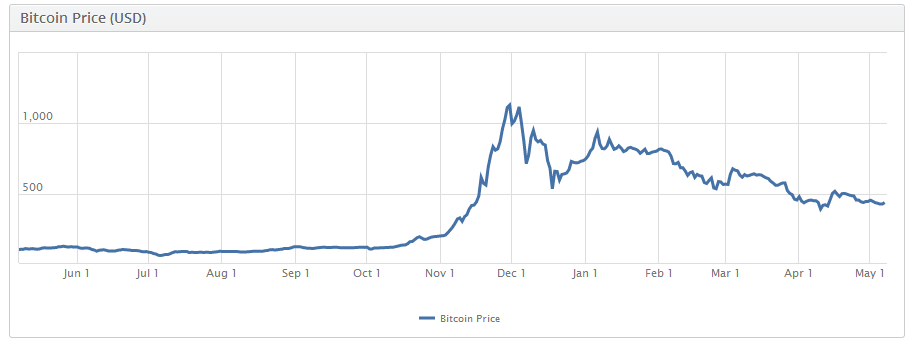
Because Bitcoin’s value at this point is completely on of public perception, it is an extremely volatile form of currency. While the lack of a central authority controlling its value means that political instability or corruption won’t affect its value, it also means that there is no force that is able to stabilize its value. In October, 2013, one bitcoin was valued at about $126 USD. Just one month later, the value skyrocketed to almost $1010 USD. In April, 2014 the value dropped back down to $420 USD. The extreme volatility of the currency is a serious cause of concern for many, preventing Bitcoin from being a universally accepted currency. Bitcoin is accepted by a few online merchants as well as select businesses and individuals around the world (mostly in Europe.)
Bitcoin remains a complex, innovative and experimental form of currency. While there have been variations of Bitcoin (such as Lightcoin and Dogecoin), its feasibility as a widely accepted form of money has yet to be tested.


Sources: 

https://en.bitcoin.it/wiki/Mining_hardware_comparison

http://www.pcworld.com/article/2151261/beginners-guide-to-mining-litecoin-dogecoin-and-other-bitcoin-variants.html

http://www.huffingtonpost.ca/2014/01/26/what-is-bitcoin_n_4661604.html

http://www.reuters.com/article/2014/02/25/us-bitcoin-mtgox-factbox-idUSBREA1O21M20140225

http://money.cnn.com/infographic/technology/what-is-bitcoin/

https://bitcoin.org/en/faq#what-is-bitcoin

https://bitcoin.org/en/how-it-works

https://coinbase.com/charts

http://www.theverge.com/2014/2/9/5395050/russia-bans-bitcoin

Futbol vs. Soccer: Comparing the American and European Transfer Market

Kaká has sadly been left out of Brazil’s roster for the upcoming 2014 World Cup but he still very much on the list of prospective players to move to the MLS later on this summer. Along with the AC Milan midfielder, Anderlecht midfielder Sacha Kljestan’s name was “tossed around the rumor mill” according to a Fox Sports article.

Many successful international players have migrated from the European league to Major League Soccer. David Beckham had a great run with the Los Angeles Galaxy. Theiry Henry is still enjoying his time with the New York Red Bulls.

The European soccer season is slowly coming to an end, and with the attention slowly turning to the American soccer league (leaving out the World Cup from this discussion), now is the best time to compare the two leagues and how both handle their transfer windows.

The European Transfer Market

The common rationality for any transfer window is that Team A offers a certain amount for a specific player, the player’s current team (Team B) negotiates the prices offered, negotiations reach a certain agreement and finally Team A obtains the player that they desired.

It’s simple, right? Not quite.

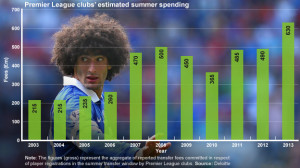
The European transfer market is one of the most expensive markets in the world, millions of Euros are exchanged every season.  Speculations influence transfers; dozens of media stories being released on who might be sold, sports analysts doing multiple segments on the subject and now, social media users voice their opinions on which players are the best fit for their teams. _69617549_030913_grosstransfergraph_624

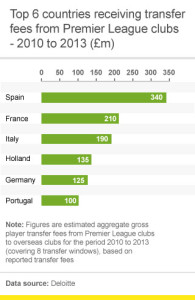
But aside from speculation is the freedom that the European leagues offer. For one, there is no salary cap. Teams can spend as much money as they want on the player and resources of their choice.  Back in 2003, Roman Abramovich bought Chelsea and took over west London with his one billion euro investment. This sort of “big money” is not just seen in the English league, but in Spanish and Italian leagues as well. _69617552_030913_top6countries_320x490

The other factor is the contingency that allows players to leave their clubs at any time—before, during or after the transfer window—and the club is responsible for making those arrangements happen. The most recent example of this was when Juan Mata, unhappy with Chelsea, was able to leave and be traded to Manchester United for 37.1 million Euros.

While this trade still occurred during the time of the transfer window, it does prove a point when it comes to the freedom that players, even big commodities such as Juan Mata, have when it comes to playing for the teams of their choice.

But as previously mentioned, players are able to leave regardless of the “boundaries” that the transfer window claims to have.

As the English Premiere League website states:

There are two transfer windows in each Barclays Premier League season.

The first commences at midnight on the last day of the season and ends on 31 August if a working day – or, if not, on the first working day thereafter, at a time determined by the Board.

The second transfer window commences at midnight on the 31 December and ends on the 31 January if a working day, and again, if not, on the first working day thereafter, at a time determined by the Board.

Temporary transfers can be made permanent outside of the transfer windows. For further information please see the rules in the Premier League Handbook.

This, also, is the same framework used in other European soccer leagues.


The Dilemma

As the rule with materialistic items is “the more exotic, the more expensive” the same rule is somewhat used when it comes to soccer players. Soccer players prices are based on one thing more than anything: location, location, location—in this case, where they were born (or what country they decided to nationalize themselves in). Neymar is a great example of this. His performance as a player was impressive but him being Brazilian was what made him that much more valuable. South American players are a big commodity as well as European players, but there is hardly demand for players from Canada or even Russia.

Country of origin is not the only thing that defines a player’s value but there is also the factor of what club owns the player. Continuing with Neymar, he started his career off playing with Santos FC  in Brazil. If he had decided to continue there, his value as a player would not have been as significant. The level he had and the competition he played against also play into this as well (performance being the third factor). So when Barcelona FC (one of the top teams in the Spanish league) purchased him, his value as a player soared through the roof.

While Neymar’s stories is a “Cinderella story” that is continuously seen not just in soccer, but in sports in general, these factors are what create a giant gap between different nations and clubs. The role that the transfer market plays creates a hierarchy of clubs that will always be at the top of the table that the “poorer” clubs will never be able to catch up to. Note: it is important to mention that performance for clubs has nothing to do with the system per se. Even though Manchester United did horrible doing this season in the Premiere League, they are still one of the richest teams in the EPL and will continue to stay in that position.

Continuing with the Neymar example, there is no regulation on the amount of money that is being spent. This led to Barcelona sparking a media frenzy regarding the purchase of Neymar.


American Soccer Transfer Market

The transfer window for Major League Soccer (MLS) works a bit differently than Europe’s.

For one, MLS works as a close league and not the European open league. Players are not able to leave clubs when they please and to even the playing field more and avoid this gap of rich and poor clubs, there is a draft is held around the time of the two transfer windows that occur during mid-February and another that opens on July 8th. Teams’ position in the draft is based on: their performance and what the standing was in the previous season.

As with other American sports, the highest pick goes to the worst performing team and the best teams find their slot at the very bottom. These teams draft in rounds, which goes from #1 to however many rounds indicated.

This allows for something that occurs in the MLS draft that does not appear in the European market at all—the role of trading draft picks. So, a team somewhere towards the bottom can trade their pick in the draft with a team that is a little higher up.

Another difference between the European transfer market and the MLS is the salary cap. As the MLS “Roster Rules and Regulations” states:

  • Players occupying roster spots 1-20 count against the club’s 2014 salary budget of $3,100,000, and are referred to collectively as the club’s Salary Budget Players.
  • Roster spots 19 and 20 are not required to be filled, and teams may spread their salary budget across only 18 Salary Budget Players.  A minimum salary budget charge will be imputed against a team’s salary budget for each unfilled senior roster slot below 18.
  • The maximum budget charge for a single player is $387,500.*

* See section entitled Allocation Money below, under Player Acquisition Mechanisms, for details on buying down a player’s budget charge.

As one can see, there is a budget that is upheld within the MLS; there is accountability for each player and how much can go when it comes to salary. That is not seen in European (as is evidence with the large amount of money that soccer stars such as Messi and Cristiano Ronaldo are paid).

The MLS looks to have a more even playing field and does so by regulating all aspects of the transfer window. This also helps to create greater competition for teams, regardless of how much money they have, because they have a better chance of obtaining a good player.


The Dilemma

The dilemma with the American transfer window is the role of politics. Players are not given as much freedom as there is in the European market when it comes to where and when players want to play. Though there is a disparity in income with European players, American players have very strict contracts with their teams that are often too expensive for any team to simply pay off to get that specific player.

As is noted:

  • A Team may buy out one (1) guaranteed player (including a DP’s) contract during the off-season and free up the corresponding budget space. Such a buyout is at the particular MLS Team’s own expense.
  • A Team may not free up budget space with a buyout of a player’s salary budget charge during the season. Such a buyout will be conducted by the League and count on a Club’s budget in a manner consistent with current MLS guidelines.

As with anything, is a very strict, orderly procedure that takes place for the buyout to even occur.

Nothing happens outside the transfer window that is not seriously examined for a long time.


Conclusion

Both the European and the American soccer transfer markets have their flaws. One seems to have a very free and open place that creates disparity while the other seems too strict to even try to mention the word “freedom.” What is important to note though is the simple question about the love of the game. The American soccer league is very strict about making sure they make a profit or do not spend any more than they have to  to avoid a deficit. However, what is important to note about the European market is this lack of salary cap that allows for people to waste so much without a worry; they simply do it for “the love of game.” Going back to Roman Abramovich and his purchase of Chelsea, economically it is seen as a bad investment. But from a pride standpoint, the investment was definitely worth it (it brought a Champions League Cup, two League Cups and two FA Cup wins).

So whether you enjoy soccer from an economic standpoint or for the love of the game, both have their flaws but both also have their benefits.

Rise of Digital Consumption Disrupts the Audience Measurement Business

In November 2013, Business Insider CEO Henry Bodget made a compelling presentation analyzing the state of media in the tech space. The findings were from Business Insider’s new research arm, BI Intelligence. The report created waves in the tech industry. In a matter of two days after the reports’ release, it had over 900,000 views.

There were many insightful slides that demonstrated the current digital realm.  However, one slide especially caught the eye of media leaders.

“Digital is now bigger than TV.”

Although a very contested claim, recent years have indicated that digital is causing a major disruption in the media business. In his slideshow, Bodget echoed the industry’s standard rule: money follows eyeballs. Until recent years, “eyeballs” were monetized through a rating system called GRP, invented by Nielsen. However, this method only worked wonders when our eyeballs had one screen: television. Today, we have tablets, smartphones, and desktops. We are constantly consuming and content is becoming available across all of these exhibition windows. The chart above indicate that “eyeballs” are moving to digital, and people want to know how to measure this revolution, and so far, GRPs aren’t cutting it. The rise of digital is shaking up the longstanding media metrics system, and everyone is keeping an eye on the digital ratings race.

Metrics as Currency

In his book, Audience Economics: Media Institutions and the Audience Marketplace, Phillip Napoli refers to audience measurement organizations as one of the four principal actor–along with media organizations, advertisers, and consumers–in the market for audience product. All services are interrelated and depend on eachother to survive.

Audience measurement organizations seek to provide quantitative data on audience viewership. In other words, they are in charge of monetizing attention. The value of a media product, whether it is a sitcom or an article, depends on the audience exposure, or ratings. How many people are watching? How many people are paying attention? Napoli says audience data functions as the “coin of exchange” in the audience marketplace, and it is the currency that media organizations use to sell, and the advertisers use to buy.

The rise of digital advertising has created a ripple effect in the media industry. The industry understands digital ad spending will eventually overtake television; it’s only a matter of time. However, there is also one giant obstacle in the way of this digital takeover–Nielsen.

Nielsen 

Picture 12

Nielsen is the undisputed king in the media metrics business. Founded in 1923, the 91-year-old company had revenues of $5.5 billion in 2011. During the TV era, Nielsen dominated the audience measurement industry. Nielsen’s monopoly has been a double edged sword. On one hand, having one audience measurement system eliminates complication and uncertainty. If there were multiple ways to measure, more resources would have to be put in media companies and agencies. If CBS used one method of audience measurement but Viacom used another, and a big client like Proctor and Gamble wanted to advertise on both, media agencies would have to juggle the different numbers and invest in new systems, making it immensely difficult and confusing.

However, on the other hand, because Nielsen is a monopoly, it gets to name its price without competition. Last summer, I had the amazing opportunity to be an IRTS (International Radio and Television Society) fellow, a media scholarship program that funds a select group of students to pursue a media internship in New York City. I got to attend a week-long “media bootcamp,” where we visited major media companies that included broadcasting, cable, digital, etc. In multiple panels, industry leaders complained about Nielsen’s monopoly over the metrics industry. Nielsen has been criticized to be slow in responding to rapid industry changes. Les Moonves, the CEO of CBS, is one of many industry executives who advocated for a better rating system. He pushed Nielsen and the media industry to accept the C7 metric rather than the C3, as the introduction of DVRs (digital video recorders) has allowed audiences to watch their favorite shows later in the week. While speaking to investors at a Deutsche Bank media confab in March 2013, Moonves expressed his frustrations when he said, “All we want is a fair measurement—we want Nielsen to measure everybody, and ultimately, we want an eyeball to count as an eyeball no matter where you watch your television shows.” CEO of Viacom, Phillip Dauman, also echoed Moonves’s frustration in an Economist interview when he said measurement is the “number one issue for television right now.”

How Ratings Work

There are a dizzying amount of terms to know in the media industry. CPMs, GRPs, LPMS, PPC, PPM, and the list goes painfully long. Ad Buyers stare at these numbers every day to allocate their clients’ media budgets; the ultimate goal is to reach as many people as possible for the lowest price. Just to give you a snippet of how the current rating system works, here is a ratings report for this Monday (5/5/2014).

Screen shot 2014-05-06 at 9.50.48 PM.png

I know, there are a lot of numbers on here. When I was interning at a major broadcast network in the ad sales division, a huge stack of these reports were delivered to our desks each week. The numbers on the columns determined the value of our product. Without going into too much detail, ratings on a sheet like this indicates the Nielsen ratings point system. One ratings point = 1% of the Nielsen estimate for the category being measured. On the chart above, the categories, or the target demographics, are 18-49 year-old viewers. LIVE+SD indicates the number of viewers that watched a program either while it was broadcast or watched via DVR on the same day.

Of course, there are so many questions that are unanswered by these numbers alone. What about Hulu? What about all the binge-watching of 30 Rock I did on Netflix last weekend? What about how much I actually like the show or paid attention to it? Nielsen has yet to come up with a satisfying answer, causing buyers to turn to new players.

The Digital Wave and its New Players

Now that the digital revolution is disrupting the media space, allowing more viewers to consume online, the media community is applying greater pressure on Nielsen to keep up with the trends. Although Nielsen traditionally monopolized almost every aspect of the media industry, it seems that the increased demand for digital measurement systems have introduced new challengers. Today, the digital audience measurement sector is the most vibrant and competitive sector in the metrics market.

Picture 10.png

As Nielsen is already the established leader is measuring “eyeballs,” majority of these agencies have focused on the question of audience engagement–how audiences feel, respond, and interact with content. For instance, a client may seek to reach the coveted 18-49 audience, but the viewing experience of Mad Men on cable versus Huffpost Live on digital stream is vastly different. Social media has been the answer for many stakeholders who seek to gain this information (partly because Nielsen does not provide it). In his 2012 TWC research report, Napoli talks about the new players in market and their varying methods. Digital measurement companies like Bluefin, now owned by Twitter, engage in a new metric model depending on information gathered  from “web scraping.”

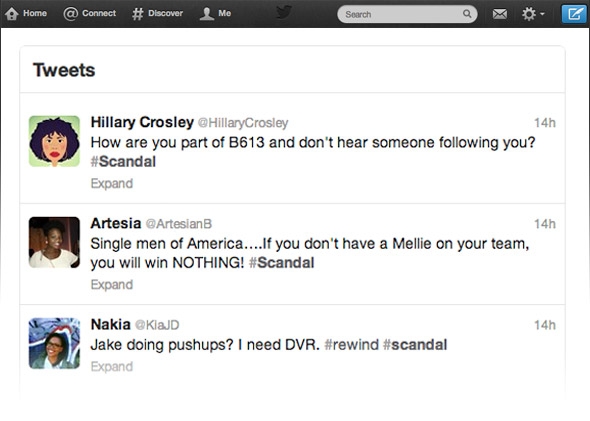
#Scandal Twitter Convos

#Scandal Twitter Convos

“Web scraping” is a common method used by social media analytics services, and it involves aggregating comments posted on social media platforms and using sophisticated algorithms to measure the popularity or sentiment of a show. These measurements derived from online conversations go beyond television consumption to include the consumer’s buying behavior and affinities. Another advantage of this method is that unlike Nielsen, which has a set measurement sample, information can be extracted from anyone who participates in the web.

However, Napoli points out that these digital measurements do not try to stray too far from traditional methods. For instance, Trendrr.tv offers a “share of voice” metric, representing the share of all television-focused social mid activity attributed to a network or a show in a specific time period. Bluefin Labs showcases a “response share” metric that measures a program’s share of the online television conversation at the time the program aired. Other applications like Getglue or Viggle depend on the “check-in” method, measuring digital activity on second screens like computer or mobile phones.

So far, there is no “one-size-fits-all” rating system for social media activity. Some analytics firms focus on a programs’ market share in a weekly or monthly basis while others focus on individual days. One major challenge of these new technologies is that their measuring process is not transparent. One reason for its secrecy is to protect its patents from competitors, but this creates a black box effect that drives ad buyers crazy. Again, the cost of having multiple players in the metrics marketplace is confusion and inconsistency.

Nielsen Strikes Back

Nielsen is trying to meet these new threats by introducing weapons of its own. Check out this cover of their latest yearly report.

Screen shot 2014-05-06 at 8.27.14 PM.png

Notice anything?

No television in sight.

Nielsen is no fool. The company understands industry trends and it is trying hard to keep up. Last year, it released a new product called “Digital Program Ratings,” recruiting big name partners like NBC, Fox, ABC, AOL, CBS, Univision, Discovery and A+E to participate in the test run. The product will mainly track the network’s desktop websites with plans to integrate mobile in the future. This release follows the company’s introduction of the Twitter TV Ratings system, a measurement of pure social activity. Nielsen also acquired Arbitron for $1.3 billion in December 2012, swallowing its rival with expertise in measuring mobile content.

Despite its shortcomings, Nielsen is still the undeniable leader in its industry. Despite initial reluctance, Google began a partnership with Nielsen in testing ad campaigns on Youtube using OCR (online campaign ratings) deals with select clients. It is a win for Nielsen and a smart move by Google. The search engine giant understand the major ad spenders have a longstanding relationship with Nielsen, and if it wants to gain their trust, they have to use a credentialed third party entity.

What About the Ad Buyers? 

Dubbed as “promiscuous consumption,” Millennials are consuming content through search, social, online video, mobile, and television. Ad Buyers are adjusting their buying habits in response to these new trends as well. Since 2010, ad spending on the internet saw the greatest change with a 7.5% increase.

zenithoptimedia-share-of-total-ad-spend-by-media-2010-2014-mar2012.jpg

Laura Desmond, chief executive of one of the world’s biggest ad-buying firms, Starcom Mediavest Group, shared her strategy of partnering with new measurement firms to help her company transition to digital. In a WSJ interview, Desmond said, “[p]art of the market is lagging, mostly because they’re holding on to the measurement that they know.”

She agreed part of this lag was due to Nielsen’s monopoly over the measurement business, and hinted that ad buying will eventually depart from the traditional Nielsen rating methods. With the increased media fragmentation and the promiscuous consumption of media by audiences, what Ad Buyers are ultimately looking for is a unified digital measurement system. Until digital measurement reaches this level of sophistication, agencies will continue to fall back to the biggest and most reliable measurement system. Love ‘em or hate ‘em, Nielsen is still the undeniable rating king.

Organic Food: Not Just For Humans

Patrons of this Los Angeles health food boutique have their choice of a cutting edge selection of foods and supplements, including the likes of calcified seaweed, Chinese herbs and fresh venison. They can even sample an organic cookie while they browse the store.

But if they want to make a purchase, they’ll have to beg their owners for their credit card.

My Pet Naturally is one of a growing number of dog boutiques that embraces all-natural wares. In addition to raw food and exotic treats, it sells recycled and hemp products and “a lot of the same supplements that people take,” said owner Neil Massa.

Consumers have become more concerned about organic food not only for themselves, but for their pets as well. Sales of organic pet food increased ten times from 2002-2009, according to the Organic Trade Association. And analysts predict the industry will grow even more, at 12 percent a year through 2015, according to Packaged Facts Market Research Company. Organic pet food is more expensive, it can cost as much as 30 percent more than non-organic, but an increasing number of pet owners are willing to pay the higher price. A few factors may contribute to this trend: two high-profile incidents of contaminated commercial food and an overall growth in the pet industry due to more Americans bringing furry friends into their homes.

Massa said he thinks the trend toward organic pet food took off more in urban areas because the residents are more attuned to holistic living.

“If you look at big cities, people are more aware of their food sources and they want the same for their pets. In metropolitan areas, people are more aware of wanting organic than you see in smaller towns,” he said. “I know from experience. My in-laws are from a smaller town and they have more of a Wal-Mart mentality.”

But even in Los Angeles, Massa finds he must still compete with chain stores, where prices range about five percent cheaper, he said.

“Because I have a smaller store, I buy food by the bag rather than by the truckload, like they do. They can buy more food and get a better deal on it,” Massa said. “We might also sell something for the same price, but it will end up being cheaper at a chain store because they offer a coupon.”

A pound of raw venison costs $8.00 at My Pet Naturally, while at Wal-Mart; customers can buy a 27.5 lb. bag of venison flavored dry food for $30.

photo-22

(Supplement shelves at My Pet Naturally)

Massa opened his store in 2006, a year before Menu Foods pet food manufacturer recalled more than 60 million containers of food. Menu Foods, which was based in Ontario, Canada, was the largest dog and cat food maker in North America. Its products were sold under well-known brand names atchain stores such as Petsmart and Wal-Mart.

“I’ve been making homemade food for my dogs since the 1980s,” Massa said. “I saw there was a need for it and not many were doing it. I read an article about how dead animals become dog food around the same time that people became more aware of Mad Cow disease.” Massa said the recall bumped business up about 10 percent and helped make up the difference in the lack of customers during the recession.

The toxic food killed about 1,950 cats and 2,200 dogs, according to estimates from the U.S. Attorney’s office. The Food and Drug Administration found that the Chinese wheat gluten present in Menu products was tainted with melamine, a substance also used in fertilizer. It is not approved as an ingredient for pet or human food. The products also had a contaminant used as rat poison, and another used to stabilize chlorine in swimming pools. Consequently, the incident scared many pet owners into shelling out for higher-quality fare.

Jacob Gonzalez, the owner of Woof Dog Boutique in Los Angeles, said organic food is “almost the first thing” customers are looking for since the beginning of another epidemic, also in 2007. In this case, thousands of dogs have fallen ill and about 600 died over the course of seven years after eating jerky treats imported from China. The FDA is still investigating the causes. The problems do not seem specific to a certain brand or manufacturer, but according to the FDA, dogs all over the world have been affected. Gonzalez said that ever since, his clientele have made buying American-made food another priority.

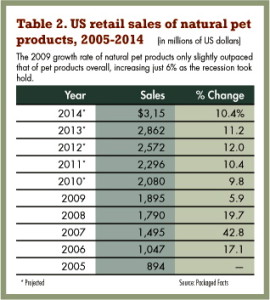
Even before the two food episodes, sales of natural and organic pet products had been growing in the U.S. by teen-double-digit rates since 2002, according to Packaged Facts. But in 2007, sales jumped 43 percent. This may result from the contaminations, as well more pet food marketers extending their lines to ‘natural’ products at this time as well. Sales continued rising to 20 percent in 2008. The increase dipped to six percent during the recession in 2009, but it began climbing up in 2010 and growth went back into the double-digits in 2011.

1009PET_updatetable2


(Packaged Facts)

Some brands market their pet food with labels such as “natural,” “premium,” or “holistic,” and it is typically more expensive. For example, the brand Alpo Come & Get It! Cookout Classics is sold for $0.51 per pound, while Iams Sensitive Naturals Dog Food fetches $2.49 per pound, according to Walmart.com. But the label does not necessarily mean the food is healthier. It is only the “organic,” designation that requires manufacturers to meet any standards. For both human and pet food, 95 percent of the ingredients must be organically grown or cultivated without synthetic pesticides or fertilizers in order to meet the qualifications set by the USDA. Some of the brands containing tainted food from Menu included products billed as “natural.”

Century City resident Linda Schwartz began buying raw venison from My Pet Naturally upon recommendation from her veterinarian. Her Shih Tzu dog was experiencing stomach issues for about six months, including colitis and irritable bowel syndrome.

“My vet said the preservatives in normal food were making my dog sick,” she said. Schwartz is also a fan of the store’s treats that Massa’s wife makes on-site. “My dog is allergic to chicken, but not the treats because they just have chicken juice.” She said that since she started feeding her dog raw meat her dog’s stomach issues have improved.

Although raw meat diets have proved beneficial to some pets, they are not recommended for all. The American Veterinary Association discourages feeding pets raw and uncooked meat because of the food-born illnesses it could inflict on both pets and the humans who are in contact with them. A study at the Cummings School of Veterinary Medicine at Tufts found that up to 48 percent of raw commercial food tested contained salmonella. The researchers also found that these diets could contribute to nutritional deficiencies.

But pet owners are treating their pets more like people, which sometimes means projecting their own desires onto their four-legged children. Sixty-two percent of American households own pets, up from 56% in 1988, according to statistics from trade association American Pet Products. And pet owners are spending more on everything, from products such as Halloween costumes to services related to travel and grooming, according to a 2013 report on pet trends from pet insurance company Embrace.

“People treat their pets like family members,” Gonzalez said. “Not just the dog we leave outside.”


Putting the “Profit” in “Non-Profit”: A Love Story

March madness made be over but the madness surrounding the NCAA has anything but cooled down.

Ever since Shabazz Napier made a public statement about him going to sleep hungry on more than one occasion, questions began circulating about the treatment of athletes and the rules placed by the NCAA.

More important that was the question about who actually does all the work and who reaps the benefits?

The exploitation of college players and their companion organization is an evergreen story.

But what is interesting here is the way in which the NCAA reacted to players like Napier attempting to unionize in order to receive better aid for not just playing at a competitive level but also winning for the organization as well; an organization that is a non-profit.

Mark Emmert, NCAA President, is obviously against players unionizing.” The notion of using a union employee model to address the challenges that do exist in intercollegiate athletics is something that strikes most people as a grossly inappropriate solution to the problems. It would blow up everything about the collegiate model of athletics,” he stated in an ESPN article.

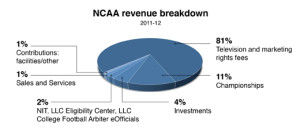
Grossly inappropriate, especially considering the NCAA made somewhere along the lines of $750 billion in revenue from broadcasting contracts alone.

130213revenue

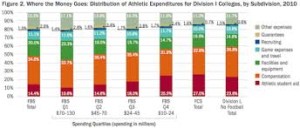
And how much of that goes to the athletes?

asgsdag

As the chart shows, not as much as they should.

But there are many more issues that come into this student athlete conversation.

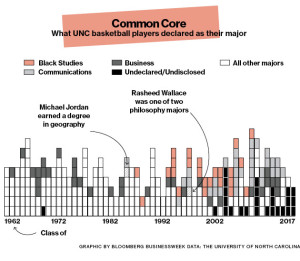
1)      The fact that most colleges don’t even take academics as seriously for athletes as they should.

BBW_unc_chart_630inline


2)      The long line of racial disparities when it comes to the graduation rates from white student-athletes compared to black student athletes. It was recently reported that student-athletes at Columbia had a graduation rate of 85% compared to the overall school’s rate of 95% (even more disparity is seen with female athletes but that is another issue).

What is clear here is that there is an even distribution of wealth when it comes to student-athletes. Should they get paid? Do they deserve to considering they win the championships?

As Greg Johnson wrote in an op-ed article, “student athletes do not need salaries or monthly paychecks, even though the NCAA runs just like any other professional sports league. They should simply be allowed to operate within the free market like anyone else in America.”

The True Battle For College Tuition. Compromises, alternatives and brutalities.

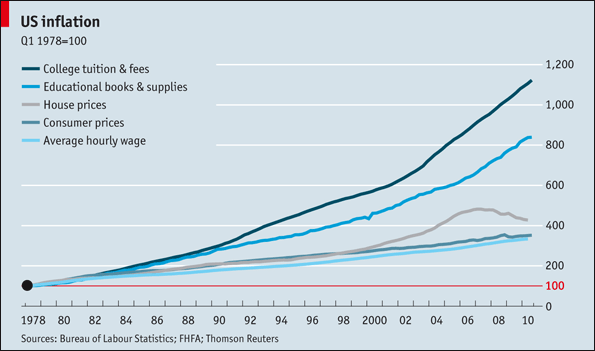
It’s quite funny how tuition has been able to resist the laws of physics within the past years of recession. Unlike the mortgage industry where it took a nice dive south in 2008, tuition has been able to resist this urge and continues its leap. In fact for public schools the annual increase has been 6.5% each year for the past decade. However certain policies both fiscal and monetary are out there, but how much do they even help?  If they don’t help at all I sure as heck would like to know of some alternative options to college that might provide more of a benefit in securing a financially secure future. While the public is told that colleges are a promising step to securing a financial future, the cost of tuition seems to act as a stump towards finishing the end of that promise. This stump hurts many aspects of society, mainly the middle class American dream. An important value that has become more demanded but less available to the public with some more than others.

After considering some numbers on this chart, it might seem that coming out of college in debt would most likely put the average college student few tens of thousands in debt and for some, many tens of thousands.

Considering that the average tuition for college graduates is around $45,000, it would seem that is very possible to manage the debts out of college. For loans taken after 2013, Obama’s new policy that fixes loan payments to 10% of monthly income will be able to ease the stress of paying back the loans. Unfortunately, this only covers federal loan debt, which is helpful considering that federal loans take up 90% of the student loan market. Yet, only around 1.5 million are even eligible to use President Obama’s “Pay as you Earn…” plan. This is because in order to qualify for the policy, a borrower must have an outstanding federal debt in comparison to their family size. This obviously helps the lower socio-economic borrowers, but this leaves a wide gap towards the rest of the “middle* (middle class is no longer middle class)” class borrowers –borrowers whom are actually the most worst off in terms of college loans. Because federal aid is limited to those who are in more well off financial situations, borrowers in this category must resort to private lenders, primarily like those of Sallie Mae.

Sallie Mae “also offers reduced monthly payments, extended repayment schedules, and likely some less-advertised hardship programs. In their letter to the CFPB, they also state that they are in favor of rehabilitation programs for private loans that can help borrowers recover from default.”

Yet after looking at the so many videos, blogs and comments , it’s obvious that Sallie Mae doesn’t have a practical way of helping borrowers. For that reason, it’s common to hear stories of loan debt from Sallie Mae being doubled and paying monthly rates of over 1500.

Tiffany, a borrower who has suffered the much too common problem comments,

“I’ve spoken to their reps many times and it seems they can never help or answer any of my questions. I asked them how much of what I do pay actually goes to the primary loan and how much goes to interest. that rep couldn’t answer me. Just said I don’t know and I’m sure your loans will go down. (they haven’t) they have actually almost doubled ($25,000) now ($45,000). I am now searching for outside help and hoping to get someone involved because it doesn’t seem right to do all these programs and the sum of the loan never [goes] down.”

Responses like these are all over loan assistance forums, blogs and YouTube.

What it comes down to is whether these loans are affordable to the borrower in a way that takes into consideration the most important factors of the economy. Is the borrower entering a sound financial market in the coming years? Will the economy shape up and provide enough quality jobs to sustain borrowers in their repayments? Are interest rates comparable to these factors?

Interest Payment
11.875% $197.92               $392.92 72 $33,753.19

Fixed Payment
12.375% $25.00 $414.73 96 $40,434.05

Deferred Payment
12.875% $0.00 $410.66 108 $44,185.09


These are all questions that answer themselves but have not been replied by the government or the institutions themselves. Obviously, with the current average salary of $45,000, repaying $30,000 would take over 15 years IF the income to ratio payment plan was available to use. One can only expect a borrower from Sallie Mae who is unable to use an income ratio payment plan to be in a much more difficult situation to say the least.
This is the repayment plan for $20,000 loan. Why should a loan increase over double the amount when deferred? The deeper question is: Why would someone take out such a loan with the imposed risk of destroying oneself financially?

It’s about time that not only private lenders like Sallie Mae change their lending practices, but also borrowers become more responsible consumers by taking a stand against predatory lenders. But in reality this requires students to look towards other alternatives and sadly there are no real alternatives that provide such assistance. That means a lot of students would have to stop going to school and the future of college students would drastically drop in numbers.

Of course this adds the benefit of pushing for reform in creating alternatives to the whole post-secondary educational system, but the time that it would sacrifice would be much to dire for a single generation to make this move. Therefore, the only plausible solution would be for reform, like any sustainable reform, to happen slowly. This will act as yet another barrier to allowing current college debt holders from being able to pay their debts off.

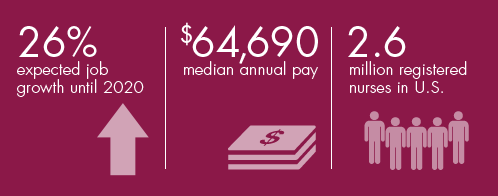
If one was looking to find a solution in today’s market, one would have to focus on a career that is in demand and provides a secure return. Two of those jobs are nursing and teaching. Since baby boomers are now retiring a great number of those jobs are becoming increasingly in demand. These jobs even if requiring a large sum of debt are secure

This could create a major shift in the workforce where middle class Americans are fighting more for a secure workplace rather than their dream job. These attitudes already exist primarily in majors like pre-med, engineering and accounting but a severe shift into these jobs could create a problem of supply and demand in future generations. As of now, they remain as a credible option for securing a life as a middle class American and more importantly getting the bang for the buck.It’s unfortunate that the solution to the economic market requires overlooking the value of the educational institution and instead considering the conditions of the job market. It completely debases the goal of universities of spreading diversity, education and promising a future. Money is spread too far thin in America and economic security is only available in the holes in which it leaks. As nursing and teaching jobs are being widely pursued after, it is evident that more and more students are becoming aware of this fact.enough to pay off debts and provide a financially secure future.

Given that there are so many fields of careers in each of those industries that are increasing and decreasing at different paces, the prospect of the job market varies with holes that are both hidden and publicly evident. So looking for those things is important in order to really make a conscious decision in the future path of a post-secondary education. Within all these holes of mysteries and wonders the only way to really find a secure route towards careers, ones like public relations, journalism, business, philosophy etc. , institutions have to provide resources that cater to these fields –things like specific training and hands-on (internships) that give a more practical and applicable tool to the student.

The company, Coursera does this exact thing. Founded by Andrew NG, Coursera is a site that offers the “world’s best courses, for free.” This is an example of a tuition return at its finest. Free tuition and specific helpful resources. This helps employers as well as it locates them with specialized workers whose educational background can be used more accurately and in sync with what they are looking for. This also does tuition cost a service as an institution like Coursera has all the ability to compete with universities if they were to be recognized by employers. I hope sarcasm is ringing its bells, because a zero cost tuition could equate to a complete reform of the tuition market.

Naveed, an environmental engineer explains that Coursera is in a way

“recycling information within the educational system.”

Within all this commotion and episodic dialogue there is a piece of thought I hope to shed light on. The importance of college tuition has become emphasized more than ever in the past decade and yet it’s also the worst time to get one. Maybe in a couple years when alternative forms of education are properly institutionalized, one can expect to find a secure job without carrying a load of debt. As stated, this takes time and a lot of effort considering that colleges would not like to see their tuition costs diminish. But another important aspect to also consider is innovation. The great country of USA has been excelling in innovation, but education has yet to reap its benefits. But with technological advancements already taking place in companies like Coursera maybe one day Coursera might be referred to instead as an institution rather than a company or site.

An economy is only as good as the families that profit from it. And while, this may be the worst time in this article to get sensitive, protecting and nurturing families has always been the end goal of having a good economy. The economy should never discriminate against class, race or ethnicity but unfortunately that is not the case. With tuition costs expected to increase, society can only expect to continue redlining certain audiences of the public.

Certain audiences would fall under immigrants, minorities –first generation college students who are only beginning to transition into post-secondary system. The time is more important than ever for a revolution for integration to occur but that is difficult to do when private lenders like Sallie Mae thrive from these very people. There is obviously a lot of sewage that drains from college tuition, but the problems leak far deeper than publicly acknowledged and it is important time to begin looking into these matters.

Otherwise we are headed into a catastrophe that could yield devastating systemic blow to the educational system, financial system and government. Based on the history of America’s economic and political system, it’s now more than ever that the cost of education is hurting the economy more than ever.

___________________________________________________________________________________________

References


http://pnpi.newamerica.net/sites/newamerica.net/files/program_pages/attachments/college%20published%20tuition%20and%20fees%20chart%20year.png

http://aspanational.files.wordpress.com/2011/12/collegestuition.jpg

http://xmiragestat.files.wordpress.com/2014/04/higher-education-increase.gif

http://www.clearpointcreditcounselingsolutions.org/how-to-pay-off-private-student-loans-from-sallie-mae-and-other-lenders/

The Future of America Rests on the Shoulders of Four-Year-Olds

President Obama’s State Union Address ignited a large (and pre-existing) conversation regarding universal preschool within the nation.

What has followed since is no longer a discussion of a better, earlier education for our nation’s toddlers, but a discussion about the benefits this will have for the whole nation.

To understand this we must first understand how it began. James Heckman, University of Chicago economist and winner of the Nobel Prize in 2000, was one of the first to advocate for a decrease in the “ability gap” in regards to college attendance amongst minorities when he was doing research on government jobs during the 1990s. What he discovered was that this gap was opened up strongly as early as children 3, 4 even 5 years of age.

Since then, there have been many articles as well as infographics that detail the educational benefits that preschool and early education provide to our children.

Blog Post#3RESIZED_LAUP-Kindergarten-Readiness-Benchmarks-FINALAnd while there is still a great emphasis on the educational standpoint that early childhood education advocates use as talking points, discussion is now gearing towards (and appealing to) the economic portion of the advocacy that comes from cultural optimism.

Even Heckman himself wrote a paper in 2004 of all the benefits “investing in young children” could bring forth for our country.

So how exactly do these toddlers become the heroes of our nation?

Taxes do not seem to be the answer to our nation’s search for preschool for all considering Obama’s proposition for this was to tax tobacco. A bit contradictory and also risky considering this implies people should be wasting more money in the tobacco industry; a majority of smokers are already part of the lower-income group (and counter intuitive if one mentions this universal preschool agenda seeks to benefit lower-income members of society).

No, the answer cannot stem from something entirely economic; the way of convincing people is the way it started—focus on the children (in order to secretly talk about everything else).

Putting the “Universal” in “Universal Preschool”

As Heckman mentioned in the 90’s, universal preschool begins by helping bridge the gap of “ability and access.

Blog Post#3

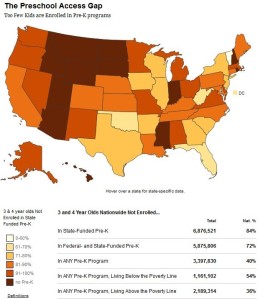
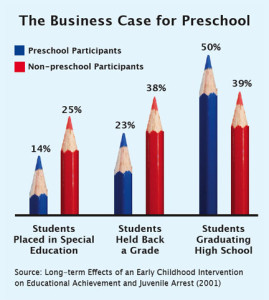
Universal preschool would mean that all four-year-old children would have access to a quality preschool regardless of income. This would then help children of all color get the education that they deserve, which would mean they would do better in school and have less of a chance of actually needing extra help as they continue through their educational career.

blogpost#3.2

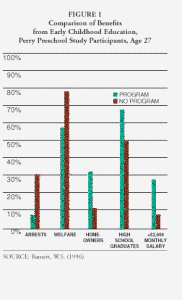
Children would then get older, but having gone to preschool, they would have less of a chance of being involved in crime, dropping out of high school or relying on government assistance as an adult.

summer2003_edissues1

Change helps create more change and by starting at the bottom and working our way up, can one appeal to a broader audience.

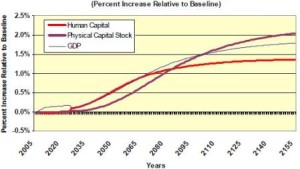
It is only then, after making the point culturally, that one can begin to talk about it economically again. As Dicken’s wrote in 2009, Blog Post#4.4.4.4humancapital“well-educated individuals are more likely to be employed at all points in their lives and live longer than those who are less educated which in turn increases labor supply and influences long-term GDP.”

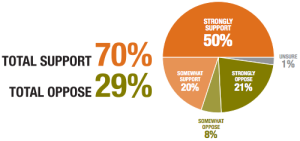
The benefits of preschool are with no question all positive ones. A majority of society is completely in favor of it.

blogpost#3.3_pool

But to depend on children to be the solution to an issue that has always existed is a cycle we continue to place in their hands.

Because after all, “children are the future.”

No pressure, kids.

Does China Have a Real Housing Bubble?

Q1 home sales in Beijing, Shanghai, Guangzhou and Shenzhen dropped more than 40% this year from the same quarter in 2013.

Real estate is a huge driver of China’s GDP growth.Housing market contributes 33% of fixed-asset investment, equivalent of 16% of GDP. The decade-long housing boom has so far defied the bubble warnings, which began as far back as in 2007.

Is China’s housing bubble real? That depends on whether China’s surging housing prices are backed by speculation or a real lack of supply.

China has more than 160 cities with more than one million people and many hundreds the size of San Francisco.China added 787 million square meters of new residential floor space in 2013. There has been excessive buildout—that means the current supply is sufficient.

However, before 2000, affordable properties were in massive construction to be sold to poor and middle-class families. Those flats are small and often share kitchens or bathrooms with the entire floor. And these houses are mainly in downtown, thus convenient for people to commute. Families, counting on them to save money for fancier and bigger flats, find them unable to sell and waiting to be bought out by developers when the land parcel sells. At the end of 2011, around 47% of China’s overall housing is such “crappy legacy housing.” Experts estimated only around one-third of home owners are living in “commodity houses”—while others hang on social or legacy housing. That means China might actually have a housing shortage.

What’s more, China’s household registration system limits who can buy property where, distorting potential demand and supply balance.

However, some argue that with building around 13.4% more floorspace each year, China finally has too much housing. For each person that moves to a city this year, developers will build around 121 square meters of new flooring. That number was 113 last year.

People, especially those in first-tier cities—Beijing, Shanghai, Guangzhou and Shenzhen, buy property in the big metropolises as investments.

But the first-tier cities’ account for only 5% of housing under construction and sales—and only 8% of overall housing investment in 2013. This is comparable to US property bubble burst when property prices did not collapse in New York, but instead in places like Orlando and Las Vegas. In China, the true risks property market might actually lie in third- and fourth-tier cities.

Tragedy of The Commons

0

Kiyoshi Kimura, president of Kiyomura Co, paid $1.76 million for the bluefin tuna he had won at the Tsukiji Market auction in January last year. As his staff towed the prized tuna back to his restaurant, the cart carrying the giant fish was surrounded by groups of professional photographers. He posed for a photo before he cut the tuna, his employees clapping hands in the background.

The picture that ran next to headlines about the eye-popping price tag for a single bluefin tuna is a snapshot of a lucrative industry spinning out of control due to a decade of overfishing under lax regulation.

Fed by ravenous demand from sushi lovers, Japanese and European fleets have exploited the commercial value of bluefin tuna and nearly depleted its stock in the Atlantic and the Pacific Ocean.

“The stock of bluefin tuna, by far the most valued tuna species, has been so heavily overfished in recent times that its collapse has become a very serious and threatening possibility,” said Fabio Hazin, chairman of The International Commission of the Conservation of the Atlantic Tunas (ICCAT), at a meeting in 2008.

Days after Kimura bought his tuna, the Pew Charitable Trusts announced the number of Pacific bluefin tuna has declined by 96.4 percent from pre-1950 levels. The eastern Atlantic bluefin spawning stock has plummeted by nearly 75 percent over the past four decades, according to reports from ICCAT, a Madrid-based regulatory body with 47 members and the European Union.

1

Half of that loss, says ICCAT, occurred between 1997 and 2007, a period commonly known as “the golden years” among European fishermen. When the market for bluefin tuna took off in the 1980s, the advent of ranches — large coastal pens for fattening the fish before trading them with the Japanese — transformed the economic outlook of the industry. During the two decades followed, European ranchers and Japanese conglomerates worked together to take advantage of a lack of regulatory oversight. They caught as many as they wanted, and rested assured that state government would take whatever catch number they report for granted. The French government helped expand their fleets with subsidy, only to fuel a black market where trading unreported catch has become an international routine.

From Nobody to Somebody

Bluefin tuna has very few natural predators, but the species paid a price for becoming one of the most sought-after fish among well-heeled sushi devotees in Japan and worldwide.

In the 1960s, bluefin sold for a tiny fraction of its market price today. It was mostly ground up for cat food in the U.S., and dish made out of its meat held little appeal to the Japanese who preferred white-fleshed fish and shellfish. There were plenty of stock of bluefin around the northwestern corner of America, but commercial fishers considered it a trash commodity and passed it on to be the targets of weekend sportsmen.

The turning point came when sushi bars went global in the next ten years: Americans turned out to have an appetite for “toro,” the fatty underbelly of tuna commonly used for sushi. In Japan, people had grown accustomed to meat with strong flavors and dark flesh. It was also about this time that Japanese cargo planes, after delivering electronics to the U.S. market, started buying up cheap bluefin tuna near New England to sell them at a good price back home.

By the 1970s, bluefin tuna had caught on in Japan, prompting the nation’s importers to take in large quantities from fisheries worldwide. Fishing for bluefin in the western Atlantic increased by more than 2,000 percent between 1970 and 1990, according to the International Union for Conservation of Nature. The average price paid to Atlantic fishermen for bluefin exported to Japan exploded by 10,000 percent.

Today, Japan consumes about 80 percent of the bluefin tuna caught globally. The country is home to the Tsukiji fish market, the world’s largest seafood wholesale center. There, the annual fish auction held on the first Saturday in January demonstrates how much hype there is around bluefin tuna. For patrons of the auction, winning the head of a single bluefin tuna at an outrageous price is a fight for status and free advertising. Kimura, who became widely known after he paid $1.7 million last year, also won the bid this year and in 2012.

2

The auction price, as shown above, has soared since 2008, before taking a nosedive early this year. “The wildly fluctuating price demonstrates only that the auction is subjective and distorted, dictated almost entirely by the bidders’ wealth and whims,” writes Emma Bryce, a reporter with The Guardian.

Ranching to the Utmost

During the golden age for catching bluefin tuna Japan’s demand turned several family businesses in France into fishing empires. But it was the advent of “ranching,” the industrial method of fattening bluefin in underwater pens before selling them on the market, that facilitated the ruthless catch, particularly in the Mediterranean Sea.

Originated in Australia, tuna ranches were introduced by Spanish and Croatian fishermen to the Mediterranean area around 1998, the same period when ICCAT instituted the first quota on bluefin tuna. The old-fashioned way was to catch the bluefin near the shore and kill them immediately before returning them to the port. The advanced method is much more complicated: Purse seiners transfer the catch to cages; Tugboats slowly carry the cages — for as long as a month — to circular underwater pens located in coastal waters; Fish in the ranches are then fattened for months on sardine, mackerel, and herring till their fat content, flavor and color match the demand of Japanese consumers. Tunas at harvest are shot in the head and kept cool in cold seawater slush; In the end, most of the fish are shipped deep-frozen to Japan on refrigerated vessels, while the rest are packaged and flown to Japanese markets, where they’d be auctioned off fresh. See a video on how ranching works below:

Those circular ranches revolutionized the industry. Fishermen were able to steer their vessels father from the port without worrying the fish caught would rot on their way back to the port. The deeper the water, the larger the bluefin, and the bigger the profit.

“What you gain is consistency in the quality and the supply, because you are not subject to seasonal factors,” says Rex Ito, president of Prime Time Seafood, a Los Angeles-based importer that provides 85 percent of the bluefin tuna needed in L.A. restaurants. “It’s an efficient way of producing a quality product.”

Earlier, the supply of fresh bluefin could only last for a few months per year, with just a tiny percentage of the catch being fat enough. The introduction of ranches means fishermen in his greatest capacity, and hold on to his stock till Japanese traders are ready to deal. For connoisseurs, a stable supply enables bluefin tuna to be on the menu year-around.

Tuna ranches, says Ito, is what gave rise to increased fishing capacity and over-catching. His biggest suppliers are located in Spain and Mexico, where bluefin tuna are ranched and sold to sushi bars in the U.S.

Compared to Spain’s long tradition in the bluefin business, Mexico is new in the game. The country, which now catches the majority of bluefin in the eastern Pacific Ocean, adopted the ranching technology around 2000.

“You wouldn’t necessarily save money by keeping the tuna in a cage and feed it. The process is actually fairly expensive. It’s quite an operation,” says Ito. “But farming or ranching is the future of a lot of seafood.”

3

In Europe, ranching has helped French fisheries strike a fortune between 1997 and 2007, depleting the stock of bluefin in eastern Atlantic Ocean by half, according to an investigative report from The International Consortium of Investigative Journalists, a global network of 185 investigative reporters.

In Sète, a small trip nestled along the Mediterranean Sea, bluefin fishing has been a regional vocation for generations of captains. But it was the rise of bluefin and the technique of ranching that made them one of the wealthiest fishermen communities in France. They now operate the world’s most productive tuna fishing fleet, of which 36 multimillion-euro vessels target bluefin tuna in the eastern Atalantic Ocean.

Government subsidies played a significant role in the renovation and expansion of Europe’s powerful fishing fleets. The European Union and its member states, encouraged by a strong market demand for bluefin tuna, has poured €26.5 million into vessels in Sète between 1993 and 2007. The average French purse seiner in 1998 was twice as long and four times as powerful as they were two decades ago. By 2008, there were 131 purse seiners in EU fleet, and another 500 ships owned by ICCAT members outside the EU. All of them served the cause of exploiting the bluefin community. For owners who took out bank loans to purchase their pricey vessels, the only way to repay the debt was to over catch.

Japanese companies, even though at the very end of the supply chain, chipped in with money. They are known as “the architects and financiers of the ranching industry,” because they partnered with Spanish and Croatian fisheries in building and running the facilities. Paco Fuentes, a business mogul from Spain, jointly ownes Drvenik Tuna, a Croatian ranch, with Japanese conglomerate Mitsubishi and local partner Conex Trade. The man also serves as the general manager of Fuentes & Sons, which has eight ranching subsidiaries in six countries. When interviewed on the dire state of bluefin tuna, Fuentes said he didn’t consider it “an endangered species.”

“There are a lot of small bluefin tunas in the Gulf of Lion waters [near France],” he told ICIJ reporters.

Fish Till You Drop, Authorities Say

Tuna ranches inspired fishermen to maximize the economic benefit of bluefin tuna, and brought sushi lovers a sufficient supply of toro meat. But when the feeding frenzy went unchecked, it became gateway to a decade-long, illegal fishing craze in the Mediterranean.

Seventy-five percent of the region’s bluefin tuna stock had disappeared between 1998 and 2007, says ICCAT. During the same decade, off-the-book trade in bluefin market is estimated to be $400 million per year, says ICIJ reports. One out of every three bluefin was illegally caught, and a majority of them were young fish that have not yet reproduced. In 2008, the amount of eastern Atlantic bluefin tuna traded on the global market was still 31 percent larger than ICCAT’s quota that year. In 2010, the gap peaked at 141 percent.4Ranching made it difficult to track the number of bluefin caught mainly because much of its operation is done underwater. Raising undersized fish may hardly be noticed when ranchers cleverly place them in a good adult mix; Fleets could transfer the fish immediately to another vessel without declaring the catch; A diver can simply stops videotaping and allows the fish to pass unrecorded when transferring them from net to cage, thus falsifying the catch number.

Unreported and illegal catches were fueled by a lack of accountability. One French fisherman named Nicolas Giordano told ICIJ that he and his peers declared freely their catch number until 2006 to the laissez-faire French government. “The administration didn’t do its job, and at the time no one took it seriously,” he says.

Until 2007, the French officials never bothered to verify the numbers reported, neither did the Spanish and Italian governments. They adjusted the figure further downward to meet the quota and then sent it to the European Commission, which in turn reported to ICCAT.

“The only country to give their real figures would get fined, so in that kind of game, everyone lies,” ICCAT scientist Jean-Marc Fromentin told ICIJ reporters.

In 2008, ICCAT introduced Bluefin Tuna Catch Documents, a paper-based catch documentation system aimed at tracking down every step of the bluefin trade along the supply chain. But only a handful of countries, mostly big players, have updated their documents since 2014. In response, ICCAT has put forward an electronic catch documentation system to counter the rampant black market.

Forging Ahead

Fuentes & Sons, now a leading seafood supplier in Spain, announced in December its plans to become the first to raise Atlantic bluefin tuna on land. The company would invest €5 million in building a hatchery for the endangered fish, with the expectation of producing about 500 metric tons by 2015.

Japan’s Fisheries Agency, on the other hand, has decided to rein in the nation’s catch of immature Pacific bluefin tuna. Starting in 2015, it would reduce by half the quota of bluefin tuna that are three years old or younger compared to the average catch number during 2002 and 2004.

The biggest market for bluefin has seen its officials turn down several batches of dubious bluefin imports in the past few years, but a moratorium on fishing bluefin seems unlikely given its popularity and economic value.

“They wanted the fatty fish and they recruited the people who could carry out this work for them. Now that the system is out of control and markets are saturated, they are scrambling to distance themselves from it,” said Sergi Tudela, head of Fisheries at WWF Mediterranean.

Reference:
http://www.theatlantic.com/international/archive/2014/01/sushinomics-how-bluefin-tuna-became-a-million-dollar-fish/282826/
http://www.icij.org/projects/looting-the-seas
http://www.theguardian.com/environment/world-on-a-plate/2014/jan/06/pacific-bluefin-tuna-auction-overfishing-sushi
http://www.bloomberg.com/news/2013-01-09/tuna-species-sold-at-record-price-faces-overfishing-study-says.html
http://www.nytimes.com/2010/06/27/magazine/27Tuna-t.html?pagewanted=all&_r=0
http://www.vanityfair.com/culture/features/2007/06/sushi200706
http://www.fis.com/fis/worldnews/worldnews.asp?monthyear=&day=11&id=67799&l=e&special=&ndb=1%20target=
http://bangordailynews.com/2014/03/23/business/japan-to-cut-bluefin-tuna-catch-by-half/
http://www.pewenvironment.org/uploadedFiles/PEG/Publications/Fact_Sheet/tuna-story-of-atlantic-bluefin-2013.pdf
http://www.pewenvironment.org/uploadedFiles/PEG/Publications/Fact_Sheet/tuna-story-of-pacific-bluefin.pdf

Tensions on a Closer Economic Tie between China and Taiwan

Tens of thousands of people protested outside Taiwan’s Presidential Office Building in downtown Taipei last month, stepping up pressure on President Ma Ying-jeou to re-examine a trade deal with Beijing.

At the heart of the protests is the Cross-Strait Service in Trade Agreement signed between Taipei and Beijing last year. The deal, according to the Taiwan government, will help boost the economy by opening service sectors such as banking, health care and food catering to companies across the Taiwan Strait.

So what are the grievances? The most widely held complaint of the protesters is that the agreement passed with little public review. Protesters accused the government of “black box” and have dubbed campaign the Sunflower Movement, meaning sunlight and transparency.

The protesters were also worried China will exert more control over Taiwan’s economy and leave small- to medium-size enterprises in Taiwan struggling to compete. They feared that China’s efforts to absorb the island into its economy are a malicious scheme for ultimately reunifying straits. The main opposition party, the Democratic Progress Party, has been relentlessly against any moves to go closer to its giant neighbor even if on trivial things like allowing more tourists to visit Taiwan.

Resistance to the deal in Taiwan indicated that the Mainland’s strategy of trying to win Taiwan’s heart economically through closer economic ties may not be working.

After the Communist forces led by Mao Zedong won China’s civil war in 1949, Generalissimo Chiang Kai-shek fled to Taiwan with his defeated Kuomintang armies. For decades, hostilities between the Kuomintang government in Taiwan and the Chinese Communist Party led to a policy on the Taiwan side of “no contact, no compromise and no negotiation.”

China has long claimed Taiwan as a part of its territory, It fired missiles over the Taiwan Strait in 1995 and 1996 in response to President Lee Teng-hui’s call for Taiwanese identity. During the 2000-2008 reign of Chen Shui-bian, China frequently condemned him of is his Taiwan independence inclination. In 2005, China passed an anti-secession law that allowed the use of force in the event of a formal declaration of Taiwan’s independence.

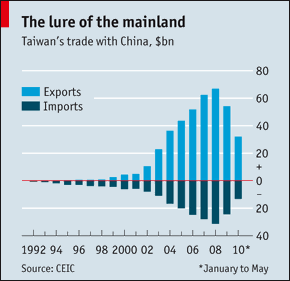
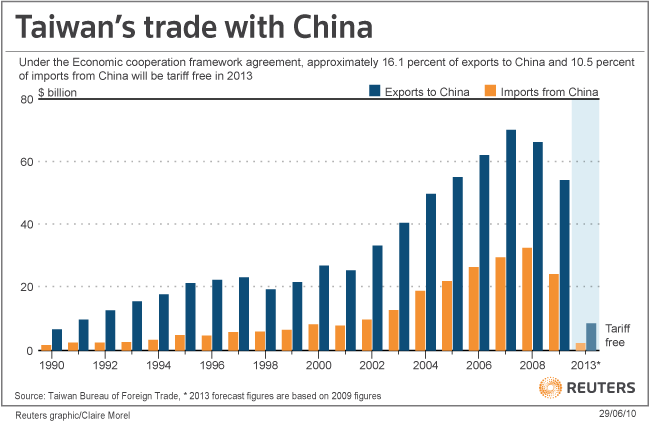
After Mr. Ma took presidency in 2008, the two sides began signing a range of economic agreements including the landmark Economic Cooperation Framework Agreement (ECFA) in 2010. ECFA cuts tariffs on 539 Taiwanese exports to China and 267 Chinese products entering Taiwan. Two-way trade doubled since 2008, reaching $197 billion last year.

Beijing tried to use tariff cuts on half as many products from Taiwan to Mainland to appease opponents who warned that Taiwan will be flooded by cheap Chinese products with small businesses squeezed and jobs stolen.

taiwanTaiwan-ChinaTrade

nihao

The Taiwanese government has said it believes the ECFA will help create 260,000 jobs and boost economic growth by as much as 1.7%.

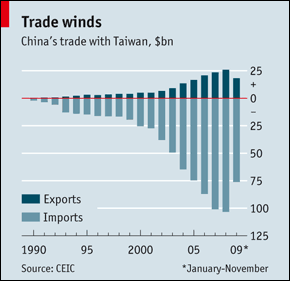
Taiwan’s economy depends on trade, and China is its biggest export market and source of a huge trade surplus. China is central to the supply chains of Taiwanese manufacturers, and the destination to 80 percent of Taiwanese foreign direct investment.

Today, 118 airline flights fly back and forth between Taiwan and 54 cities in China per day, mainly packed with Taiwanese businesspeople mainland tourists. Seven years ago, such flights were banned.

There are also over one million Taiwanese working and living in China.

One of the biggest Taiwanese companies, Foxconn Technology, which assembles Apple products, employs hundreds of thousands of workers in Mainland China.

The service agreement centered in this event would open 80 Chinese industries to investment from Taiwan, while Taiwan’s side would open 64. In addition, Taiwan reserves the right to apply many barriers and restrictions. Mr. Ma said that was a sign that China was sacrificing more while Taiwan will be benefitted more in the deal.  He argued the deal would create 12,000 jobs and boost service exports by $394 million, nearly a quarter of cross-Strait trade last year.

Ma said, Taiwan, as one member of the “the Four Asian Tigers ”, has already lagged behind regional rivals like South Korea and Singapore and he warned that failing to pass the pack will impede Taiwan to enter other economic agreements, like the American-led Trans-Pacific Partnership.

Chen Deming, China’s chief negotiator in the trade talks with Taiwan, told Xinhua News Agency that he would be “deeply regretful” if the pact isn’t passed in Taiwan. He cited the huge complementarity of the two sides economies as the reason why the deal could be tremendously beneficial to Taiwan’s economy.

Merril Lynch forcasts Taiwan’s economy will grow at 2.9% if the bill passed and 2.55 of it’s delayed into next year.

Many experts argued that with China’s rapid rising in today’s world and Taiwan’s sluggish economy, It is increasingly harder for Taiwan to pay the price of ignoring its giant neighbor.

“The bottom line is that if the same deal was between Taiwan and pretty much any other country in the world it wouldn’t be a problem,” Jonathan Sullivan, an associate professor at the University of Nottingham’s School of Contemporary Chinese Studies told New York Times. “But Taiwan’s relationship with China is unlike any other in the world. And depending on who you talk to, China is Taiwan’s only way to peace and prosperity or an existential threat.”

“Taiwan’s service industry accounts for more than 60 percent of its GDP. However, Taiwan manufacturers got more opportunities in Mainland than service providers. That does not reflect Taiwan economy’s real balance,” said Xianghong Hua, an economic professor at the University of International Business and Economics. “ Then this pact is a perfect opportunity for Taiwan to adjust its investment structure in China, which is definitely mutually beneficial.”

In essence, Beijing, known as a tough negotionator, offered Taiwan a special deal that other countries would kill to get.

Chung-Hua Institution for Economic Research, a government think tank, said the agreement could add 12,000 jobs to Taiwan’s services industry, mainly in retail and storage sectors. It could also add around 0.025-0.034 percentage point to Taiwan’s gross domestic product.

In response to people’s ingrained anxiety about closer economic integration with Beijing, Taiwan’s government said it would earmark nearly US$3 billion to help small and medium enterprises survive or transform themselves against rising competition from across the strait

“Due to globalization and Taiwan’s maturing market, those SMEs are facing a tougher business environment whether there is a services trade pact with China or not. But they just don’t know how they will be assisted, of course they are against the deal,” Mr. Luo, an economist at Fubon Financial Holding told Bloomberg.

Some experts believe The Trade in Services Agreement will not benefit Taiwan’s services exports.

About 2.4 million of its 6 million workers are employed in Taiwan’s 1 million shops and services. Taiwan’s domestic services sector including local retail, printing, e-commerce, logistics, mass transport is in vibrant competition while China’s services sector is far more centralized, and subject to government regulations.

In addition, Taiwanese businesses already have far more access to China’s services sectors than any other foreign investors. However, Taiwanese investors in Mainland do not enjoy the same shields from arbitrary law enforcement, regulations and contract disputes as investors from other countries, which have embassies. Chinese investors, however, in Taiwan’s services industry can be operated in a modern democracy with a rule of law.

Taiwan’s banking institutions are too small and too competitive among themselves to have any structural impact in China’s financial services market. On the other hand, China’s financial institutions are all centrally controlled and have much more capital. The agreement gives Chinese banks and institutions up to 20 percent ownership in Taiwan counterparts, which will exert am effective control. But it is almost impossible for an y Taiwan  institution to have the same impact in China’s banking system.

Under the pact, investment threshold of $200,000 allows the investor to bring 21 new immigrants from China— three employees and up to seven family members per worker. That further inflamed Taiwan’s concern about the scenario of flocks of immigrants and small businesses being swamped.

Like the United States, Taiwan has seen thousands of good jobs move offshore, most of them to China. University graduates in particular complain that there aren’t enough decent jobs for them.

“They are stealing our jobs,” said Godwin Wang, an assistant vice president at Farglory Free Trade Zone Co., which provides air cargo and other services to importers and exporters. Farglory’s warehouse space by the airport is half full, he told Wall Street Journal days before the students took to the streets. “We are suffocating.”

However, China is not solely responsible for all of Taiwan’s economic predicaments. Taiwan has been hit hard by weak global demand since the Great Recession, due to the slow recovery in the United States and other large markets.

Many experts pointed out that Taiwan is hindered by structural weaknesses. Among them are excessive government regulation, the world’s lowest birth and a pattern of developing small businesses instead of giant corporations without giving them enough help.

Taiwan’s economic development paled in face of some of its faster-growing neighbors, especially South Korea.

In recent years, with the rise of global powerhouse companies such as Samsung and Hyundai, Korea’s economy has been far more dynamic, leaving many Taiwanese to wonder where they have gone wrong.

Nonetheless, many Taiwanese see China as the biggest, most immediate issue.

A poll conducted on March 20th-21st by TVBS found that nearly half of respondents supported the students’ action and opposed the trade pact. Only a fifth were in favor of the deal.

However, a free trade agreement is something unavoidable between Mainland China and Taiwan. Trade with mainland China is vital to Taiwan’s future economic development and future integration into the global economy. It is not possible for Taiwan to compete in the world without signing a lot of FTAs (free trade agreements), including (with) mainland China.


References:

http://www.bbc.com/news/world-asia-pacific-11275274

http://www.bloomberg.com/news/2014-04-10/taiwan-students-to-end-24-day-occupation-of-legislature-today.html

http://www.bbc.com/news/world-asia-pacific-11275274

http://online.wsj.com/news/articles/SB10001424052702303978304579470552484527172

http://www.washingtontimes.com/news/2014/apr/1/tkacik-taiwan-struggles-in-chinas-grip/?page=all

http://www.businessspectator.com.au/article/2014/3/24/china/why-taiwanese-protestors-are-wrong-china-trade-pact

http://www.economist.com/news/asia/21599807-students-occupy-taiwans-legislature-protest-against-free-trade-pact-china-manning

http://articles.latimes.com/2014/apr/04/business/la-fi-taiwan-economy-20140405

http://thediplomat.com/2014/02/to-counter-beijing-japan-moves-closer-to-taiwan/

http://america.aljazeera.com/articles/2014/2/15/what-s-next-for-chinataiwanrelations.html

http://www.reuters.com/article/2014/02/11/us-china-taiwan-idUSBREA1A0EP20140211

http://www.forbes.com/sites/russellflannery/2014/05/04/a-free-trade-agreement-is-something-unavoidable-between-mainland-china-and-taiwan/