The Advance Report on Durable Goods Manufactures’ Shipments, Inventories and Orders is a monthly report released by U.S. Census Bureau, part of which indicates dollar value of new orders of durable goods made by more than 4,000 manufacturers. These goods are expected to have a useful life of at least three years and higher prices. They include defense aircraft, automobiles, furniture, computer equipment and etc.
Businesses are not doing that purchase so often. Once paying a huge amount of money, manufacturers are expecting a long useful life from these goods and showing confidence in the economy, otherwise they will held the decision until the economy is promising enough.
The orders of durable goods placed by manufacturers can cause a chain of economic changes. Since the durable goods are often purchased to replace the old ones or as supplements, a higher efficiency and more supply can be expected. As supply produces it’s own demand, consumer purchase usually rises while manufacturers providing more goods. Workers in the supply chain will have more working hours and lead to the change of non-farm payrolls. In a long run, when the supply-and-demand balance has been affected, it will further place an influence on inflation or deflation.
Similarly, shipments of orders will increase the need for transportation businesses. In addition, the change of shipment/inventory ratio will also affect the supply-and-demand balance.
The index of durable goods orders has long been used as an important barometer of economy. As the graph below shows that the Durable Goods Orders are correlating to the changes happened to GDP.
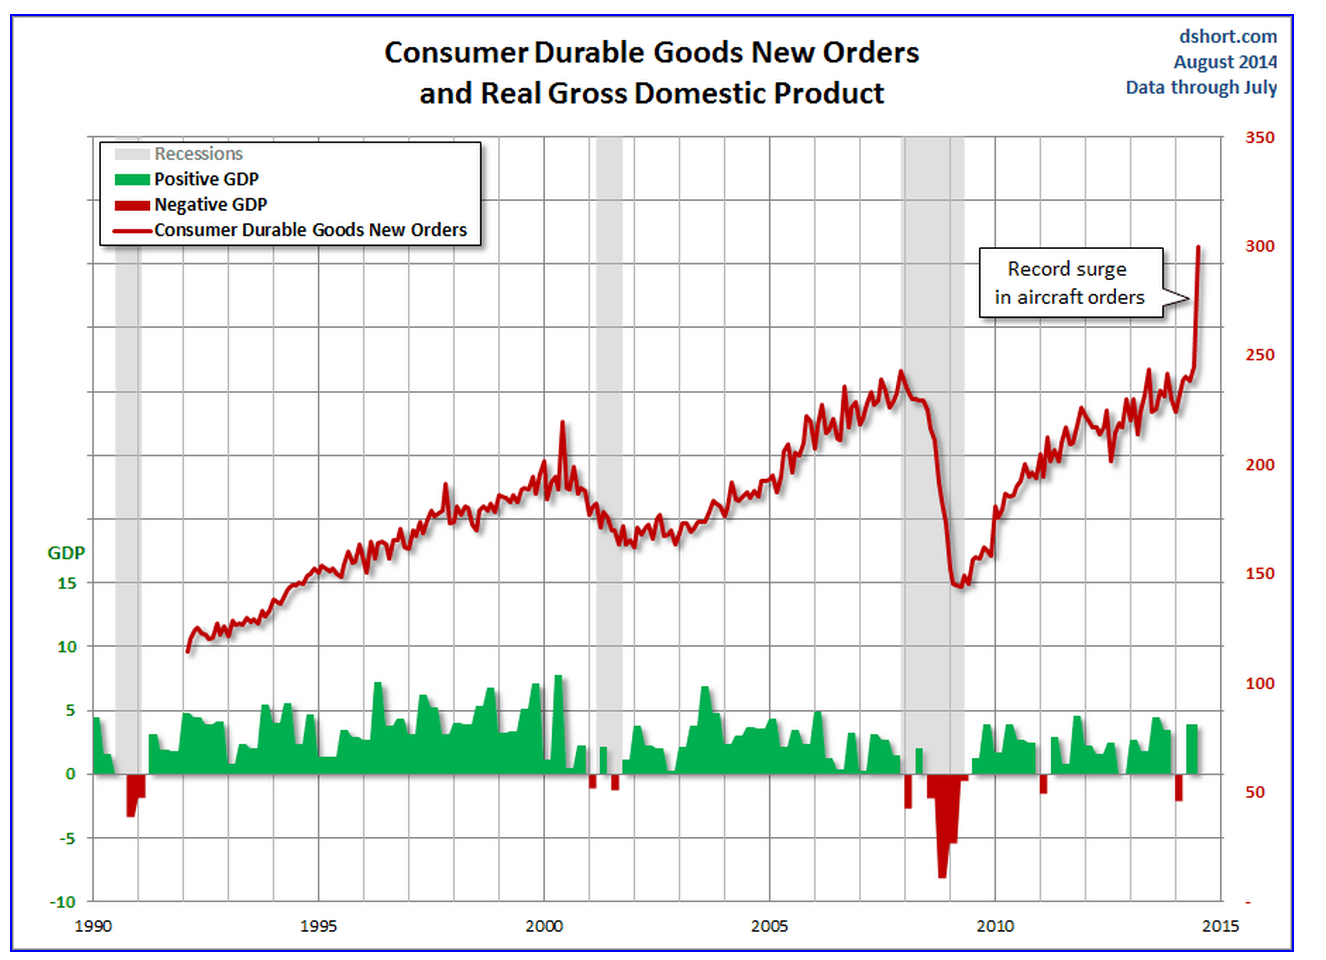
Consumer Durable Goods New Orders and Real Gross Domestic Product
When the unemployment rate is reverted, it shows correlations to durable goods orders. It’s easy to find that durable goods orders usually drops earlier than the upcoming recessions, while the unemployment rate will lag the rise of durable goods orders after suffering from the hard times. As a result, the durable goods orders indicate the confidence in the economy and often predict significant economic changes.
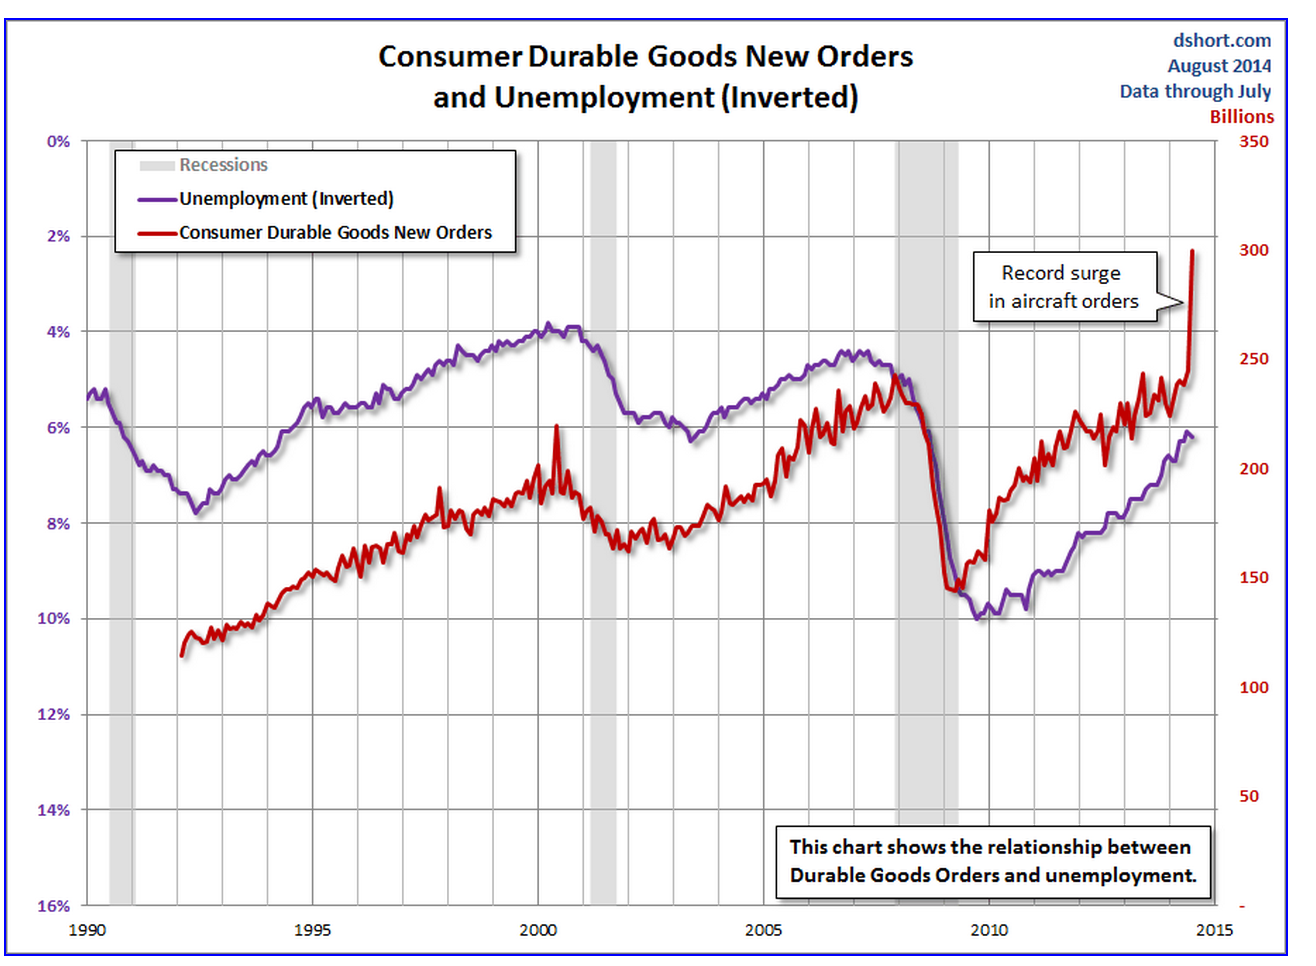
Consumer Durable Goods New Orders and Unemployment (Inverted)
The data of durable goods orders are collected and released month by month, so it’s a timely feedback and indicator for many to make their right investing decisions.
Despite all the strengths, durable goods orders are volatile due to some unexpected purchases made for transportation and defense.
For example, according to the U.S. Census Bureau, orders for manufactured durable goods in July has increased $55.3 billion or 22.6 percent to $300.1 billion. But this surge mainly comes from bookings for civilian aircraft. Boeing has said that it received 324 aircraft orders in July. The following news from Bloomberg shows how the unexpected orders affected July’s Durable Goods Orders.
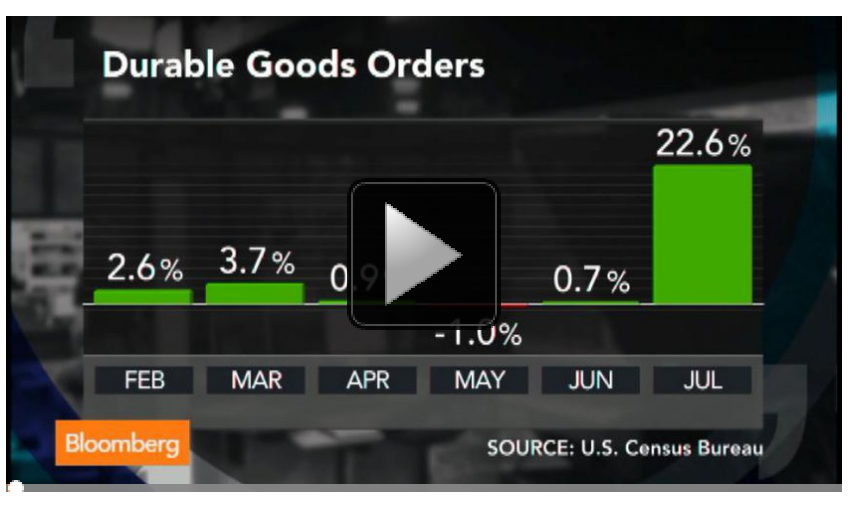
So “excluding transportation, new orders decreased 0.8 percent. Excluding defense, new orders increased 24.9 percent” for July.
Therefore, when making predictions, defense and transportation orders are often leave out. The graph below, contrasting durable goods orders with those excluding transportation and defense, shows the substantial volatility of transportation and defense.
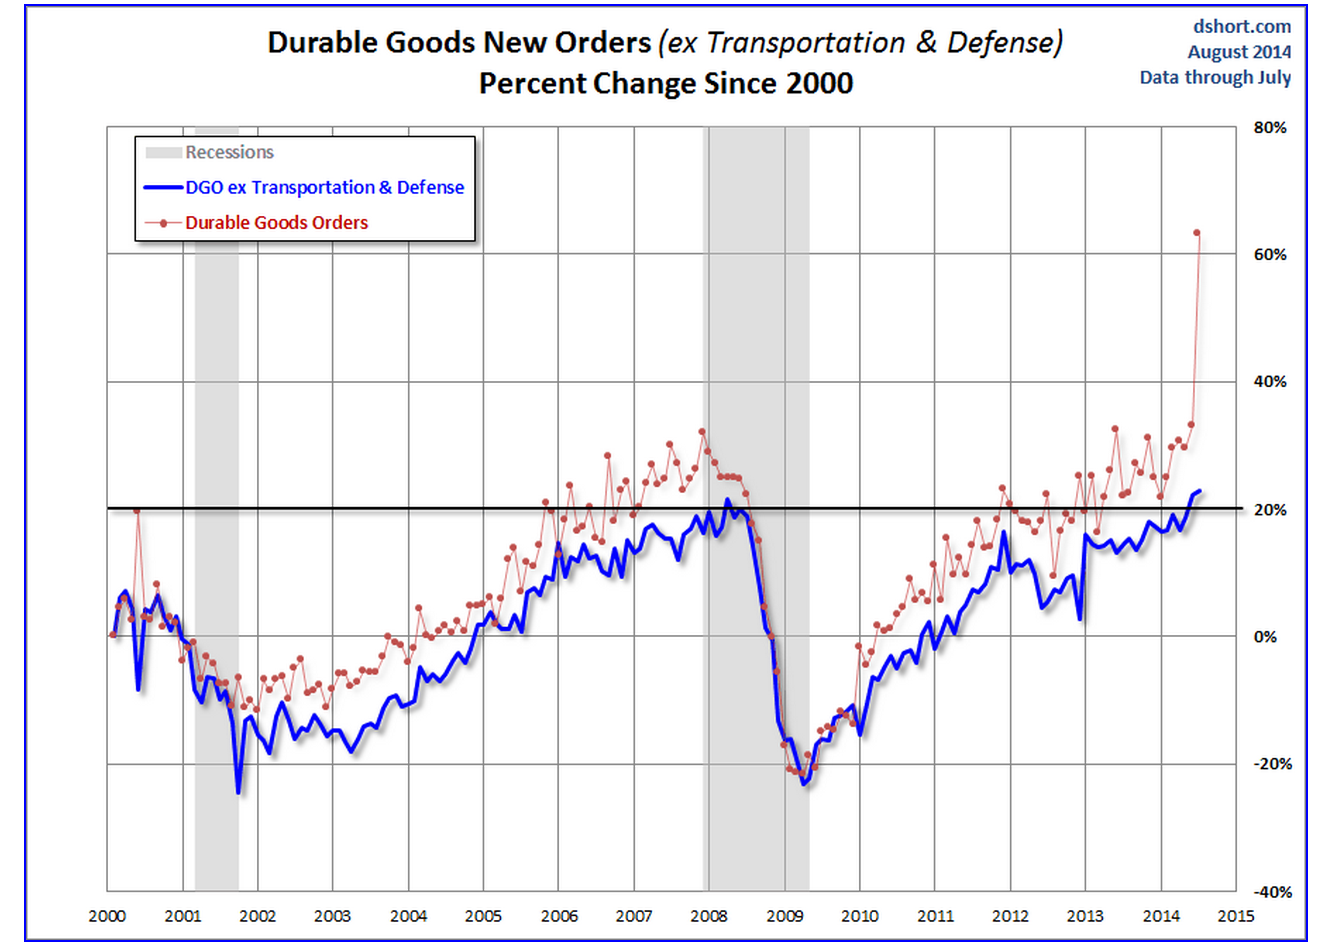
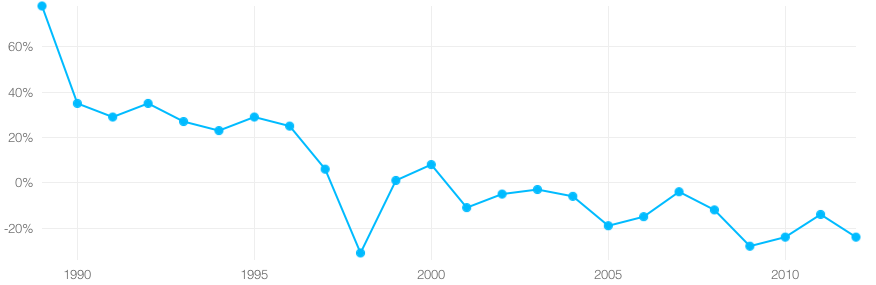
Core Capital Goods New Orders (ex Transportations &Defense) Percent Change Since 2000
As a result of the constantly fluctuating and unexpected orders from transportation and defense, the number for a particular month may not wisely suggest the change for the whole market. While, the annual changes may be more worth noticing.
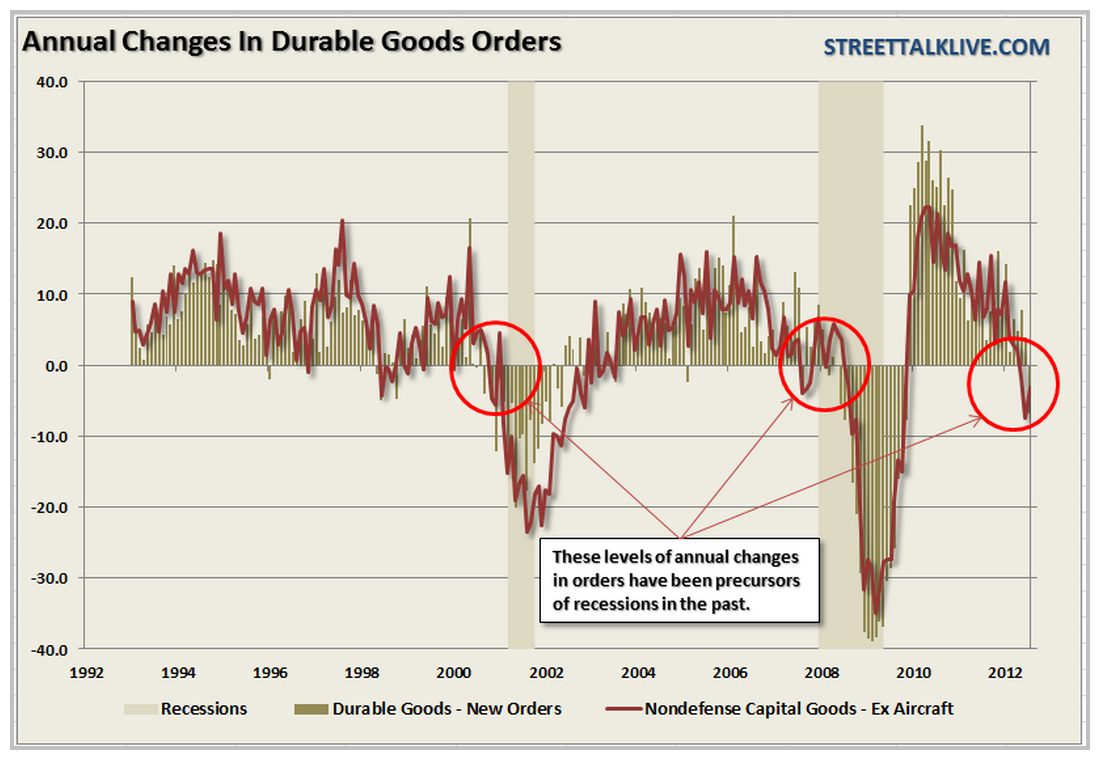
Annual Changes In Durable Goods Orders