A layer of smog rests over the Los Angeles Basin in Sept. 2007. (Flickr user vlasta2, CC BY-NC-ND 2.0)
When California Gov. Jerry Brown signed major climate legislation in June, he returned to the spot where his predecessor, Arnold Schwarzenegger, signed his own climate law more than ten years earlier: Treasure Island.
It was an apt location. The artificial island in the San Francisco Bay was created in the 1930s to showcase California’s grandeur for the World’s Fair. Likewise, these climate bills are intended largely to demonstrate to the world that California is leading on climate change.
Schwarzenegger signed Assembly Bill 32 into law in 2006, setting the stage for the creation of California’s cap-and-trade program. A concept that’s been around for only a few decades, cap-and-trade aims to create financial incentives for polluters to adopt more eco-friendly technologies and reduce their greenhouse gas emissions. Brown extended the program to 2030 on Treasure Island and created more ambitious targets.
The state’s goal is to reach 1990 levels of greenhouse gas emissions by 2020, despite a projected population increase of nearly 37 percent over 1990. In 2017, that goal was toughened to reach 40 percent below 1990 levels by 2030.
But so far, it’s been hard to measure the cap-and-trade program’s success, and market-based approaches to the environment can have many of the same flaws and failures found in other kinds of markets. The state’s efforts to address these flaws led to redundant “complementary” policies, meaning that the centerpiece of California’s climate policy actually only plays a small part in its emissions reductions.
A modern cap-and-trade system is designed to reduce greenhouse gas emissions through a flexible market rather than one-size-fits-all regulation. By putting a price on greenhouse gases and creating a market to trade them, the system creates economic incentives for firms to reduce their emissions in the way that’s most cost-effective. To reach the state’s 2020 goal, emissions will need to be about 15 percent below a “business as usual” scenario.
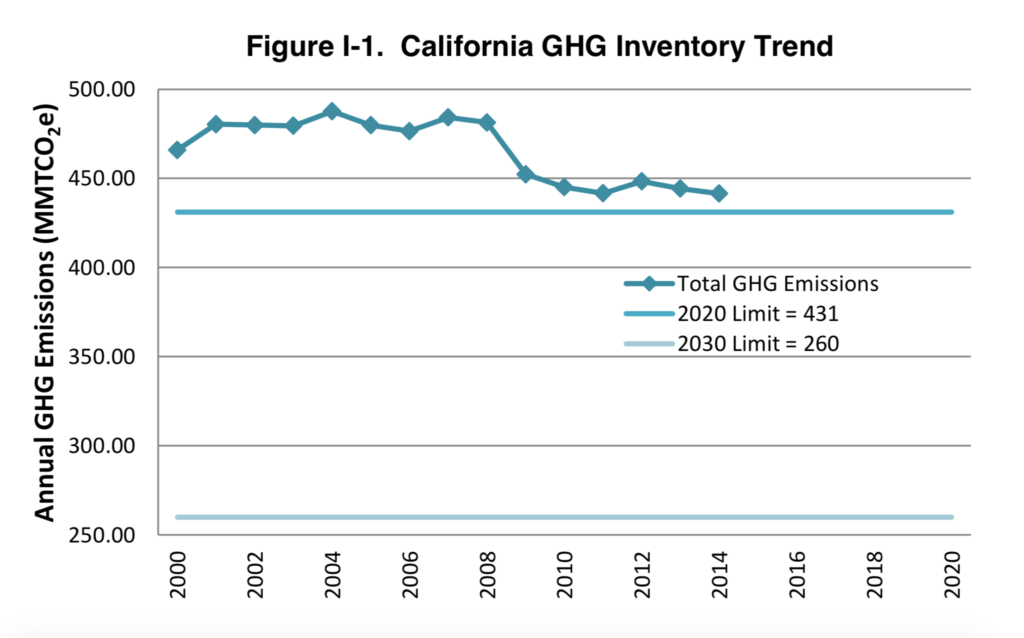
The California Air Resources Board keeps track of the state’s greenhouse gas emissions. This chart from CARB’s 2017 Scoping Plan shows emissions from 2000 to 2014.
To illustrate how this works in practice, let’s imagine you run a natural gas power plant and you produce 100 tons of CO2-equivalent in a year (in reality, this figure would be much higher). Knowing that you emit 100 tons, the California Air Resources Board would issue you 100 carbon credits. You’d get most of them for free, but a few would need to be purchased on the market, either from the state or from other polluters. The idea is that you would save money by taking steps to reduce your emissions rather than purchasing credits, and then if you use fewer than what you’re given for free, you can sell the rest and make a profit. The total number of credits given by the state decreases every year to encourage emissions reductions.
California’s cap-and-trade system began on Jan. 1, 2013, with large power plants and industrial facilities. It was expanded to fuel distributors in 2015, meaning that cap-and-trade now affects about 85 percent of greenhouse gas emissions in the state. Some major companies in the state, like electric utility Pacific Gas and Electric, which serves nearly two-thirds of California’s geographic area, have said they support the program as the best way to address climate change.
In the United States, California has the most extensive cap-and-trade system, which affects all companies emitting more than 25,000 tons of CO2-equivalent in a year. By 2018, its market will be linked to both the Quebec and Ontario emissions markets (more on this later). There’s also a regional cap-and-trade system for electric utilities in New England, and there have been others in the past, such as one created in the 1990s to reduce acid rain-causing emissions. But no nationwide emissions trading system exists today in the U.S. The last big effort to create one, the Waxman–Markey bill in 2009, passed in the House but fell through in the Senate after facing opposition from senators from coal-reliant states.
So far, emissions auctions in California have raised nearly $5 billion for the state, according to the state Legislative Analyst’s Office. State law requires this money to be spent on projects that further reduce greenhouse gas emissions. More than $1.3 billion has been spent on the state’s high-speed rail project, and nearly $700 million each has been spent on low carbon vehicle incentives and affordable housing programs.
Critics of cap-and-trade policy say it’s burdensome for businesses and have pointed to high-profile companies like Toyota moving their operations out of California. But USC environmental economist Kate Svyatets said the state has been successful in balancing competing interests: economic freedom and environmental protection.
“A lot of businesses, instead of being overburdened, they make money,” Svyatets said. “It’s possible to have both a cleaner environment and economic growth, and California shows how to achieve it.”
For most economists, cap-and-trade is the “preferred solution” for regulating greenhouse gas emissions, UCLA researcher Ann E. Carlson wrote in the Harvard Journal on Legislation. Other methods of emissions control, like a carbon tax or mitigation rules, require direct government enforcement and are not as economically efficient as a market system can be — they impose a price on carbon on the state rather than letting one emerge through economic activity.
“It’s hard for the government to decide exactly how many carbon credits to allow,” Svyatets said. “The carbon experts say it’s not expensive enough yet. It’s still better than nothing, but it’s not expensive enough for some companies to switch to clean technology.”
But though California’s cap-and-trade system is designed to create price incentives to reduce emissions, it has not been very instrumental in doing so. The emissions cap each year has been higher than actual emissions in the state, meaning that the emissions trading system does not have the chance to seriously affect how polluters behave. Prices on the emissions market also fell precipitously in 2016 as a court case made the program’s future uncertain. They’ve since rebounded but remain near the state-mandated price floor.
When emission credits don’t cost enough, it becomes cheaper for firms to pollute than to invest in methods that would reduce their emissions in the long term. The European Union is an example of this. It started its cap-and-trade system in 2005, but the European Commission allowed too many credits in the market. Prices fell to ineffective levels by 2008, and companies were profiting off the EU’s mistake by selling the extra credits.
As in California, the prices have since stabilized. At the time of writing, the allowance to emit a ton of greenhouse gases costs roughly $7 in the EU, compared to $13 on California’s market. The 2017 price floor in California is $13.57.
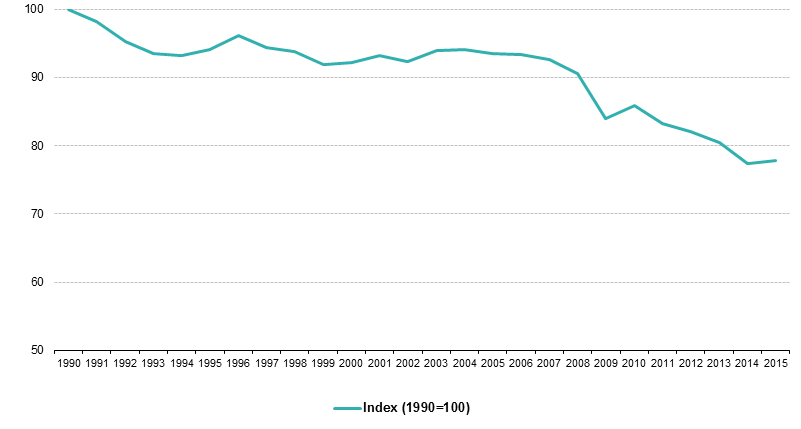
This chart from the European Commission of the European Union shows how the EU’s greenhouse gas emissions have changed since 1990. The data are shown as an index, with 100 being the 1990 level.
Carlson said that when emissions trading systems don’t work, “policymakers may need to enact complementary policies to address those market failures.” California has supplemental requirements like the Renewable Portfolio Standard, which requires an increasing portion of electricity sold in the state to come from renewable and emissions-free sources, and the Low Carbon Fuel Standard, which requires gasoline and diesel fuels to be less “carbon-intensive.”
These policies are perhaps the greatest limit to cap-and-trade’s effectiveness. The complementary policies are responsible for about 80 percent of emissions reductions, with cap-and-trade in place to “sweep up remaining cuts,” according to MIT researchers’ interviews with California officials.
All three policies were created together in what the researchers have called an “insurance” policy to “create a mechanism that could make up emission reduction efforts that were lost if any of the major complementary policies were to fail.” In a way, this means that cap-and-trade in California is intended to be largely a backup plan in case the state’s other policies are not enough. This limits the role that the market has and therefore the incentive for polluters to reduce emissions in the most cost-effective way.
One common issue in many markets is a lack of competition or the monopolization of resources, but despite some speculative activities in emissions trading, anti-competitive behavior hasn’t been a problem in large markets like the European Union or California. German researchers found that those kinds of issues only arise in small trading pools, such as the RECLAIM market for nitrous oxide and sulfur oxide emissions in Southern California.
“Firms within the same industry do not want to sell allowances to buyers with whom they [otherwise] compete,” the researchers wrote. But in large cap-and-trade systems with diverse stakeholders, this has not been a problem.
To make emissions trading systems even more competitive, governments have sought to link their markets with others, allowing credits to be sold across them. More buyers and sellers of emissions means more competition and less room for market abuse.
“If you have a very small market, what if nobody wants to buy your allowances? Just imagine you want to sell a used car or your cell phone or something,” Svyatets said. “If it’s just you and I in this market and nobody else, what if I don’t want your cell phone? What if I don’t want your car?”
But linkages introduce a problem seen in other cases of cross-jurisdictional common markets, like the European Union. When the Greek debt crisis struck that country in 2008, leaders at the European Central Bank found their hands tied when it came to monetary policy to relieve the nation’s ensuing recession. According to UCLA researcher Juliet Howland, linked emissions trading systems could face a similar problem in which one government “may not be able to regulate the price of carbon credits in order to prevent serious damage to [its] economy.” The MIT researchers found through their interviews that California’s system was intended to be flexible for linkages with other western states (which later abandoned their cap-and-trade ambitions), but were concerned that it could be hurt by linkages to weaker cap-and-trade markets.
Linked emissions systems don’t even have to be geographically close — California’s market is linked to the province of Quebec and soon to Ontario, while the European Union has started the process of linking its system to Australia’s. The thought is that in tackling a global problem, it doesn’t matter where greenhouse gas emission reductions happen as long as they happen somewhere.
But California has taken steps to ensure local benefits for its cap-and-trade program. Twenty-five percent of funds are automatically earmarked for high-speed rail, plus 20 percent go to affordable housing and 10 percent to transit systems. All revenues from the sales of emission credits on auction go toward programs that the state says promote public health, and by law, one-quarter of revenues must benefit “the state’s most disadvantaged and burdened communities.”
Those communities, it turns out, are some of the most affected by climate change.
California’s cap-and-trade system aims to reverse course on greenhouse gas emissions to help protect all communities from the harmful effects of global climate change. But despite its large potential impact, the program in practice is only secondary to the state’s more heavy-handed regulations.
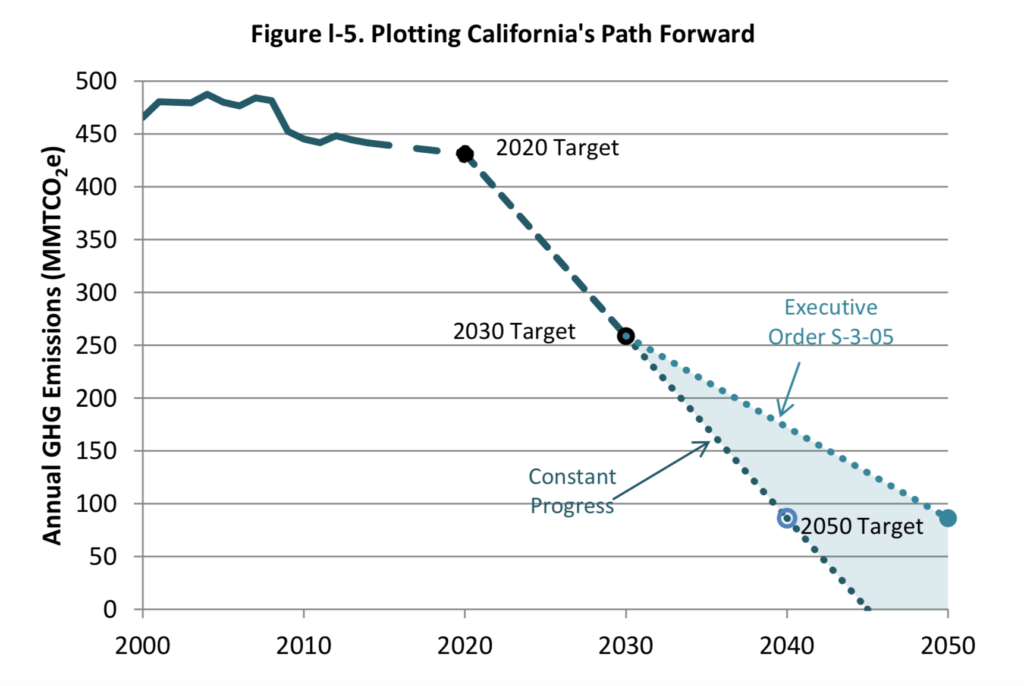
This chart from the California Air Resources Board’s 2017 Scoping Plan shows that potential statewide greenhouse gas emissions reductions under the continuation of planned policies would exceed those required under the governor’s executive orders.
That could change. The California Legislative Analyst’s Office found in 2017 that the state was on track to meet its 2020 emissions goal, but the 2030 target is much more ambitious and will require much more severe greenhouse gas reductions.
The cap-and-trade program will likely become more essential over time as the cap becomes increasingly tighter, but this will increase the burden on polluters too and potentially increase costs for consumers. The analysts estimated that some policies needed to reach the 2030 target could cost $300 per ton of carbon dioxide equivalent — or more than 20 times the current price for one allowance on the cap-and-trade market.
Who will be hit hardest by the cost of these reductions remains to be seen, and the impact on the economy is unclear. The analysts said long-term carbon prices depend on factors that are “highly uncertain,” and the state Department of Finance does not provide economic growth projections past 2020.
For now, the California Air Resources Board is working on a plan to reach its 2030 emissions goals. What comes out of those meetings will determine the future of California’s climate policy.
