The Big Three’s Foray into Tiered Wages

Troubled Waters

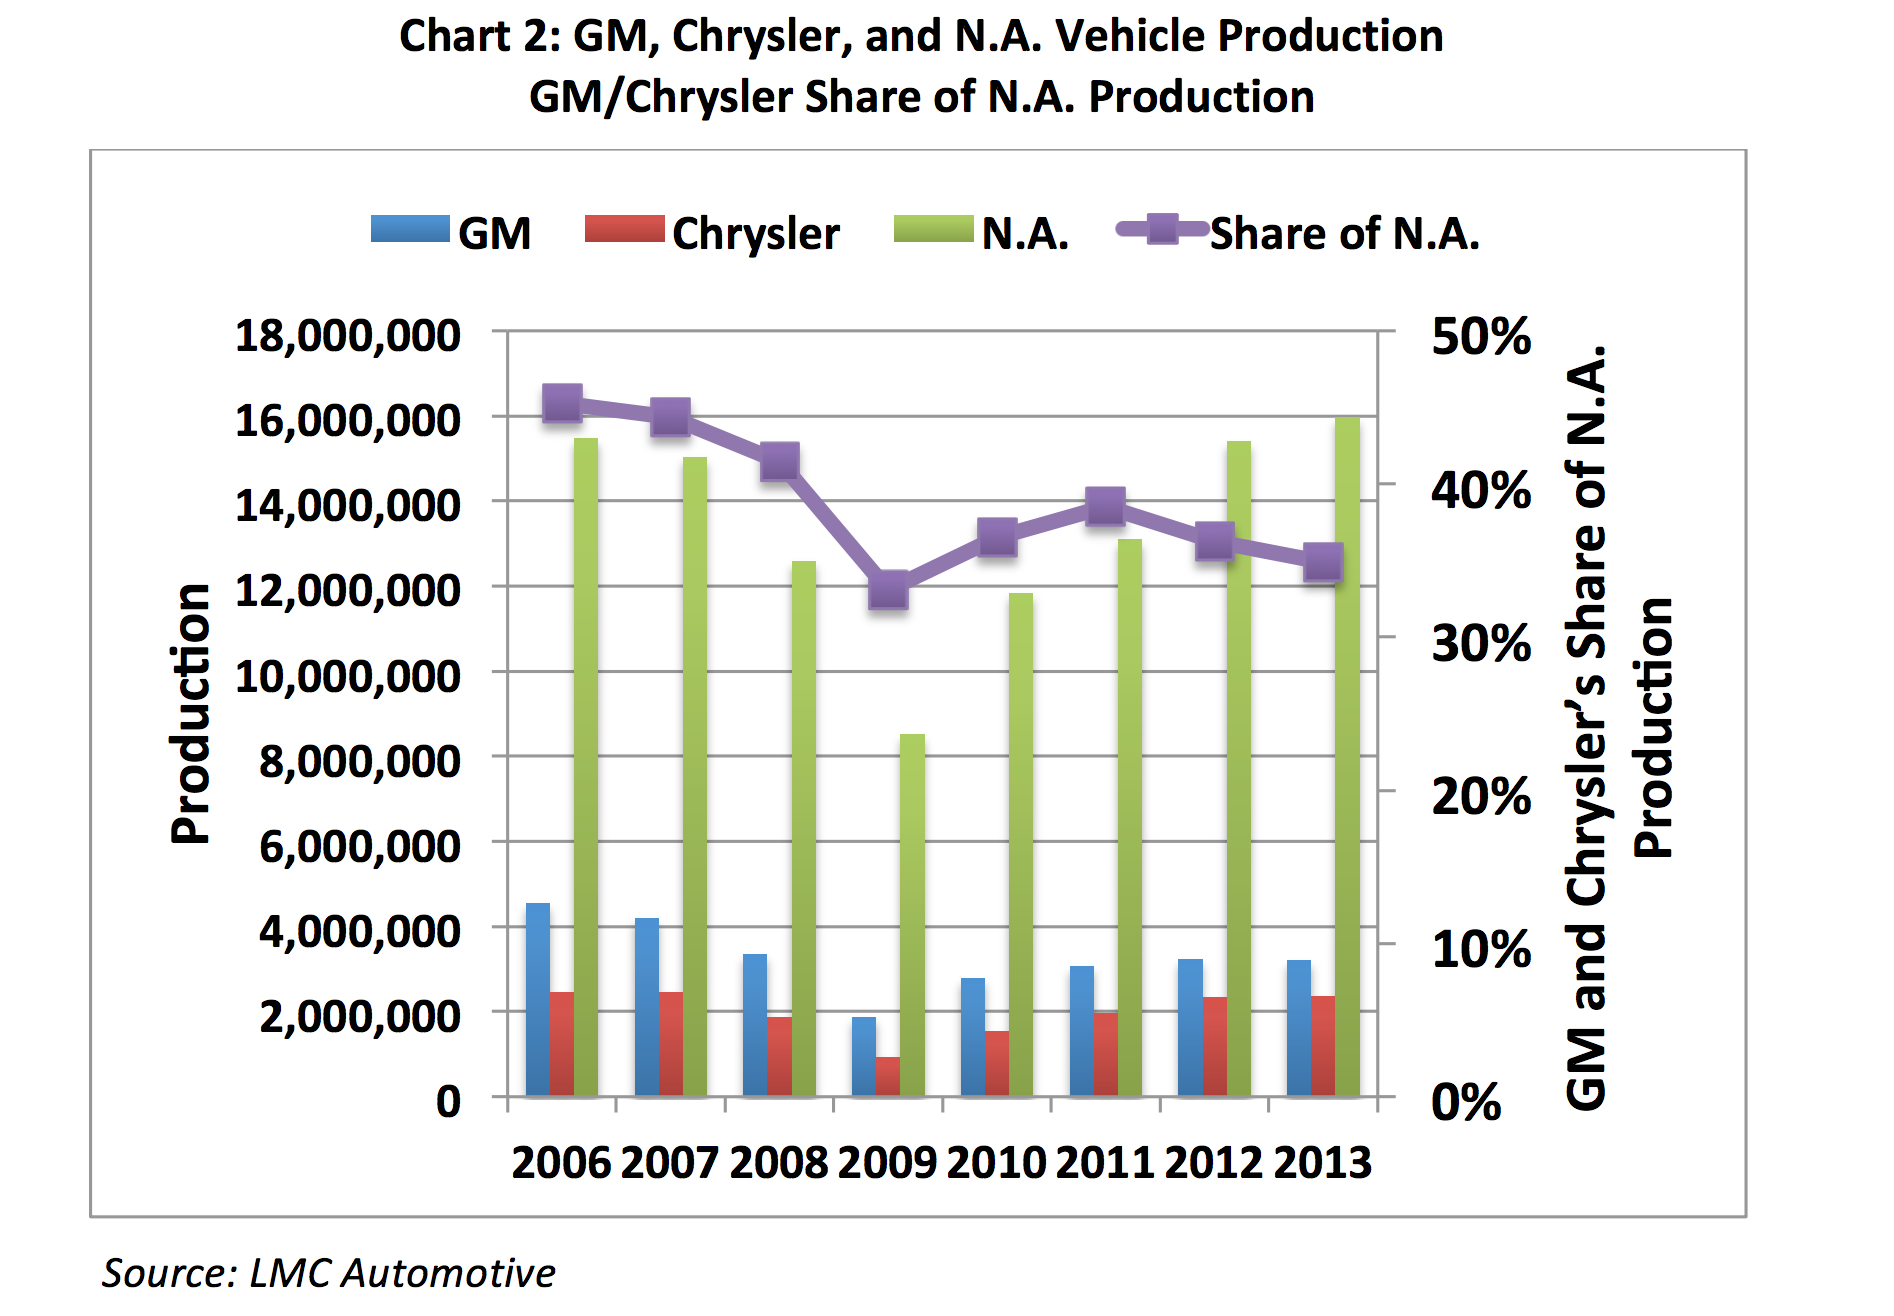
It’s 2007 and The Big Three automakers, Chrysler, General Motors and Ford, all found themselves in big trouble. They were on the verge of collapse, with wage bills spiraling out of control and foreign competition continuing to undercut their former domestic supremacy. GM’s profits were down 90% in the first quarter compared to the previous year, and the automakers looked for any means by which they could save themselves amidst the falling debris of debt, rising gas prices and cars no one wanted to buy anymore.

Most economists argue that globalization is a net positive for economic growth, benefits consumers in a number of ways and should be encouraged. It creates a more competitive environment that in theory increases not only the quality of products available to the average consumer while also decreasing their cost. The American auto market shows us a very clear example of how it works.  The Japanese and Korean automakers entered the US market and essentially took the Detroit giants out at their knees. Companies like Honda and Toyota created cheaper, more efficient and longer lasting cars than their competition and won larges swathes of the market.

In response, American automakers cut costs fast and furiously. For example, in the mid-2000’s Ford downsized significant parts of the company by closing plants in order to reduce excess production and they liquidated thousands of salaried positions. According to it’s 2005 earnings statement, Ford planned to close 14 manufacturing plants by 2012, leaving some 25,000 to 30,000 workers jobless. They did this because they did not have a demand for the vehicles at level needed to operate the facilities at full capacity. In fact, they operated at a mere 75% of capacity as of that earnings release. These initiatives were a direct result of automotive sector of the company losing almost $3.895 billion in 2005.  Eventually, Ford cut over 40,000 jobs between 2005 and 2008.
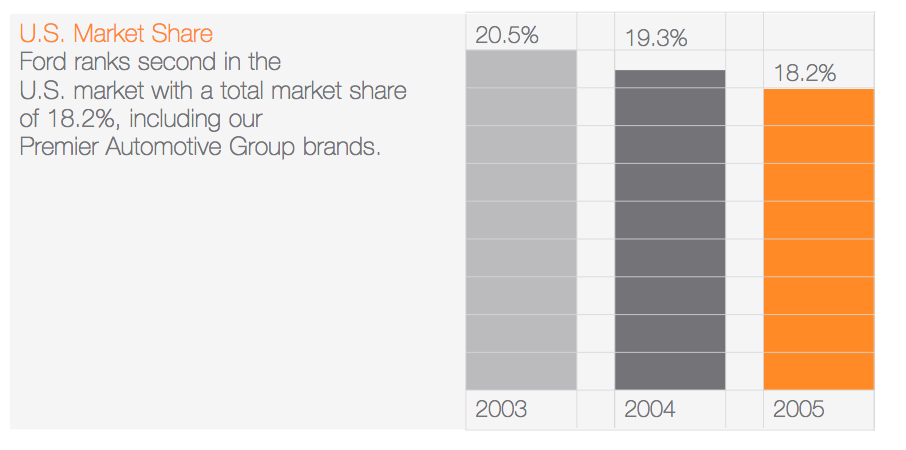
Ford’s 2005 earnings report shows trend of shrinking market share

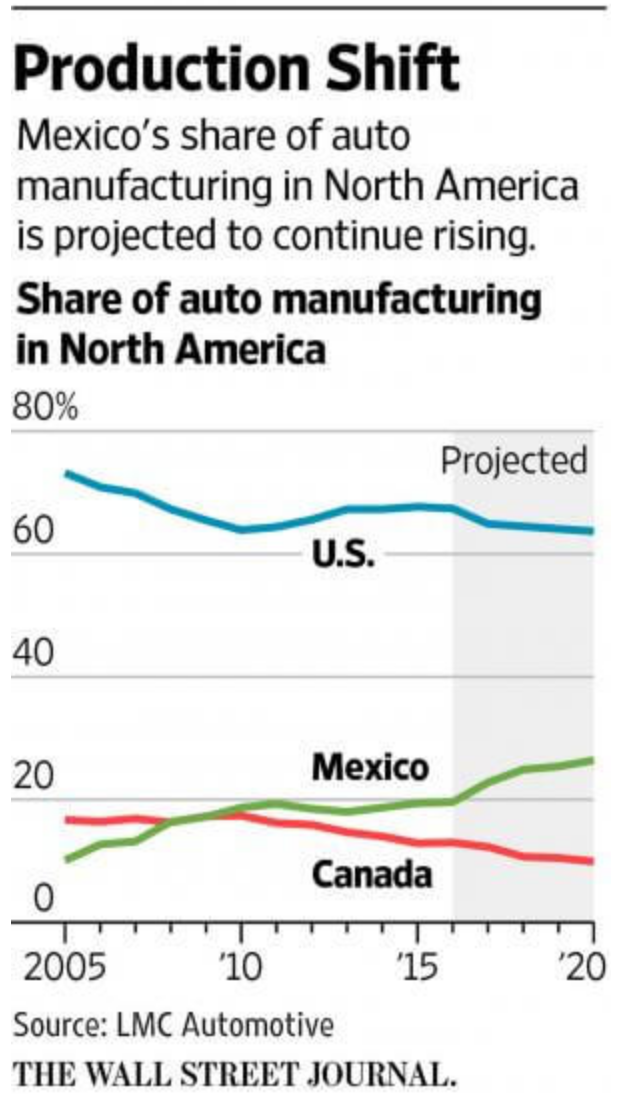
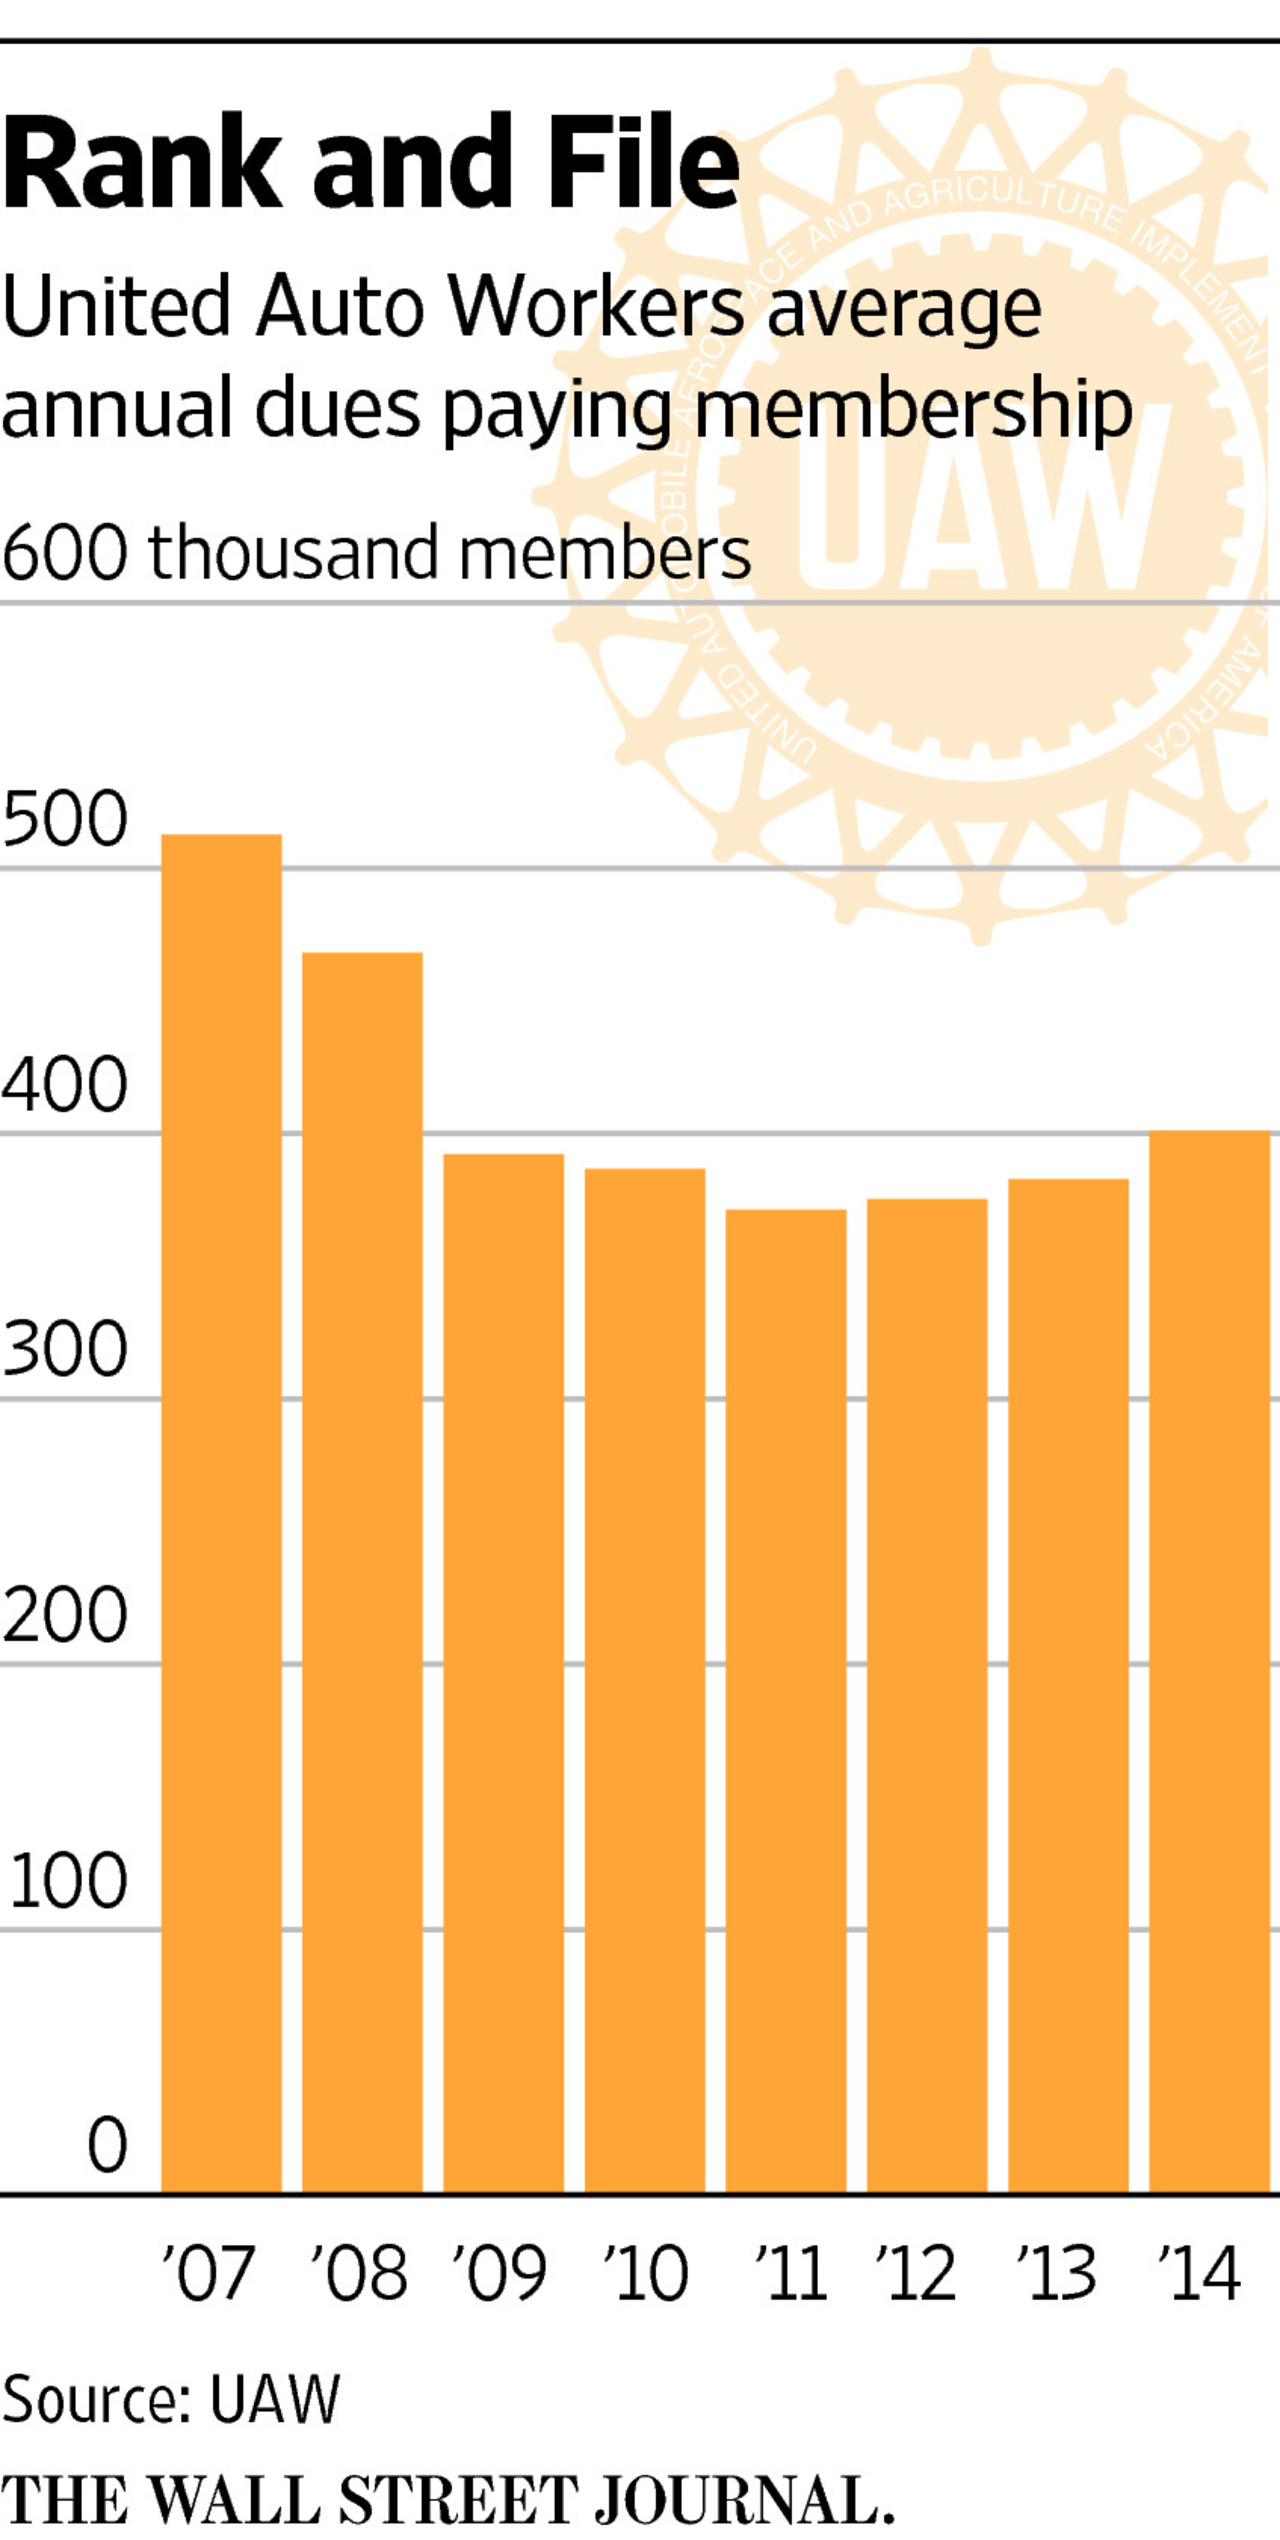
This poses a major drawback, for some, of globalization and how it effects workers; it depresses wages. This happens because workers are now faced with a market place flooded with cheaper competition. Logically, that should for the wages for American auto workers to decrease in order to compete with the foreign workers. But in this instance, the wages of the American auto worker have not shrunk to match the other entrants in the field. Author Edward McClelland points out in a Washington Post column that, “because it provides pensions and benefits that GM’s labor costs average $58 an hour, compared with $48 for Toyota and $38 for Volkswagen.” So the Big Three cut jobs, shut down factories and continued to move production into cheaper wage countries like Mexico. These moves cut union membership from 1.5 million in 1979 to 400,000 members as of 2015.


The Big Three and the weakened unions had to confront the wage issue in order to find a workable path moving forward. Faced with the loss of jobs due to reductions and outsourcing, the unions agreed to system in which hourly employees hired before 2007 would have the designation of tier one or “Traditional” employees and their wages would remain frozen, but not cut. Whereas, all new hires from 2007 onward would be deemed tier two employees, and their pay would be capped permanently, with no hope of ever matching the rates of tier-one employees. Basically, they imposed a wage ceiling of $19 an hour on newer hires, no matter how long they worked there, while the longer tenured employees could make up to $28 an hour. The move was justified as a means to save thousands of factory jobs in the U.S. A move that has been since in other companies such as Kroger’s supermarket chain and United Parcel Service. Many point to Ronald Reagan’s use of tiered wages against government employees at USPS in 1984, as the first instance of its use in the US. Now the automakers were betting on its efficacy as well.


The Bailout

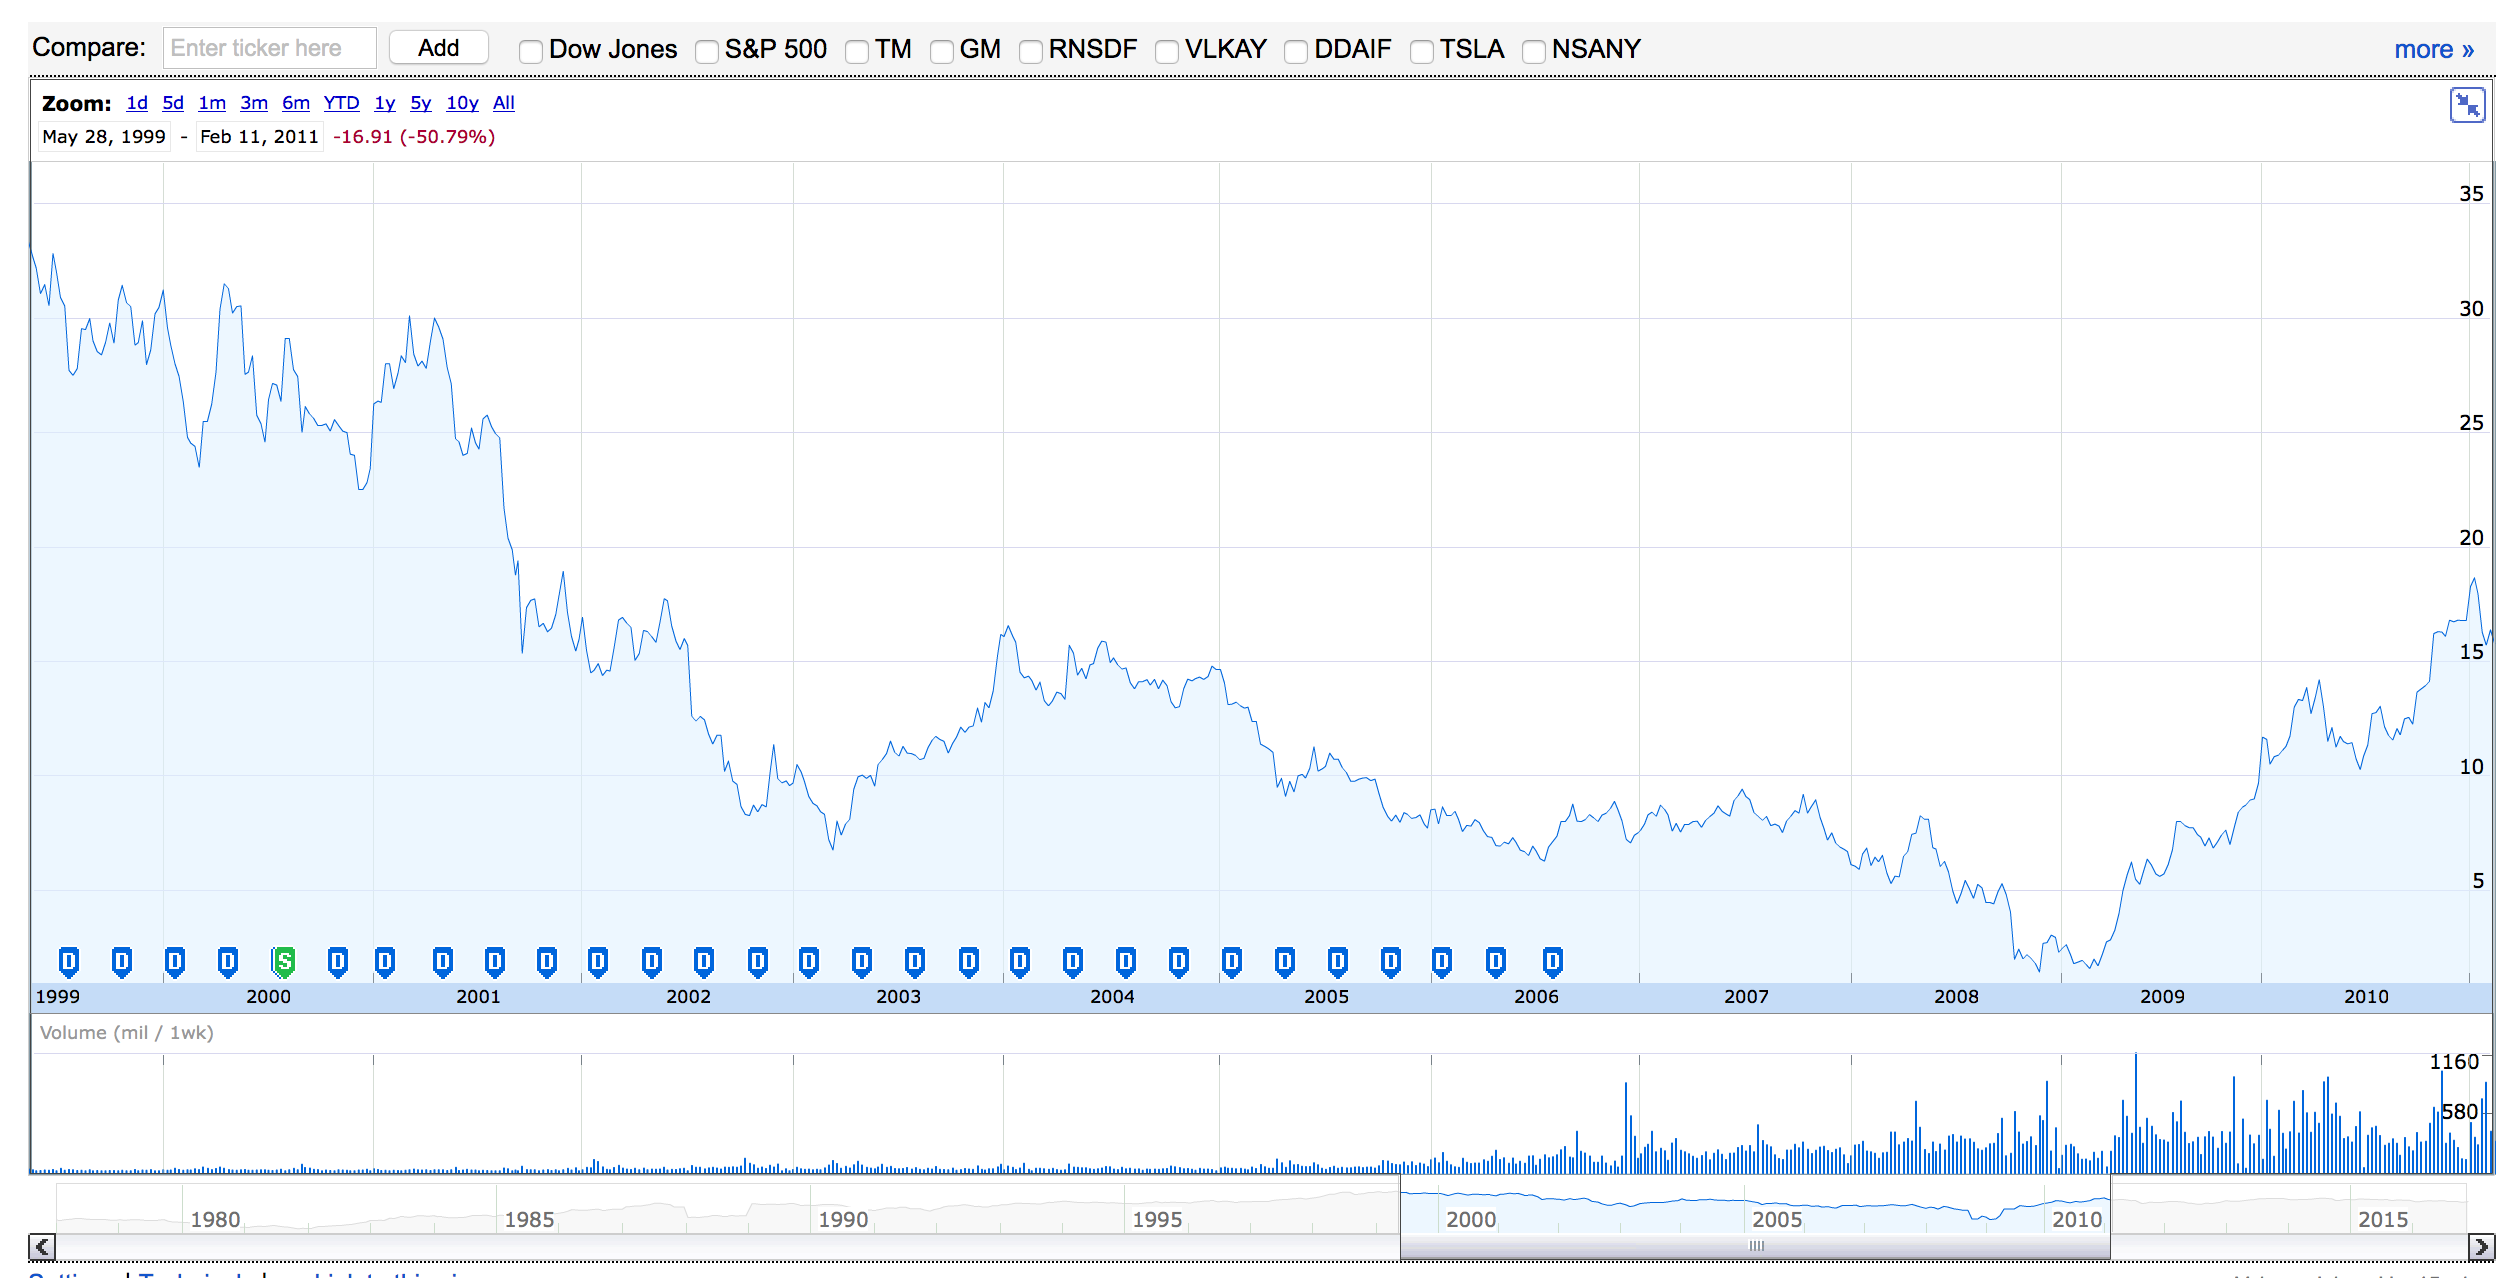
Initially, the plan did not make a major impact. We know an enormous number of factors played into the demise of the Big Three. After all, if you look at the Ford’s stock over the past 15 years, we see a massive downward trend from 2000, far before the financial collapse, until it scraped the bottom of the barrel in 2008. Foreign competition battered the Big Three, and drastically reduced not only their market share. For a number of years, the Americans could still bank on consistent sales volume to maintain, but after the recession demand dried up producing the crippling blow. Now higher labor costs became an even more significant point of contention in explaining why they couldn’t keep up. Soon Chrysler and GM teetered on insolvency. Ford hung in, but could’ve easily tumbled as well.

Ford Stock Price 2000-2010 Source: Google Finance

In late 2009, both Chrysler and GM filed for chapter 363 bankruptcy. In response, despite some calls to allow the companies to fail, the Obama administration intervened to prevent an, “Industrial Lehman Brothers Effect.” By utilizing TARP, the Troubled Asset Relief Program instituted under President Bush in 2008, the government dispersed $49.5 billion to GM, $17.17 billion to Ally Financial, the former financial arm of General Motors, and $11.96 billion to Chrysler in various loans, bankruptcy payments and share purchases. As a result of this agreement, Chrysler went under the dominion of Fiat, and the two companies merged to become Fiat Chrysler Automobiles US.

Ford, after initially taking part in conversations about a bailout, decided to walk away from the negotiations. It drew on lines of credit that they established in 2006 by mortgaging assets ad setting up long-term borrowing plans for the credit crisis in 2008. This allowed the company to infuse itself with life preserving liquidity to weather the storm of contraction in 2009 and 2010 which included; shrinking sales numbers and, consequently, shrinking production output.

These actions undoubtedly saved a number of jobs, and allowed the American auto industry to continue to exist as we know it. The Center for Automotive Research released a report on the topic in 2013, “Our results show the U.S. government saved or avoided the loss of $105.3 billion in transfer payments and the loss of personal and social insurance tax collections—or 768 percent of the net investment.” The report continues, “Additionally, 2.6 million jobs were saved in the U.S. economy in 2009 alone and $284.4 billion in personal income saved over 2009-2010.” But what did a lot of these “saved” jobs pay? A fair number of them didn’t pay what they used to, and that was the intention. But the results are difficult to argue against. Ford added more than 17,000 hourly jobs in the last five years through in-sourcing, and brought back production of certain pickup truck models from Mexico. Meanwhile FCA brought in around 15,000 new workers since their bankruptcy 2009.


Removing the Limiter

The US government attached a number of stringent restructuring requirements to the bailouts of Chrysler and GM. Initially, the tiered wage plan, as agreed to in the labor negotiations of 2007, prevented the Big Three from having any more than 20% of their work-force constituted by tier-two employees. After GM and FCA filed for chapter 363 bankruptcy in 2009, Obama lifted that restriction. The cap was supposed to be reinstituted during labor negotiations in 2011, when the companies became profitable again, but that did not happen and the tiered wage agreement continued. According to the New Labor Forum, FCA’s workforce consisted of up to 45% tier-two employees before the most recent collective bargaining sessions in 2015, while Ford’s number sat at 29% and GM at 20%. As a consequence of having the most tier two workers, FCA saw the greatest benefits to this plan. It saw wages drop to an average of $48 dollars an hour, according to the Center for Automotive Research, as compared to Ford whose costs rested at $57 an hour.

But Ford still pointed to the new agreement as a key factor in their regaining international competitiveness. From its 2011 earnings report, “In 2011 we signed a four-year agreement with the United Auto Workers that will help us improve our global competitiveness. As a result, we will be investing $16 billion in the U.S. and adding new jobs at our U.S. manufacturing facilities.” They also reported an increase of pre-tax operating profit for their North American operations to $6.2 billion. A massive change from the losses they faced back in 2005. Obviously, many factors play into that resurgence, but wage cost reductions were a major talking point for all of American auto makers.
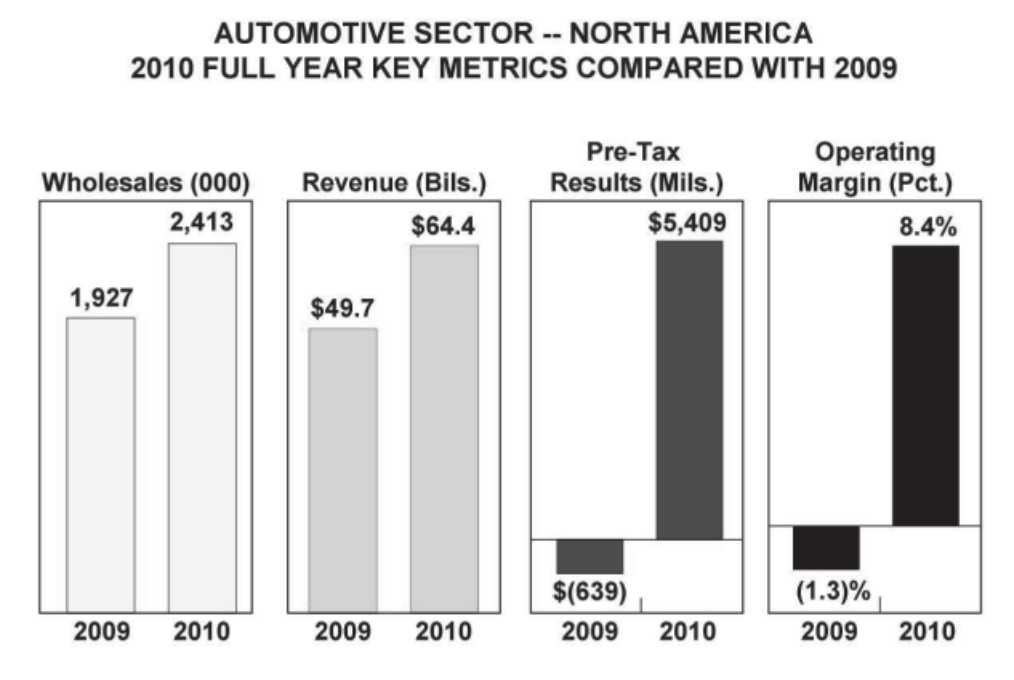
Source: Ford’s 2011 end of year earnings report


The Downside of Tiered Wages

While the new wage structures helped retain many jobs, and played a role in the revitalization of auto industry in the US, sometimes things resonate on a deeper level than just spreadsheets. The wage gaps between employees, with no possibility of ever closing, caused a lot of discontent amongst the workforce. A fact acknowledged on both sides of the negotiations. Imagine getting a job and working alongside people doing the same job, and yet you will never receive the same pay. Many of these workers had close relationships with one another as well, which only made the disparity more difficult to bear for some.

In an excellent article for The Nation about the growing trend of tiered wages in the US, Louis Uchitelle talks about a father and son, Gary and Karl Hoeltge, who both work on a GM assembly line in St. Louis. Karl feels disillusioned with the work and has his sights set elsewhere, in part because, “I’ll never catch up to my father’s pay—not if the union allows the present setup to continue.” Uchitelle describes how father and son must refrain from discussing the issue at the dinner table so they don’t upset the rest of the family. The divisiveness of wage tiers seeping into home life is important to note, because one can imagine how those same feelings must render themselves in the workplace.

The Hoeltge’s paint just one example of the discontent that many autoworkers felt in regards to the tiered wage system. Trey Durant, a 20-year factory employee for Chrysler, has strong feelings on the issue, “Working in the same facility, side by side with someone who has a different wage than you was a bad idea, even though I know why they had to do it when times were tough,” He says. “I want my brothers and sisters to be at full wage also.” And even FCA CEO Sergio Marchionne, whose company benefited the most from this arrangement, called the system unsustainable and pushed for it to end.

The UAW worried that the increasing number of tier two employees at the factories would more firmly entrench the system. Whether they worried about younger workers making ends meet as Trey Durant says or worried about being forced out for cheaper labor themselves is anyone’s guess. What we do know is that the unions made ending the two tier system a key point in labor negotiations with the Big Three in 2015. Ultimately, they reached an agreement that instituted a new eight-year track for new hires to eventually reach the same wage rate as tier one employees. So the controversial wage tiers are no more.


Conclusion

Ford utilized the advantages of tiered wages when in-sourcing jobs back from Mexican plants, but now they have to rethink their strategies.  “The business case for in-sourcing is more challenged with today’s agreement versus the prior agreement,” said Joe Hinrichs, Ford’s President of the Americas to Automotive news. “…there will be business choices over time that will have to be looked at, given the new cost structure that we have.” These wage structures made it economically beneficial for the big Three to keep jobs in the US, and now that they’re gone it will be interesting to see what actions they take next to try and keep earnings high. The bail-out and tiered wages certainly helped punch up the economic recovery, but how will these companies choose to compete with foreign competition going forward?

For the worker, the ever evolving market place, in the end, is the primary difficulty they have to face. Tiered wages may have cause unrest amongst the employees, but ultimately they allowed many people to attain jobs they otherwise would not have. Faced with the looming threats of increased automation and further outsourcing to Mexico it appears many of these workers have picked a losing fight.
Market Inefficiencies in the NBA

When the “Moneyball” revolution occurred in baseball the ideas it posited spread rapidly to other sports. You could see a revolution of numbers-based analytical analysis and other financial-market principles dictating the actions of a team taking place in just about every American sport. In the NBA it manifested itself quickly in both the growth of analytics and a more market-based approach to team building strategy. Michael Lewis, author of Moneyball, even wrote an article for the New York Times focusing on the unseen value of NBA player Shane Battier.

battier

Among the many ideas that Billy Beane’s A’s teams popularized was finding market inefficiencies in the league that you could identify though statistical analysis, and then exploit those insights for your team’s benefit. Basically, you want to find an aspect of team building that no one else is seeing, or is seeing incorrectly, and then you’re gonna make a move that counters the logic everyone else is working under. In a league like the NBA, where everyone works under the restraints of the salary cap, these small advantages of thinking make a massive difference in terms of results.

beane

Photo Credit: Phelan M. Ebenhack

One way that teams find these advantages is through identifying “undervalued assets” or players that many teams in the league do not want because they see them as ineffective, but the astute manager sees how these players can be developed and utilized in the proper role to succeed for their teams.

I spoke to a friend who works in asset management for a private hedge fund. He told me that he was struggling with the challenges of the work. He told me that the most difficult part to figure out was that everyone in the industry is working off the same pool of information, or that’s how it’s “supposed” to be anyway, and that he had to figure out what everyone else was thinking, and then find a different angle of investment in order to make money. In a competitive environment where everyone’s jobs are dictated by the returns they create the stress this causes is palpable, even when you’re just talking to someone about it.

The same principles apply to personnel professionals in the NBA. Everyone has access to the same information, or at least they should in theory, on the players available to sign, trade or draft, and it’s these people are judged based on their returns i.e. win totals and in-game attendance. As everyone has become more attuned to league-wide trends, it becomes more difficult to find the asset that other teams are undervaluing, and thus the market becomes more competitive. As Patrick Minton of Sportsstudies.net says, It’s one thing to have a ton of data. It is entirely another thing to know what to do with it.”

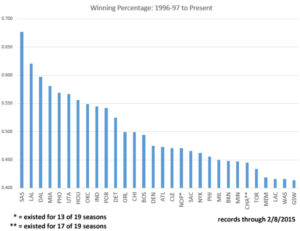
The San Antonio Spurs, under head coach Gregg Popovich and general manager RC Buford, have operated successfully this way for years. They brought many players in from Europe and South America to play for them, when many other teams had decided most players from abroad could not thrive in the NBA. The Spurs exploited the rest of the league’s lack of knowledge of these talent pools. That combined with superstar Tim Duncan helped them win five NBA championships and win the most games of any NBA team since 1996.

pop-chart-narrow

Source: Sports Illustrated

Daryl Morey, the GM of the Rockets and one of the biggest proponents of NBA “moneyball” principles, popularized the idea of amassing assets to package in trades for star players. A risky move because the trade may never come, and players don’t often appreciate being treated like a stock in your portfolio, but it worked when he attained superstar James Harden in a trade with the Oklahoma City Thunder.

These strategies show the value in having the intuitive ability to see the landscape of conventional thinking, but then have the courage to make the counter-intuitive move in order to exploit it. Much like in the financial markets if you go with the conventional logic, then you limit the margin on the returns you can generate. These assets are not easy to identify, and with the increasing amount of information at team’s disposal it’s becoming more difficult by the day.


How a Tiny Region in Belgium Tried to Kill a Major Trade Deal

Where in the world is Wallonia? That’s a serious question. Do you know the answer? I’ll admit I didn’t. Not until I read about how a tiny agricultural region in Belgium that threw the brakes on a major European Union trade agreement with Canada. So how did a small region from a very small country disrupt a major economic policy agreement?

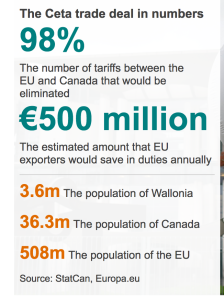
To begin, the treaty is entitled Ceta which stands for Comprehensive Economic and Trade Agreement, and it aims to do what trade deals always do: lift restrictions on economic activity between Canada and the EU. The European commission claims that, “It will lift 99% of custom duties and many other obstacles for business.” The commission also mentions specifically that this deal will, “fully uphold Euorpe’s standards in areas such as food safety and worker’s rights.” An important point for Wallonia.

screen-shot-2016-11-03-at-8-57-44-am

Ceta has been in the works for nearly seven years. A long negotiation to be sure, but why was it so difficult? When dealing with the EU one would think that you are negotiating with one major political entity, but in this instance it was more like trying to negotiate with all 28 member states at one time. That’s because in this deal the EU granted veto power to every single member state. So if you couldn’t convince everyone to agree on this deal, then you might as well have convinced no one.

Enter the French speaking Belgian parliamentary region of Wallonia. A place that represents the voices of a mere 3.6 million people, which is a tiny number when compared to the number of people whose lives would be affected by the passage of Ceta. It has influence because Belgium has a system that prohibits a singular central government from signing these treaties for itself. The government is comprised of six separate parliaments that each represent different geographic or linguistic division within the country, and each gets a veto on any trade deal signed by the Belgians. So the Flemish parliament gets a vote, the Brussels-centered Parliament gets a say and one vote says the Wallonians can stop the whole deal.

So in this instance, the Canadians aren’t just dealing with the EU, they’re dealing with Belgium, because Belgium can torpedo the whole deal, and to convince Belgium they have to work with, you guessed it, Wallonia led by Minister-President Paul Magnette. But why did Wallonia want to stop a major trade deal? Because their major industry is agriculture, and their socialist political leadership wanted to put up a fight to protect their constituents from facing cheaper agricultural goods coming in from Canada. The classic protectionist political story that we’ve seen since the British Corn Laws. The Wallonia parliament also strove for stronger safeguards on labor, environmental and consumer standards.

So what did this all amount to? A four-page addendum to a 1,600-page trade agreement. Kind of a let down. The Walloons celebrated the concession they grabbed as a major victory. Basically, what they got was special court system to determine if investor-state tribunals are compatible with EU Law and a guarantee that the Belgian government can assess the socio-economic impact of Ceta. What the Walloon government really won was political influence. They used anti-globalization sentiment around Europe, and leveraged it in order to say they were protecting the workers.

Source: Wall Street Journal

Source: Wall Street Journal

However, the deal still went through, and it is the first major trade agreement signed by the EU with an industrialized nation. The EU leadership and Canadian Prime Minister signed the deal into provisional action earlier this week, and now it must go up for full ratification with the more than 30 national and regional parliaments that make up the EU. So Wallonia didn’t manage to stop global trade, but it does show worrying signs for those trying to consecrate trade agreements with the EU. Countries like the US and post-Brexit Britain will certainly take note.

The Economic Realities of an Independent Catalonia

The debate surrounding Catalan independence has swirled with varying degrees of fervor for hundreds of years. Back in the 1600’s Catalans fought for freedom from the Spanish crown in the Reaper’s War which they ultimately lost. Since then the region has remained in a strained relationship with the Spanish Central government. Whether that government was a monarchy, democracy or fascist dictatorship the Catalans have always felt a distinctly separate cultural and ethnic identity from the rest of Spain. Similar sentiments exist in other Spanish regions such as the Basque Country and Navarre, as well as other European regions such as Scotland, in the UK, and the Umbria region of Northern Italy.

In more recent years, the arguments from separatist groups have taken a decidedly more economic bend. They have been fueled by the European debt crisis and other major economic issues facing Spain, and signal a bit of a change from the arguments from yesteryear. Even during the Spanish Civil War, which was largely fought between German and Italy-backed Nationalists and Soviet-backed Communists, the Catalans were largely in league with the anarchists whose economic policies you can probably guess weren’t too fully formed based on the fact that, you know, they were anarchists.

So this new approach is a stark change of tact for independistas, but don’t let the new paint job fool you. Despite the difference in content the underlying message is the same. They are still leveraging the historic trend of Catalan mistrust of the Madrista government and deeply felt regional pride to push for an independent Catalonia. Only now their arguments center on unfair taxation and mounting regional debt, instead of language and literature.

But does this rhetoric hold up to objective economic scrutiny?

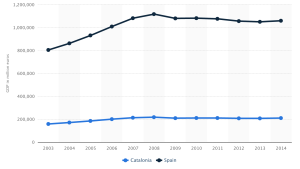
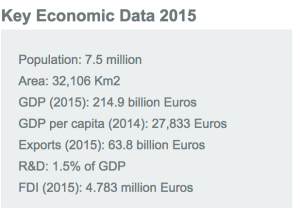
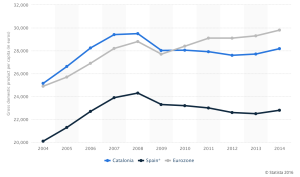
If we look at raw numbers we can see that Catalonia comprises a significant portion of the overall Spanish GDP. In 2014, Spain’s total GDP was about $1.1 Trillion, according to World Bank, with Catalonia consistently accounting for around 20% of that figure, or just over 200 Billion euros, despite only comprising 16% of the nation’s population at 7.5 million people. Catalan GDP per capita was just over 28,000 euros in 2014, just behind the Euro-zone figure of just under 30,000 euros. But it was over 20% higher than the average Spaniard, thus making it one of the wealthiest regions in the country.

screen-shot-2016-10-08-at-12-03-23-amSource: Statista

Two major drivers of the region’s economy are both the export and transport of goods. Catalonia accounted for 25.5% of Spain’s total exports in 2015. Barcelona, the regional capital, is the third largest port in Spain, and Catalonia handles 70% of exports from the rest of Spain. Based on these strengths it would certainly hurt Spain to lose the one of its most economically powerful regions. It would hinder trade, and levy a sharp blow on the overall country’s overall economic output. Conversely, it could put Catalonia in danger of facing tariffs and boycotts on its goods which would harm its trade-dependent economy. Dangers loom for both sides in the event of a separation.

screen-shot-2016-10-08-at-12-01-07-am

Catalonia Region Economic Data (Source: World Bank)

So what’s driving the Catalan’s push for economic separation? Two things: a major debt crisis and the perception of unfair taxation. But what do we find when we look at these issues more closely? Let’s look at the debt issue first.

Despite the region’s economic strength it is still the holder of the largest regional debt in Spain. The meteoric rise of Spanish debt as a result of the European debt crisis was felt by the entire country, but it’s an issue that has become a particular flash point for Catalans.

screen-shot-2016-10-08-at-12-04-08-am

Catalonian GDP per capita compared to Spain and the Eurozone (Source: Statista)

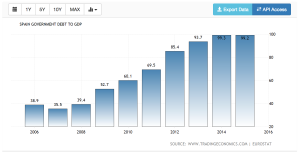
After a brutal recession in 2008, and a second recession hit in 2012 and debt in greater Spain soared from 65.9% of GDP in 2011 to 85.4% in 2012. This reality led the Spanish central government to levy harsh austerity measures in an attempt to get the debt situation under control. They froze public sector wages and cut government spending by 12%. Combined with a regional unemployment rate of 22% in 2012, Catalans came face to face with a daunting combination of economic issues.

In attempting to service the debt the Spanish government made it more difficult for regions, like Catalonia, to jump start their economy through classic Keynesian stimulus plans. This is also a consequence of the Euro currency system which does not allow individual country to create their own monetary policy in order to ease the blow of recessions.  Perhaps that fact forces Madrid’s hand to austerity measures, but not many Catalans want to hear excuses for the Madridistas. The economic results, or lack thereof, of these actions certainly does not help matters. Despite severe austerity measures Spanish national debt debt rose to 99.3% of its total GDP in 2014, and then shrunk slightly to 1.1 trillion euros, in 2015.

screen-shot-2016-10-10-at-11-08-23-pm

Source: Trading Economics

The question of how the two sides will allocate this debt is essential to understanding the possible economic consequences of Catalonian Secession. If the two nations agree that the Catalans should take 19% of the debt with them, or the same amount of money they contribute to Spanish GDP, then the effects on Spanish national debt after losing the region would be marginal, because they would lose the same share of debt, as they lose in total GDP.

However, if the central government allows the Catalans to leave with 16% of the debt, which matches their population size, or even 11% which would equate to government expenditures in the region then, according to economist Xavier Sala-i-Martin, Spain’s national debt could rapidly approach unsustainable levels. Even worse, If the Spanish central government comes to no debt transfer agreement with the Catalans it could mean that they leave without taking on their share of the Spanish national debt. This would be legally dubious, but possible,  and it would cause Spanish debt to explode. It’s estimated that debt levels would rise to nearly 125% of total Spanish GDP due the multiplying effect of losing the Catalan contribution to the national GDP while also taking on more debt. This eventuality could lead to a Spanish default. However, if the Catalans attempt to leave with no economic agreement they could surely expect to face harsh economic sanctions from Spain. Possibly even Spain blocking Catalonia’s entry into the EU because countries need unanimous approval for entry.

With both sides facing dangerous outcomes from secession, it can be difficult to understand why this independence movement has gained so much traction. But by investigating Spanish taxation practices we can see why so many Catalans, who are already predisposed to mistrust the central government, feel independence is their only option to receive fair treatment.

In response to central government austerity and rising debts, the Catalan regional government requested a payment of around 5.57 billion euros from Madrid, and not in the form of a loan. They wanted this as repayment for what they see as unfair taxation policies by the Central government.

According to a survey taken by the Catalan regional government in 2014, 80% of the Catalan population felt the central government taxed them at an unfairly high rate. In the populace’s view, too much money was taken without reinvesting enough of it back into Catalan infrastructure and social programs. These concerns led to the slogan, “España nos roba,” (Spain is robbing us), and fueled the pro-independence parties that were elected throughout the region in September 2015.

The question of whether Spain is truly “robbing” the Catalan people quickly becomes more complicated than it initially appears, and certainly more complex than the independentistas of Catalonia want their supporters to believe.

If we use the figures given by the Catalan government, they lose 8.5% of its GDP to the central government every year. Independentistas argue that if they left Spain then this money would simply stay in the region for the people to use at their own discretion and help curtail their rising debt. Those on the remain side respond that if you take into account the amount of public spending on services and infrastructure paid for by the national government then this number of “saved” GDP would shrink to around 4-5%.

screen-shot-2016-10-08-at-12-05-37-am

Source: Statista

Around the world, it is not uncommon for a wealthy region, such as Catalonia, to pay a higher share of taxes that are then redistributed to less wealthy regions. A 2014 study by Wallet Hub illustrates how this very principle exists here in the US. For example, a state like New Jersey received only $0.88 for every dollar they put into federal income tax. Meanwhile Mississippi, a relatively poor state, gets $3.07 back for every dollar they put into the system.

So if this happens regularly elsewhere are the Catalans just being unreasonably greedy? Maybe, but maybe not.

In a 2012 study published by Barcelona’s Pompeu Fabra University, researchers found that Catalonia accounted for 118.6%, of national taxes per capita which placed it third out of the 15 regions in Spain. After the redistribution of taxes its per capita distribution of tax money fell to 99.5% of the national average, placing it 11th. Conversely, Extremadura, a remote, mountainous region along the Spanish border with Portugal, which ranked 14th in national taxes per capita at 76.6%, rose to third place in per capita tax revenues after redistribution by receiving 111.8% of average government resources per capita.

Taking a step back, it’s clear that a combination of austerity tactics to cut down debt and improper tax redistribution created an environment ripe for separatism, though some analysts hold out hope that the situation can be rectified. “We continue to believe that the secessionist fervor is a response to fiscal austerity,” analysts at Credit Suisse say. “Much of it would calm down if the Madrid government re-negotiates intra-regional transfers with Catalonia and the region is allowed to have more tax autonomy.”

Catalans can point to the Basque Country and Navarre regions of Spain, as examples of fiscal policy that, if granted to Catalonia, may help settle talks of secession. Both of those regions have agreements with the central government allowing them to keep most of their tax revenues without sending them to the Spanish government. Perhaps if the central government institutes smart changes, or merely weathers the storm, then the winds of secession will die down.

Economics of the English Premier League

I want to talk to you about Craig Bellamy and Andrew Ayew. If you’re not a big fan of English Premier League you’re probably wondering who those two guys are, and what could possibly make them interesting enough to talk about.

ayew

NORWICH, UNITED KINGDOM - JULY 31: Craig Bellamy of West Ham United in action during the Pre Season Friendly match between Norwich City and West Ham United at Carrow Road on July 31, 2007 in Norwich, England. (Photo by Matthew Lewis/Getty Images) *** Local Caption *** Craig Bellamy

NORWICH, UNITED KINGDOM – JULY 31: (Photo by Matthew Lewis/Getty Images) *** Local Caption *** Craig Bellamy


Photo Credit: Arfa Griffiths via Getty Images


Well, they are both footballers who play the same position. Bellamy is retired, and Ayew plays currently for the London-based soccer club West Ham United where Bellamy used to play. They are interesting because they represent the effect of an insane revenue boom in the EPL, and how that has changed the economic dynamics of the one of the most popular sports leagues in the world.

In 2016, the EPL penned a new £5.13 billion broadcast rights deal which rose more than £2 billion from the previous agreement. This money is then spread amongst all the teams in the league. Imagine the EPL as a nation, and their GDP just swelled in size because the G, in this scenario the league itself, just poured a bunch of money into every team.

In past years, we have seen increases in I, or individual investment, in past years when billionaire oil magnates bought teams and injected them with loads of cash i.e. Chelsea and Manchester City, but those moves didn’t affect spending trends league wide. This time, the money has been helicoptered into small teams like Watford, as well as the giants like Manchester United. And unlike in Japan, those teams sure have spent that money.

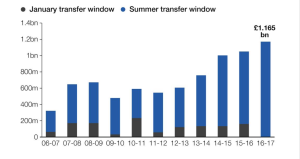
This past summer alone teams in the EPL spent over a £1.165 billion on transfers. Trumping the gross spend from the previous summer of £870 million, and continuing an astonishing upward trend from the start of the window in 2003, in which teams outlayed a “paltry” £235 million.

screen-shot-2016-09-19-at-2-49-22-pm

Chart Source: Deloitte

Why is this happening? If we look at it through the lens of economist David Ricardo’s theory of marginal rents we can glean insight into why the trend of transfer spending has spiked so fantastically. I would point to those players and clubs on the “margin”, basically those teams that are average performers in the league, to see why spending continues to rise throughout the league.

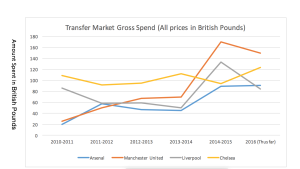
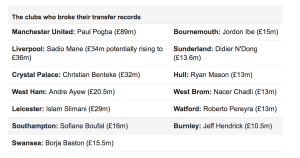
screen-shot-2016-09-20-at-9-10-03-am screen-shot-2016-09-19-at-3-02-14-pm

Look at the number of record transfers that happened this past window, and then notice the spike in spending by the four teams in the chart on the right. The reason why those teams must spend even more now is because what the average team will pay for the average player has skyrocketed, and driven up the cost of players for those at the top of the league.

This brings me back to our old friends Andrew Ayew and Craig Bellamy. You can see Ayew’s name on that chart next to the £20.5 million he cost this past summer. Back in the summer of 2007, Bellamy, a player of a very similar skill-level and position, came to the same club for £7.5 milion. That is a huge jump in what that team would pay for that player in a mere eight years, and if we look at Ricardo we know that if the team on the “margin” can pay £20.5 million then that drives up the what the good clubs play for good players, and then what the elite clubs must pay for elite players. Thus creating the new market value for all players and the record spending for the clubs. After all, clubs still need players to sell tickets and TV rights.

This appears to be the new reality in the Premier League, and fans will have to get used to the dizzying amount of pounds spent on footballers as the trend continues to skyrocket.

Dumpster Diving for an Economic Indicator

You have probably heard the old saying, “One man’s trash is another man’s treasure,” more times than you can count. When I hear it, I think of uncovering some gem at a garage sale or, as my roommates in New York once did, finding perfectly usable bunk beds stacked on the curbside trash pile. But, would you ever consider using trash as a tool to measure the strength of an economy?

Economic indicators consist of wildly varying selection of measures, but one of the most well known measures is a nation’s GDP or Gross Domestic Product. The GDP measures the size of a nation’s economy. One major component of GDP is how much stuff people consume. Organizations track this by keeping tabs on the sales numbers for basic items such as clothes and food, and all the way up to large ticket purchases such as homes and cars.

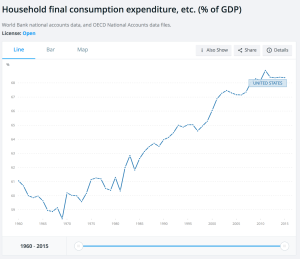
The US definitely loves buying stuff. Consumption made up about 68% of the American GDP in 2014, according to the World Bank, which makes it by far the strongest and heaviest member of America’s economic family. And what’s the natural by product of our America’s insatiable appetite for stuff? Well, that would be waste. This leaves us with an obvious question: can we look at the amount of waste we produce to learn how our economy is performing?

Screen Shot 2016-08-31 at 11.02.36 AM

Back in 2010, Bloomberg economists Michael McDonough and Bob Willis investigated that very question. No, they didn’t go around weighing garbage bags or following trash trucks. Instead, they measured how many train cars of trash traversed around the country. The American Association of Railroads tracks figures on the amount of steel and iron waste created, as well as municipal waste that cities, such as New York and Seattle, throw on trains headed out to landfills in other states.

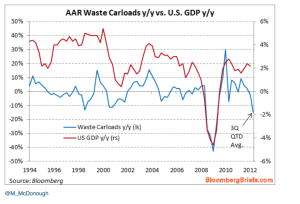
They learned that by looking at these numbers one could determine growth or shrinkage of the economy. Bloomberg studied a period beginning in the first quarter of 2001 until the same period in 2010, and found that the number of cars carrying waste had a correlation of .82 with the growth of GDP, meaning that they grew in a nearly synchronized manner. Makes sense right? The more things created and consumed, means more things that are replaced, go bad or end up as leftovers in the process.

This chart, from Bloomberg in 2012, illustrates the strong relationship between our trash and our GDP dating all the way back to 1994:

Screen Shot 2016-08-30 at 9.19.05 PM

In a 2012 interview with Market Place’s Kai Ryssdall, McDonough described why measuring waste gives such insight into the growth of the economy. He said, “It’s holistic because it’s not isolated to a single part of the economy. It’s people throwing things out, it’s buildings being demolished — it’s everything… I mean, if you’re going to build a new building, there might be a building that’s already there. If you buy a couch, you might be throwing out an old couch. If you go out to McDonald’s and you buy something, you’re going to throw something out. ”

Screen Shot 2016-08-30 at 9.19.15 PM

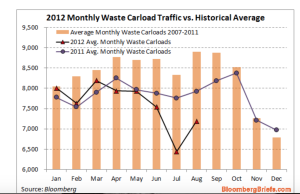
The only problem with this measure is that looking at waste will not tell you much about the future, but instead about what’s already happened. As waste comes about as the end product of consumer decisions. Even McDonough admits, “it’s more of a lagging indicator.” Though the AAR’s figures do become available before the BEA can calculate our GDP. So a slight advantage does exist for the particularly ardent trawler of trash stats.

Sadly though, it appears that anyone hoping to amass a fortune from tracking trash probably won’t uncover too much treasure.